
|
|||||
|
 | |
| |
| |
| |
| |
| |
|
Gene: VPS29 |
Gene summary for VPS29 |
| Gene information | Species | Human | Gene symbol | VPS29 | Gene ID | 51699 |
| Gene name | VPS29 retromer complex component | |
| Gene Alias | DC15 | |
| Cytomap | 12q24.11 | |
| Gene Type | protein-coding | GO ID | GO:0006810 | UniProtAcc | F8VXU5 |
Top |
Malignant transformation analysis |
| Identification of the aberrant gene expression in precancerous and cancerous lesions by comparing the gene expression of stem-like cells in diseased tissues with normal stem cells |
| Entrez ID | Symbol | Replicates | Species | Organ | Tissue | Adj P-value | Log2FC | Malignancy |
| 51699 | VPS29 | HTA11_347_2000001011 | Human | Colorectum | AD | 6.40e-06 | 3.90e-01 | -0.1954 |
| 51699 | VPS29 | HTA11_866_3004761011 | Human | Colorectum | AD | 2.50e-02 | 2.10e-01 | 0.096 |
| 51699 | VPS29 | HTA11_99999970781_79442 | Human | Colorectum | MSS | 2.83e-04 | 4.22e-01 | 0.294 |
| 51699 | VPS29 | HTA11_99999965104_69814 | Human | Colorectum | MSS | 1.90e-05 | 4.67e-01 | 0.281 |
| 51699 | VPS29 | A015-C-203 | Human | Colorectum | FAP | 8.83e-07 | -9.59e-02 | -0.1294 |
| 51699 | VPS29 | A001-C-108 | Human | Colorectum | FAP | 3.18e-02 | -4.15e-02 | -0.0272 |
| 51699 | VPS29 | A002-C-205 | Human | Colorectum | FAP | 1.19e-05 | -1.08e-01 | -0.1236 |
| 51699 | VPS29 | A015-C-006 | Human | Colorectum | FAP | 8.39e-04 | -1.00e-01 | -0.0994 |
| 51699 | VPS29 | A002-C-114 | Human | Colorectum | FAP | 2.47e-05 | -2.08e-01 | -0.1561 |
| 51699 | VPS29 | A015-C-104 | Human | Colorectum | FAP | 6.56e-08 | -1.14e-01 | -0.1899 |
| 51699 | VPS29 | A001-C-014 | Human | Colorectum | FAP | 1.83e-02 | -1.03e-01 | 0.0135 |
| 51699 | VPS29 | A002-C-016 | Human | Colorectum | FAP | 4.52e-09 | -1.19e-01 | 0.0521 |
| 51699 | VPS29 | A015-C-002 | Human | Colorectum | FAP | 3.26e-02 | -1.66e-01 | -0.0763 |
| 51699 | VPS29 | A002-C-116 | Human | Colorectum | FAP | 2.00e-07 | -7.79e-02 | -0.0452 |
| 51699 | VPS29 | A014-C-008 | Human | Colorectum | FAP | 2.72e-03 | -1.31e-01 | -0.191 |
| 51699 | VPS29 | A018-E-020 | Human | Colorectum | FAP | 2.34e-04 | -1.31e-01 | -0.2034 |
| 51699 | VPS29 | F034 | Human | Colorectum | FAP | 4.34e-06 | -1.67e-01 | -0.0665 |
| 51699 | VPS29 | AEH-subject1 | Human | Endometrium | AEH | 4.73e-03 | -5.01e-02 | -0.3059 |
| 51699 | VPS29 | AEH-subject2 | Human | Endometrium | AEH | 2.50e-04 | -2.13e-01 | -0.2525 |
| 51699 | VPS29 | AEH-subject3 | Human | Endometrium | AEH | 1.09e-07 | -1.54e-01 | -0.2576 |
| Page: 1 2 3 4 5 6 7 8 9 |
| Tissue | Expression Dynamics | Abbreviation |
| Colorectum (GSE201348) |  | FAP: Familial adenomatous polyposis |
| CRC: Colorectal cancer | ||
| Colorectum (HTA11) |  | AD: Adenomas |
| SER: Sessile serrated lesions | ||
| MSI-H: Microsatellite-high colorectal cancer | ||
| MSS: Microsatellite stable colorectal cancer | ||
| Endometrium |  | AEH: Atypical endometrial hyperplasia |
| EEC: Endometrioid Cancer | ||
| Esophagus | 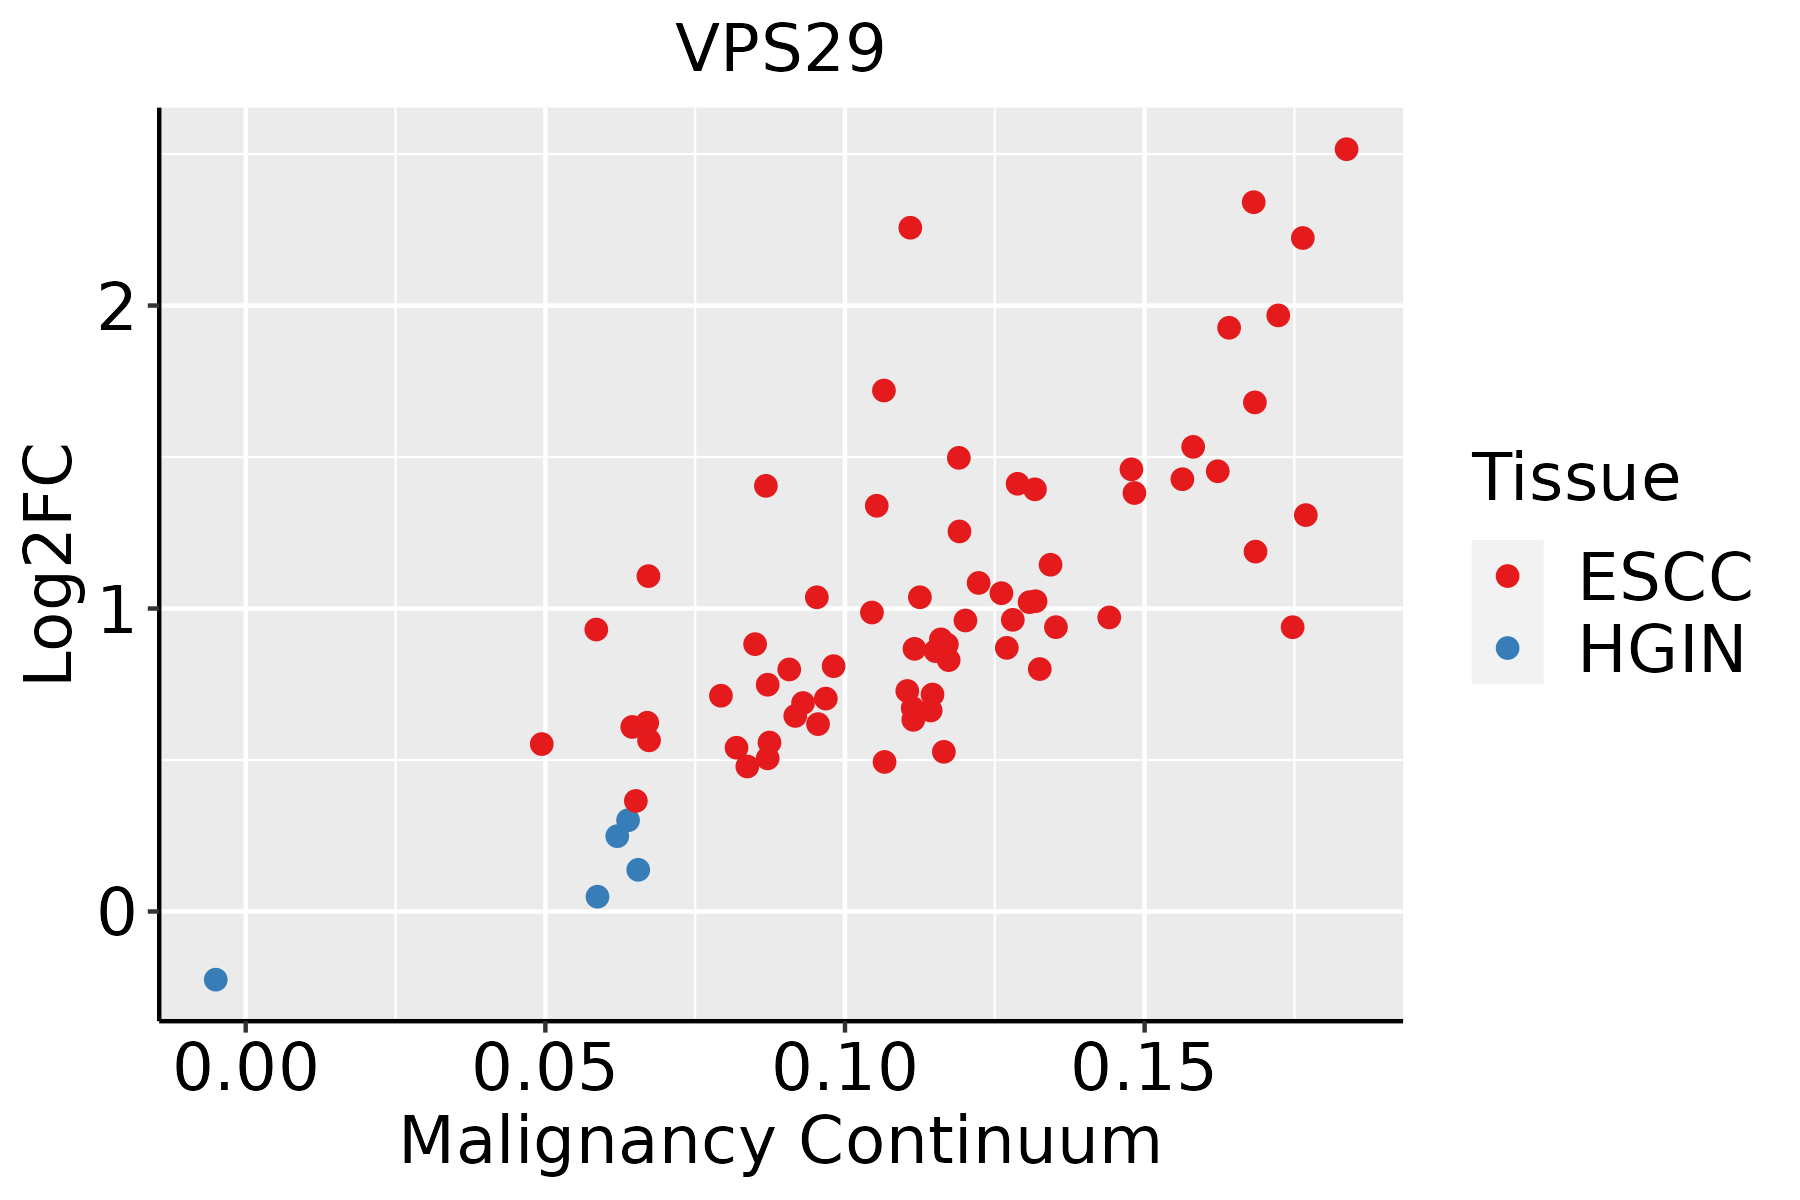 | ESCC: Esophageal squamous cell carcinoma |
| HGIN: High-grade intraepithelial neoplasias | ||
| LGIN: Low-grade intraepithelial neoplasias | ||
| Liver |  | HCC: Hepatocellular carcinoma |
| NAFLD: Non-alcoholic fatty liver disease | ||
| Oral Cavity | 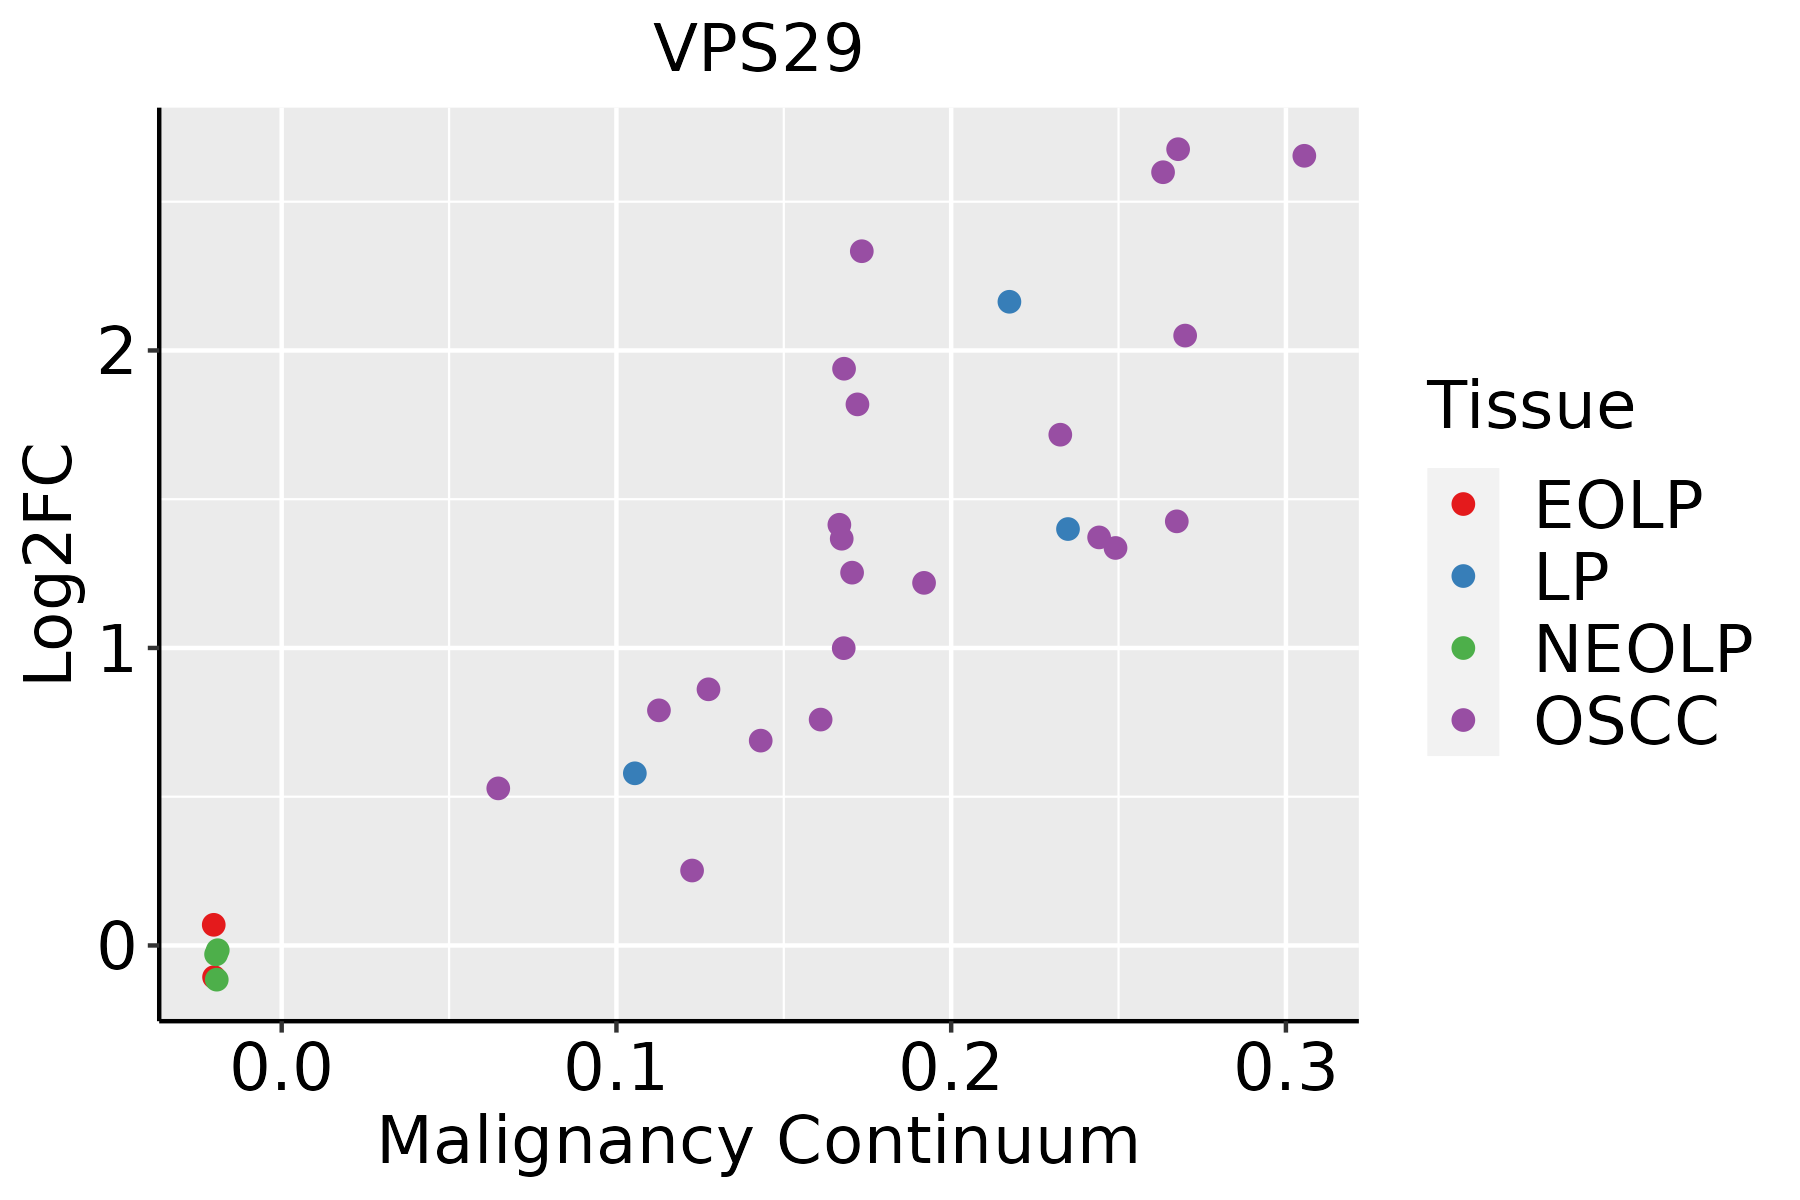 | EOLP: Erosive Oral lichen planus |
| LP: leukoplakia | ||
| NEOLP: Non-erosive oral lichen planus | ||
| OSCC: Oral squamous cell carcinoma | ||
| Prostate | 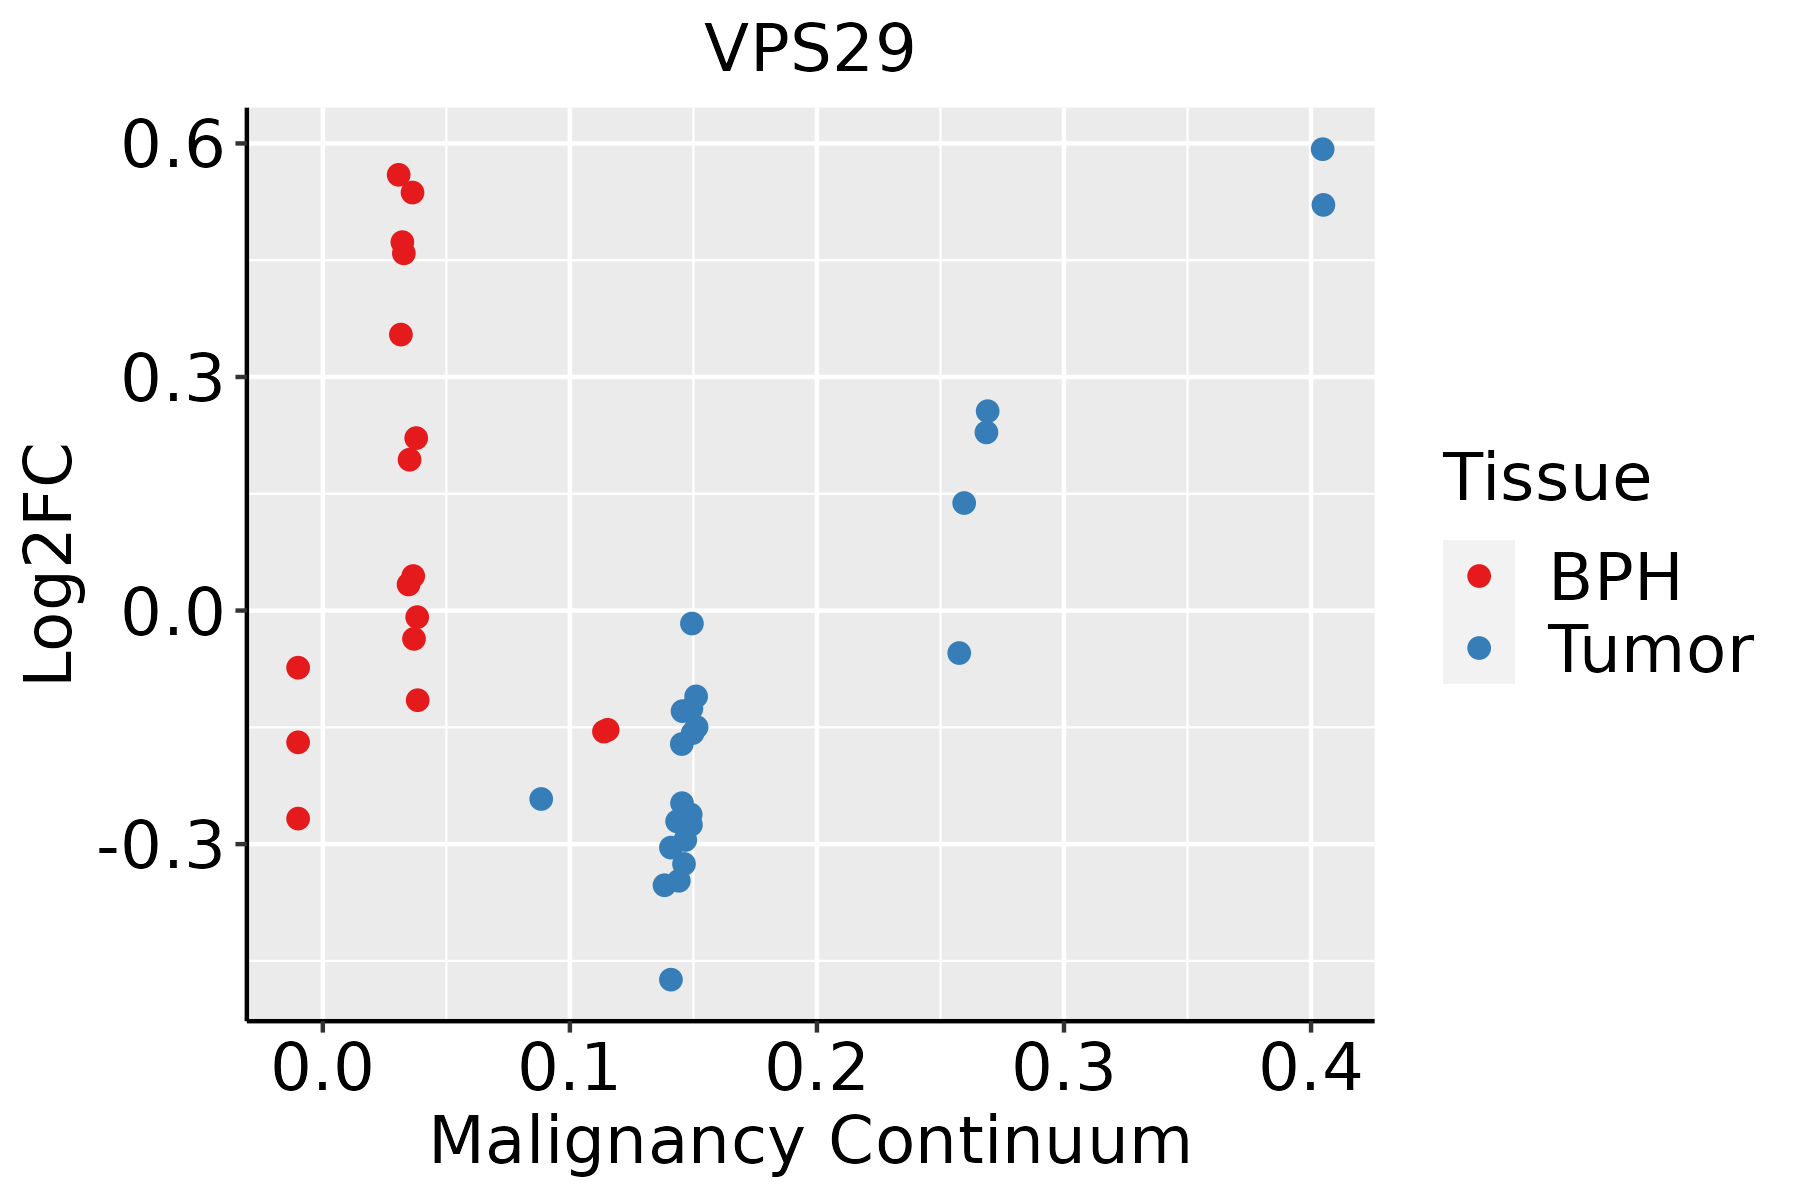 | BPH: Benign Prostatic Hyperplasia |
| Skin | 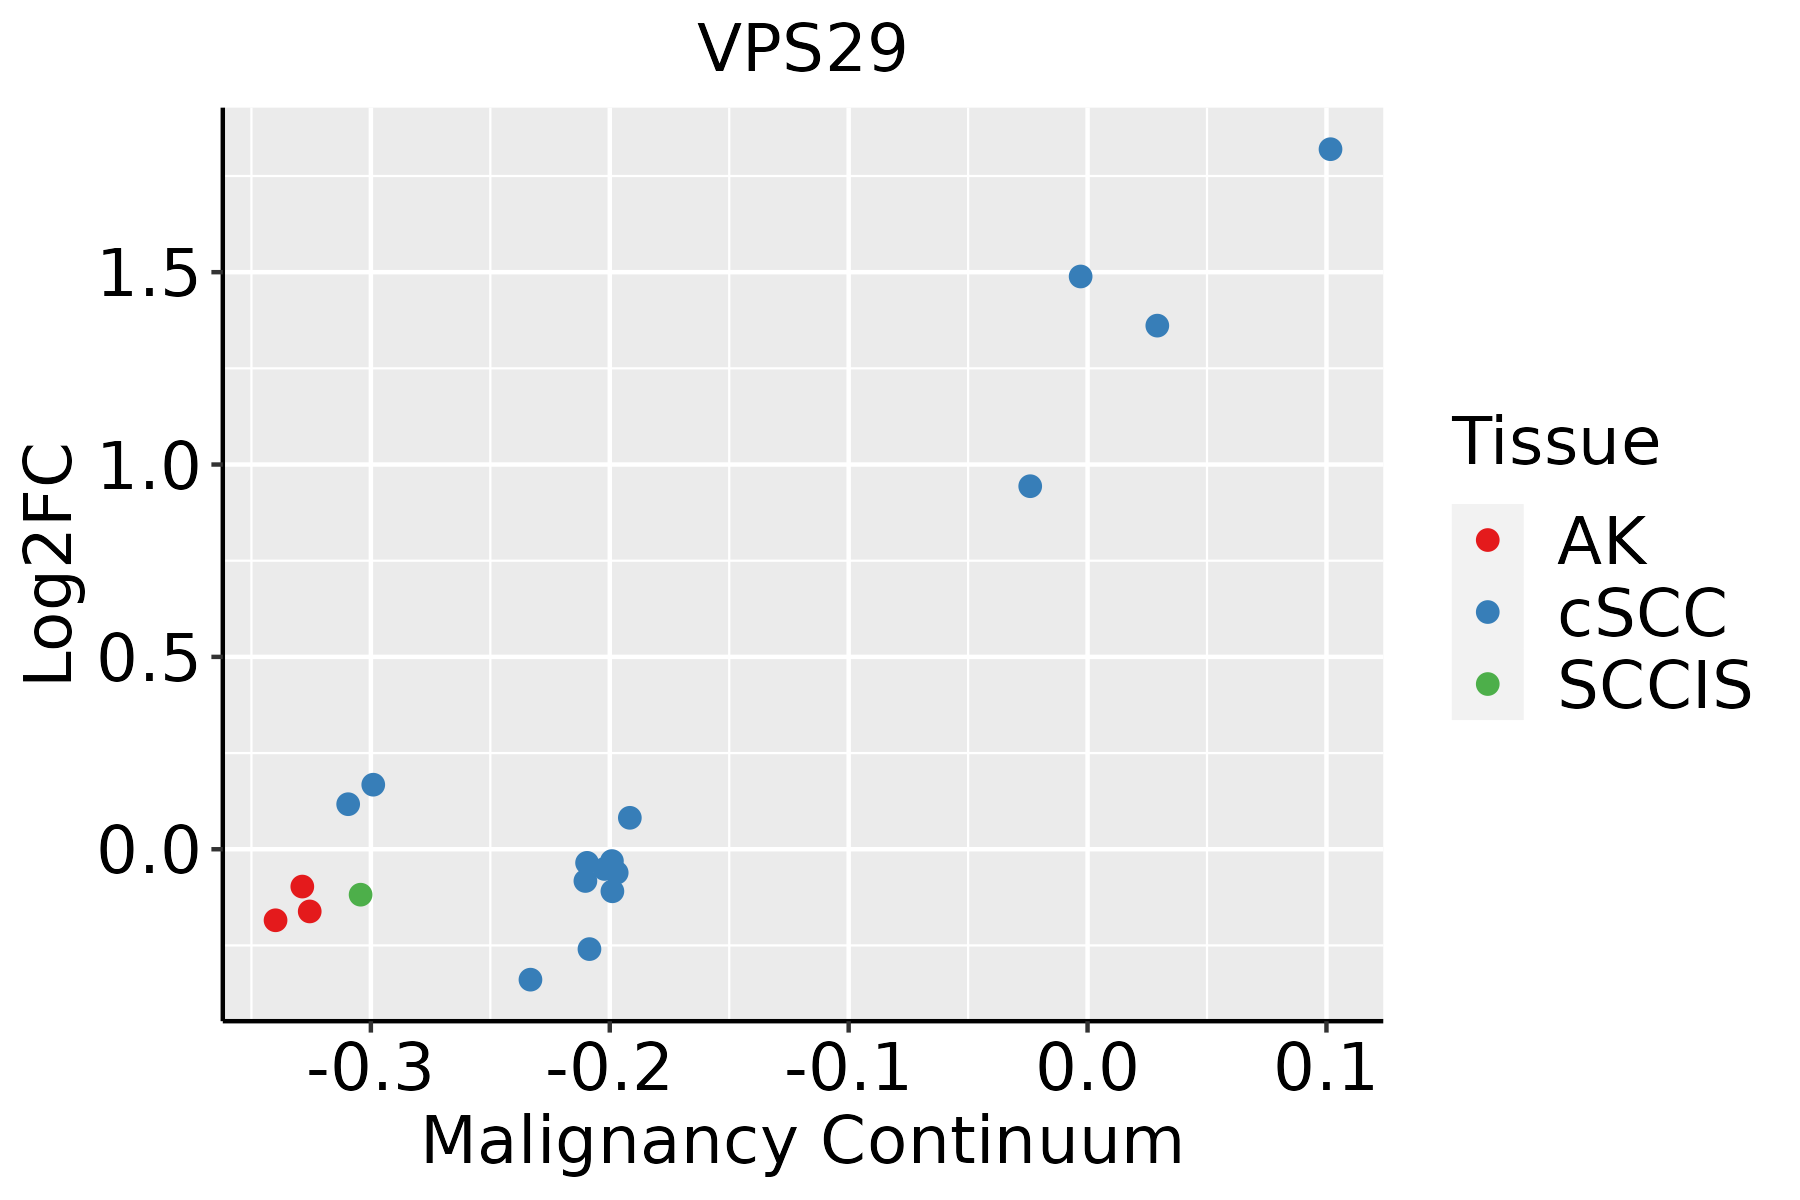 | AK: Actinic keratosis |
| cSCC: Cutaneous squamous cell carcinoma | ||
| SCCIS:squamous cell carcinoma in situ | ||
| Thyroid |  | ATC: Anaplastic thyroid cancer |
| HT: Hashimoto's thyroiditis | ||
| PTC: Papillary thyroid cancer |
| ∗log2FC in expression of this searched gene in stem-like cells from each diseased tissue sample relative to stem-like cells in normal samples in each tissue plotted against the malignancy continuum. Samples are colored based on if they are from different disease stage. |
Top |
Malignant transformation related pathway analysis |
| Find out the enriched GO biological processes and KEGG pathways involved in transition from healthy to precancer to cancer |
| Tissue | Disease Stage | Enriched GO biological Processes |
| Colorectum | AD |  |
| Colorectum | SER |  |
| Colorectum | MSS |  |
| Colorectum | MSI-H |  |
| Colorectum | FAP |  |
| ∗Top 15 enriched GO BP terms are showed in the bar plot of each disease state in each tissue. Each row represents a significant GO biological process which is colored according to the -log10(p.adjust). |
| Page: 1 2 3 4 5 6 7 8 9 |
| GO ID | Tissue | Disease Stage | Description | Gene Ratio | Bg Ratio | pvalue | p.adjust | Count |
| GO:0016197 | Colorectum | AD | endosomal transport | 90/3918 | 230/18723 | 1.88e-10 | 1.73e-08 | 90 |
| GO:0016482 | Colorectum | AD | cytosolic transport | 68/3918 | 168/18723 | 6.00e-09 | 3.72e-07 | 68 |
| GO:0098876 | Colorectum | AD | vesicle-mediated transport to the plasma membrane | 57/3918 | 136/18723 | 2.30e-08 | 1.27e-06 | 57 |
| GO:0042147 | Colorectum | AD | retrograde transport, endosome to Golgi | 37/3918 | 91/18723 | 1.46e-05 | 3.14e-04 | 37 |
| GO:0032456 | Colorectum | AD | endocytic recycling | 28/3918 | 73/18723 | 4.87e-04 | 5.30e-03 | 28 |
| GO:00988762 | Colorectum | MSS | vesicle-mediated transport to the plasma membrane | 54/3467 | 136/18723 | 6.20e-09 | 3.95e-07 | 54 |
| GO:00161972 | Colorectum | MSS | endosomal transport | 79/3467 | 230/18723 | 7.04e-09 | 4.39e-07 | 79 |
| GO:00164822 | Colorectum | MSS | cytosolic transport | 59/3467 | 168/18723 | 2.29e-07 | 9.79e-06 | 59 |
| GO:00421471 | Colorectum | MSS | retrograde transport, endosome to Golgi | 33/3467 | 91/18723 | 4.78e-05 | 8.71e-04 | 33 |
| GO:00324561 | Colorectum | MSS | endocytic recycling | 26/3467 | 73/18723 | 4.05e-04 | 4.99e-03 | 26 |
| GO:00988763 | Colorectum | FAP | vesicle-mediated transport to the plasma membrane | 42/2622 | 136/18723 | 3.16e-07 | 1.78e-05 | 42 |
| GO:00164823 | Colorectum | FAP | cytosolic transport | 47/2622 | 168/18723 | 1.58e-06 | 6.72e-05 | 47 |
| GO:00161973 | Colorectum | FAP | endosomal transport | 56/2622 | 230/18723 | 1.79e-05 | 4.53e-04 | 56 |
| GO:00421472 | Colorectum | FAP | retrograde transport, endosome to Golgi | 26/2622 | 91/18723 | 2.21e-04 | 3.14e-03 | 26 |
| GO:001619710 | Esophagus | HGIN | endosomal transport | 57/2587 | 230/18723 | 5.74e-06 | 1.81e-04 | 57 |
| GO:009887610 | Esophagus | HGIN | vesicle-mediated transport to the plasma membrane | 36/2587 | 136/18723 | 6.76e-05 | 1.55e-03 | 36 |
| GO:001619715 | Esophagus | ESCC | endosomal transport | 168/8552 | 230/18723 | 2.28e-17 | 1.93e-15 | 168 |
| GO:001648210 | Esophagus | ESCC | cytosolic transport | 124/8552 | 168/18723 | 9.69e-14 | 4.69e-12 | 124 |
| GO:009887615 | Esophagus | ESCC | vesicle-mediated transport to the plasma membrane | 99/8552 | 136/18723 | 1.13e-10 | 3.39e-09 | 99 |
| GO:00421477 | Esophagus | ESCC | retrograde transport, endosome to Golgi | 63/8552 | 91/18723 | 4.58e-06 | 4.87e-05 | 63 |
| Page: 1 2 3 |
| Pathway ID | Tissue | Disease Stage | Description | Gene Ratio | Bg Ratio | pvalue | p.adjust | qvalue | Count |
| hsa04144 | Colorectum | AD | Endocytosis | 111/2092 | 251/8465 | 5.95e-12 | 1.42e-10 | 9.08e-11 | 111 |
| hsa041441 | Colorectum | AD | Endocytosis | 111/2092 | 251/8465 | 5.95e-12 | 1.42e-10 | 9.08e-11 | 111 |
| hsa041444 | Colorectum | MSS | Endocytosis | 102/1875 | 251/8465 | 1.85e-11 | 4.43e-10 | 2.71e-10 | 102 |
| hsa041445 | Colorectum | MSS | Endocytosis | 102/1875 | 251/8465 | 1.85e-11 | 4.43e-10 | 2.71e-10 | 102 |
| hsa041446 | Colorectum | FAP | Endocytosis | 78/1404 | 251/8465 | 6.20e-09 | 2.96e-07 | 1.80e-07 | 78 |
| hsa041447 | Colorectum | FAP | Endocytosis | 78/1404 | 251/8465 | 6.20e-09 | 2.96e-07 | 1.80e-07 | 78 |
| hsa0414420 | Endometrium | AEH | Endocytosis | 56/1197 | 251/8465 | 2.58e-04 | 2.15e-03 | 1.57e-03 | 56 |
| hsa04144110 | Endometrium | AEH | Endocytosis | 56/1197 | 251/8465 | 2.58e-04 | 2.15e-03 | 1.57e-03 | 56 |
| hsa0414424 | Endometrium | EEC | Endocytosis | 57/1237 | 251/8465 | 3.34e-04 | 2.82e-03 | 2.10e-03 | 57 |
| hsa0414434 | Endometrium | EEC | Endocytosis | 57/1237 | 251/8465 | 3.34e-04 | 2.82e-03 | 2.10e-03 | 57 |
| hsa0414429 | Esophagus | HGIN | Endocytosis | 76/1383 | 251/8465 | 1.74e-08 | 3.34e-07 | 2.65e-07 | 76 |
| hsa04144113 | Esophagus | HGIN | Endocytosis | 76/1383 | 251/8465 | 1.74e-08 | 3.34e-07 | 2.65e-07 | 76 |
| hsa04144210 | Esophagus | ESCC | Endocytosis | 186/4205 | 251/8465 | 9.74e-16 | 4.66e-14 | 2.39e-14 | 186 |
| hsa0414437 | Esophagus | ESCC | Endocytosis | 186/4205 | 251/8465 | 9.74e-16 | 4.66e-14 | 2.39e-14 | 186 |
| hsa0414412 | Liver | Cirrhotic | Endocytosis | 119/2530 | 251/8465 | 2.33e-09 | 4.56e-08 | 2.81e-08 | 119 |
| hsa0414413 | Liver | Cirrhotic | Endocytosis | 119/2530 | 251/8465 | 2.33e-09 | 4.56e-08 | 2.81e-08 | 119 |
| hsa0414422 | Liver | HCC | Endocytosis | 178/4020 | 251/8465 | 2.03e-14 | 5.22e-13 | 2.91e-13 | 178 |
| hsa0414432 | Liver | HCC | Endocytosis | 178/4020 | 251/8465 | 2.03e-14 | 5.22e-13 | 2.91e-13 | 178 |
| hsa0414427 | Oral cavity | OSCC | Endocytosis | 174/3704 | 251/8465 | 9.42e-17 | 4.51e-15 | 2.29e-15 | 174 |
| hsa04144112 | Oral cavity | OSCC | Endocytosis | 174/3704 | 251/8465 | 9.42e-17 | 4.51e-15 | 2.29e-15 | 174 |
| Page: 1 2 |
Top |
Cell-cell communication analysis |
| Identification of potential cell-cell interactions between two cell types and their ligand-receptor pairs for different disease states |
| Ligand | Receptor | LRpair | Pathway | Tissue | Disease Stage |
| Page: 1 |
Top |
Single-cell gene regulatory network inference analysis |
| Find out the significant the regulons (TFs) and the target genes of each regulon across cell types for different disease states |
| TF | Cell Type | Tissue | Disease Stage | Target Gene | RSS | Regulon Activity |
| ∗The dot plots of a searched regulon are shown for all cell subpopulations in each disease state of each tissue based on the regulon specific score inferred using pySCENIC and by calculating the average expression. |
| Page: 1 |
Top |
Somatic mutation of malignant transformation related genes |
| Annotation of somatic variants for genes involved in malignant transformation |
| Hugo Symbol | Variant Class | Variant Classification | dbSNP RS | HGVSc | HGVSp | HGVSp Short | SWISSPROT | BIOTYPE | SIFT | PolyPhen | Tumor Sample Barcode | Tissue | Histology | Sex | Age | Stage | Therapy Types | Drugs | Outcome |
| VPS29 | SNV | Missense_Mutation | c.405G>C | p.Gln135His | p.Q135H | protein_coding | deleterious(0.04) | probably_damaging(0.946) | TCGA-FU-A3YQ-01 | Cervix | cervical & endocervical cancer | Female | <65 | I/II | Unknown | Unknown | SD | ||
| VPS29 | SNV | Missense_Mutation | c.167N>C | p.Lys56Thr | p.K56T | protein_coding | tolerated(0.13) | benign(0.113) | TCGA-AA-3968-01 | Colorectum | colon adenocarcinoma | Female | <65 | I/II | Unknown | Unknown | SD | ||
| VPS29 | SNV | Missense_Mutation | novel | c.530A>G | p.Asn177Ser | p.N177S | protein_coding | tolerated(0.14) | benign(0.001) | TCGA-AP-A1E0-01 | Endometrium | uterine corpus endometrioid carcinoma | Female | <65 | III/IV | Chemotherapy | paclitaxel | SD | |
| VPS29 | SNV | Missense_Mutation | novel | c.628N>A | p.Glu210Lys | p.E210K | protein_coding | tolerated(0.11) | benign(0.12) | TCGA-AX-A05Z-01 | Endometrium | uterine corpus endometrioid carcinoma | Female | <65 | III/IV | Chemotherapy | adriamycin | SD | |
| VPS29 | SNV | Missense_Mutation | novel | c.228G>T | p.Glu76Asp | p.E76D | protein_coding | tolerated(0.22) | benign(0.007) | TCGA-AX-A2HC-01 | Endometrium | uterine corpus endometrioid carcinoma | Female | <65 | III/IV | Chemotherapy | paclitaxel | PD | |
| VPS29 | SNV | Missense_Mutation | novel | c.356G>A | p.Gly119Glu | p.G119E | protein_coding | deleterious(0) | probably_damaging(1) | TCGA-AX-A2HD-01 | Endometrium | uterine corpus endometrioid carcinoma | Female | >=65 | III/IV | Unknown | Unknown | SD | |
| VPS29 | SNV | Missense_Mutation | novel | c.246N>T | p.Lys82Asn | p.K82N | protein_coding | deleterious(0) | possibly_damaging(0.904) | TCGA-B5-A1MR-01 | Endometrium | uterine corpus endometrioid carcinoma | Female | >=65 | III/IV | Unknown | Unknown | SD | |
| VPS29 | SNV | Missense_Mutation | c.466C>T | p.His156Tyr | p.H156Y | protein_coding | tolerated(1) | benign(0.019) | TCGA-B5-A1MX-01 | Endometrium | uterine corpus endometrioid carcinoma | Female | <65 | I/II | Hormone Therapy | megace | SD | ||
| VPS29 | SNV | Missense_Mutation | c.253N>A | p.Ala85Thr | p.A85T | protein_coding | tolerated(0.18) | benign(0.338) | TCGA-B5-A3FA-01 | Endometrium | uterine corpus endometrioid carcinoma | Female | >=65 | I/II | Unknown | Unknown | SD | ||
| VPS29 | SNV | Missense_Mutation | c.490N>A | p.Pro164Thr | p.P164T | protein_coding | deleterious(0) | probably_damaging(0.971) | TCGA-D1-A103-01 | Endometrium | uterine corpus endometrioid carcinoma | Female | >=65 | I/II | Unknown | Unknown | SD |
| Page: 1 2 |
Top |
Related drugs of malignant transformation related genes |
| Identification of chemicals and drugs interact with genes involved in malignant transfromation |
| (DGIdb 4.0) |
| Entrez ID | Symbol | Category | Interaction Types | Drug Claim Name | Drug Name | PMIDs |
| Page: 1 |

Copyright 2023-Present -The University of Texas Health Science Center at Houston |