
|
|||||
|
 | |
| |
| |
| |
| |
| |
|
Gene: VPS28 |
Gene summary for VPS28 |
| Gene information | Species | Human | Gene symbol | VPS28 | Gene ID | 51160 |
| Gene name | VPS28 subunit of ESCRT-I | |
| Gene Alias | VPS28 | |
| Cytomap | 8q24.3 | |
| Gene Type | protein-coding | GO ID | GO:0006464 | UniProtAcc | Q548N1 |
Top |
Malignant transformation analysis |
| Identification of the aberrant gene expression in precancerous and cancerous lesions by comparing the gene expression of stem-like cells in diseased tissues with normal stem cells |
| Entrez ID | Symbol | Replicates | Species | Organ | Tissue | Adj P-value | Log2FC | Malignancy |
| 51160 | VPS28 | GSM4909281 | Human | Breast | IDC | 7.88e-10 | 4.13e-01 | 0.21 |
| 51160 | VPS28 | GSM4909285 | Human | Breast | IDC | 1.24e-04 | 2.86e-01 | 0.21 |
| 51160 | VPS28 | GSM4909293 | Human | Breast | IDC | 3.01e-02 | 2.58e-01 | 0.1581 |
| 51160 | VPS28 | GSM4909294 | Human | Breast | IDC | 1.86e-23 | 4.08e-01 | 0.2022 |
| 51160 | VPS28 | GSM4909296 | Human | Breast | IDC | 3.08e-17 | 9.80e-03 | 0.1524 |
| 51160 | VPS28 | GSM4909297 | Human | Breast | IDC | 2.55e-24 | 1.03e-01 | 0.1517 |
| 51160 | VPS28 | GSM4909301 | Human | Breast | IDC | 1.03e-06 | 2.20e-01 | 0.1577 |
| 51160 | VPS28 | GSM4909302 | Human | Breast | IDC | 5.76e-06 | 2.16e-01 | 0.1545 |
| 51160 | VPS28 | GSM4909304 | Human | Breast | IDC | 3.13e-27 | 5.88e-01 | 0.1636 |
| 51160 | VPS28 | GSM4909305 | Human | Breast | IDC | 4.53e-03 | 2.90e-01 | 0.0436 |
| 51160 | VPS28 | GSM4909306 | Human | Breast | IDC | 1.34e-19 | 5.36e-01 | 0.1564 |
| 51160 | VPS28 | GSM4909307 | Human | Breast | IDC | 2.25e-03 | 2.38e-01 | 0.1569 |
| 51160 | VPS28 | GSM4909308 | Human | Breast | IDC | 5.29e-04 | 2.71e-01 | 0.158 |
| 51160 | VPS28 | GSM4909309 | Human | Breast | IDC | 1.70e-08 | 1.64e-01 | 0.0483 |
| 51160 | VPS28 | GSM4909311 | Human | Breast | IDC | 3.89e-54 | 3.59e-01 | 0.1534 |
| 51160 | VPS28 | GSM4909312 | Human | Breast | IDC | 2.83e-33 | 5.63e-01 | 0.1552 |
| 51160 | VPS28 | GSM4909313 | Human | Breast | IDC | 4.63e-04 | 1.20e-01 | 0.0391 |
| 51160 | VPS28 | GSM4909317 | Human | Breast | IDC | 6.88e-43 | 7.68e-01 | 0.1355 |
| 51160 | VPS28 | GSM4909318 | Human | Breast | IDC | 1.43e-15 | 6.72e-01 | 0.2031 |
| 51160 | VPS28 | GSM4909319 | Human | Breast | IDC | 2.66e-75 | 4.37e-01 | 0.1563 |
| Page: 1 2 3 4 5 6 7 8 9 10 11 12 13 14 |
| Tissue | Expression Dynamics | Abbreviation |
| Breast |  | IDC: Invasive ductal carcinoma |
| DCIS: Ductal carcinoma in situ | ||
| Precancer(BRCA1-mut): Precancerous lesion from BRCA1 mutation carriers | ||
| Cervix | 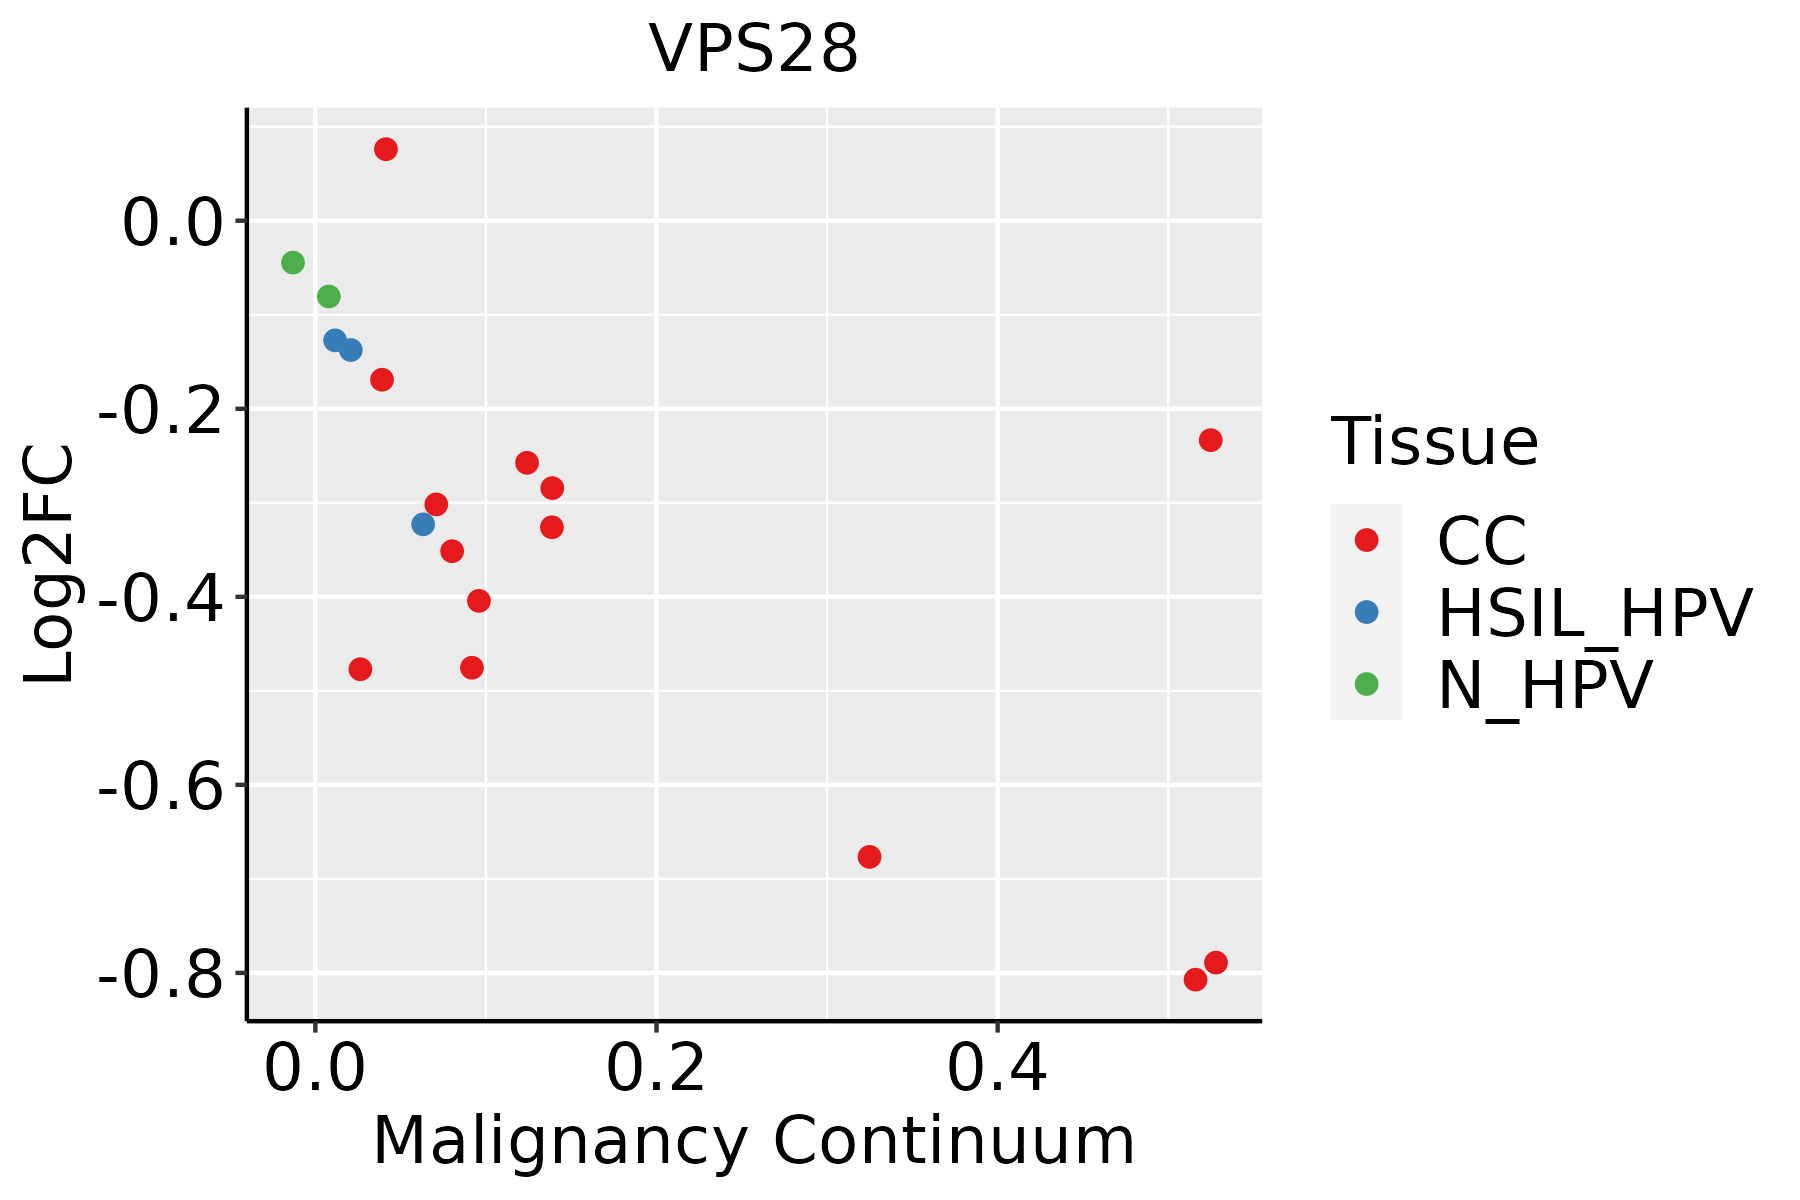 | CC: Cervix cancer |
| HSIL_HPV: HPV-infected high-grade squamous intraepithelial lesions | ||
| N_HPV: HPV-infected normal cervix | ||
| Colorectum (GSE201348) |  | FAP: Familial adenomatous polyposis |
| CRC: Colorectal cancer | ||
| Colorectum (HTA11) |  | AD: Adenomas |
| SER: Sessile serrated lesions | ||
| MSI-H: Microsatellite-high colorectal cancer | ||
| MSS: Microsatellite stable colorectal cancer | ||
| Endometrium |  | AEH: Atypical endometrial hyperplasia |
| EEC: Endometrioid Cancer | ||
| Esophagus | 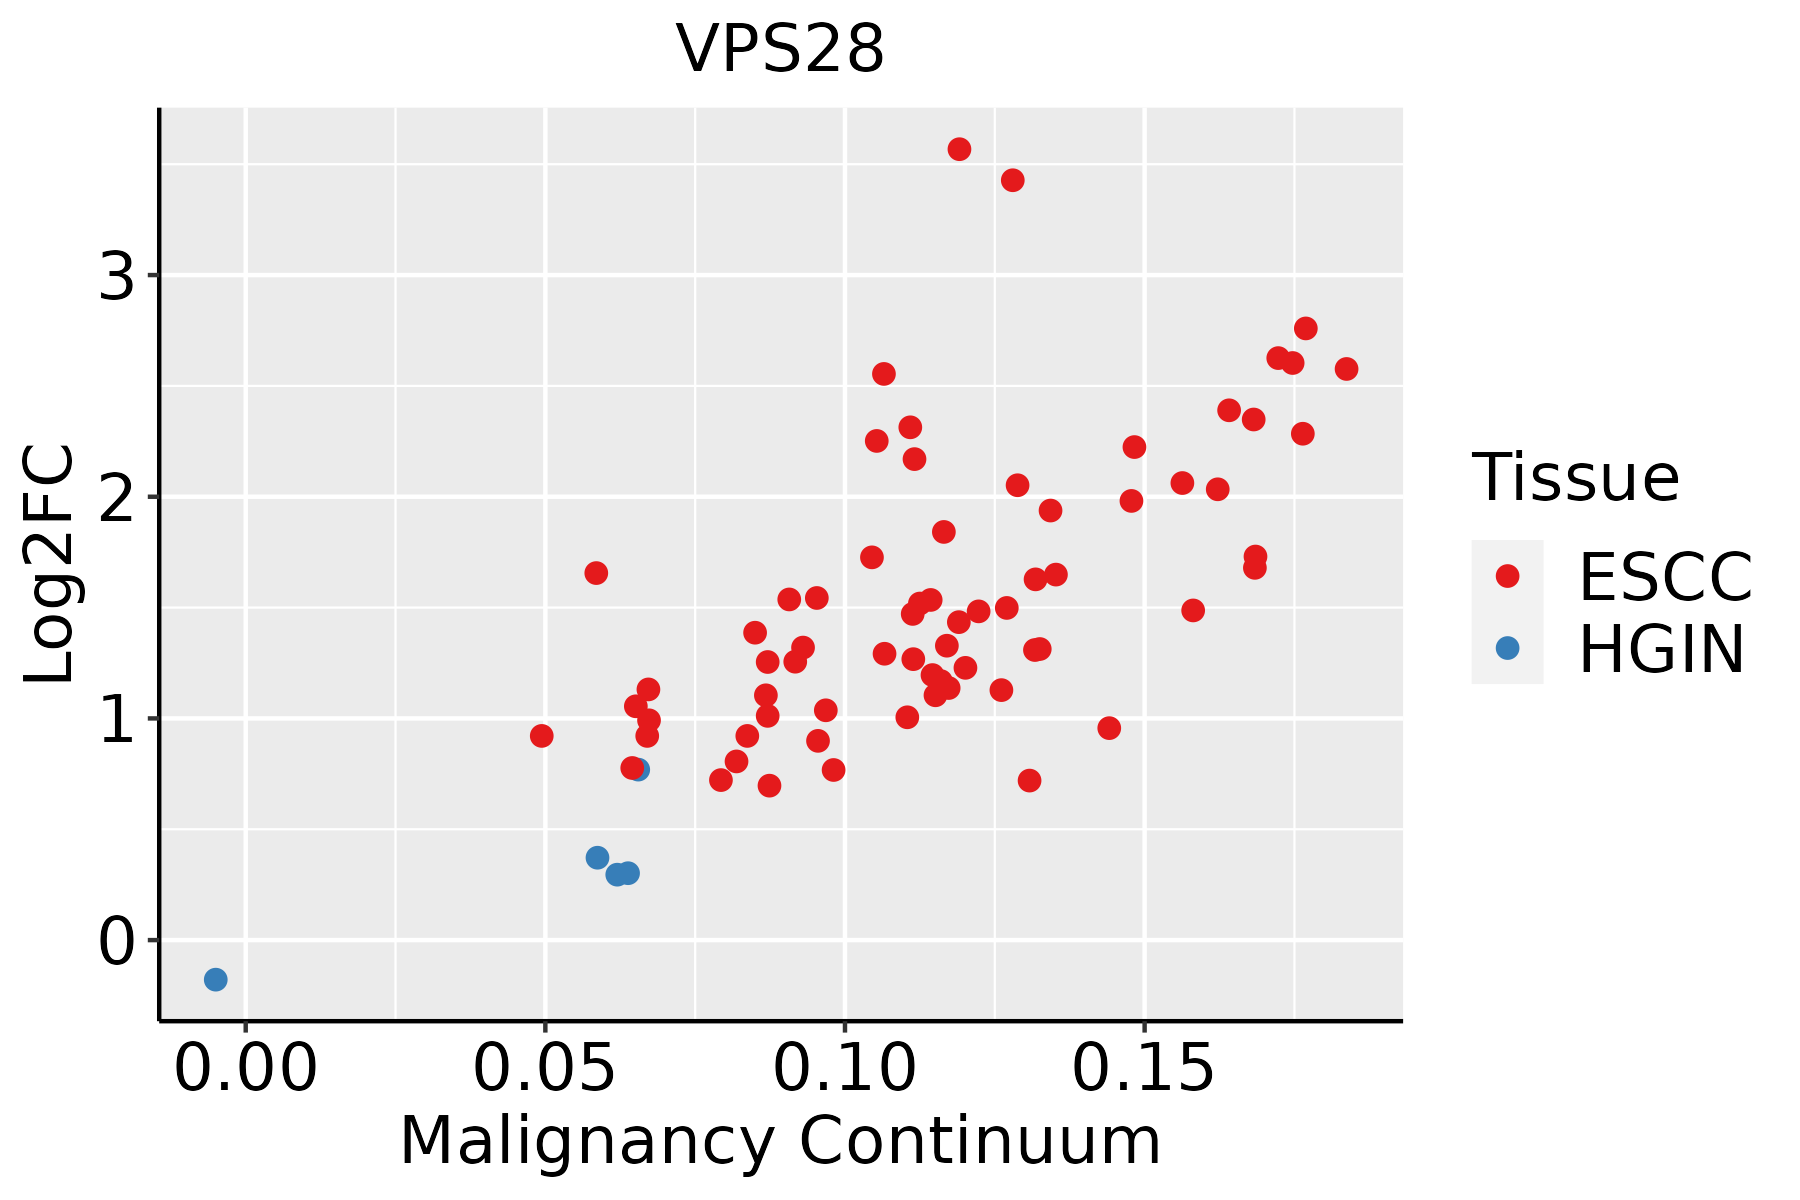 | ESCC: Esophageal squamous cell carcinoma |
| HGIN: High-grade intraepithelial neoplasias | ||
| LGIN: Low-grade intraepithelial neoplasias | ||
| GC | 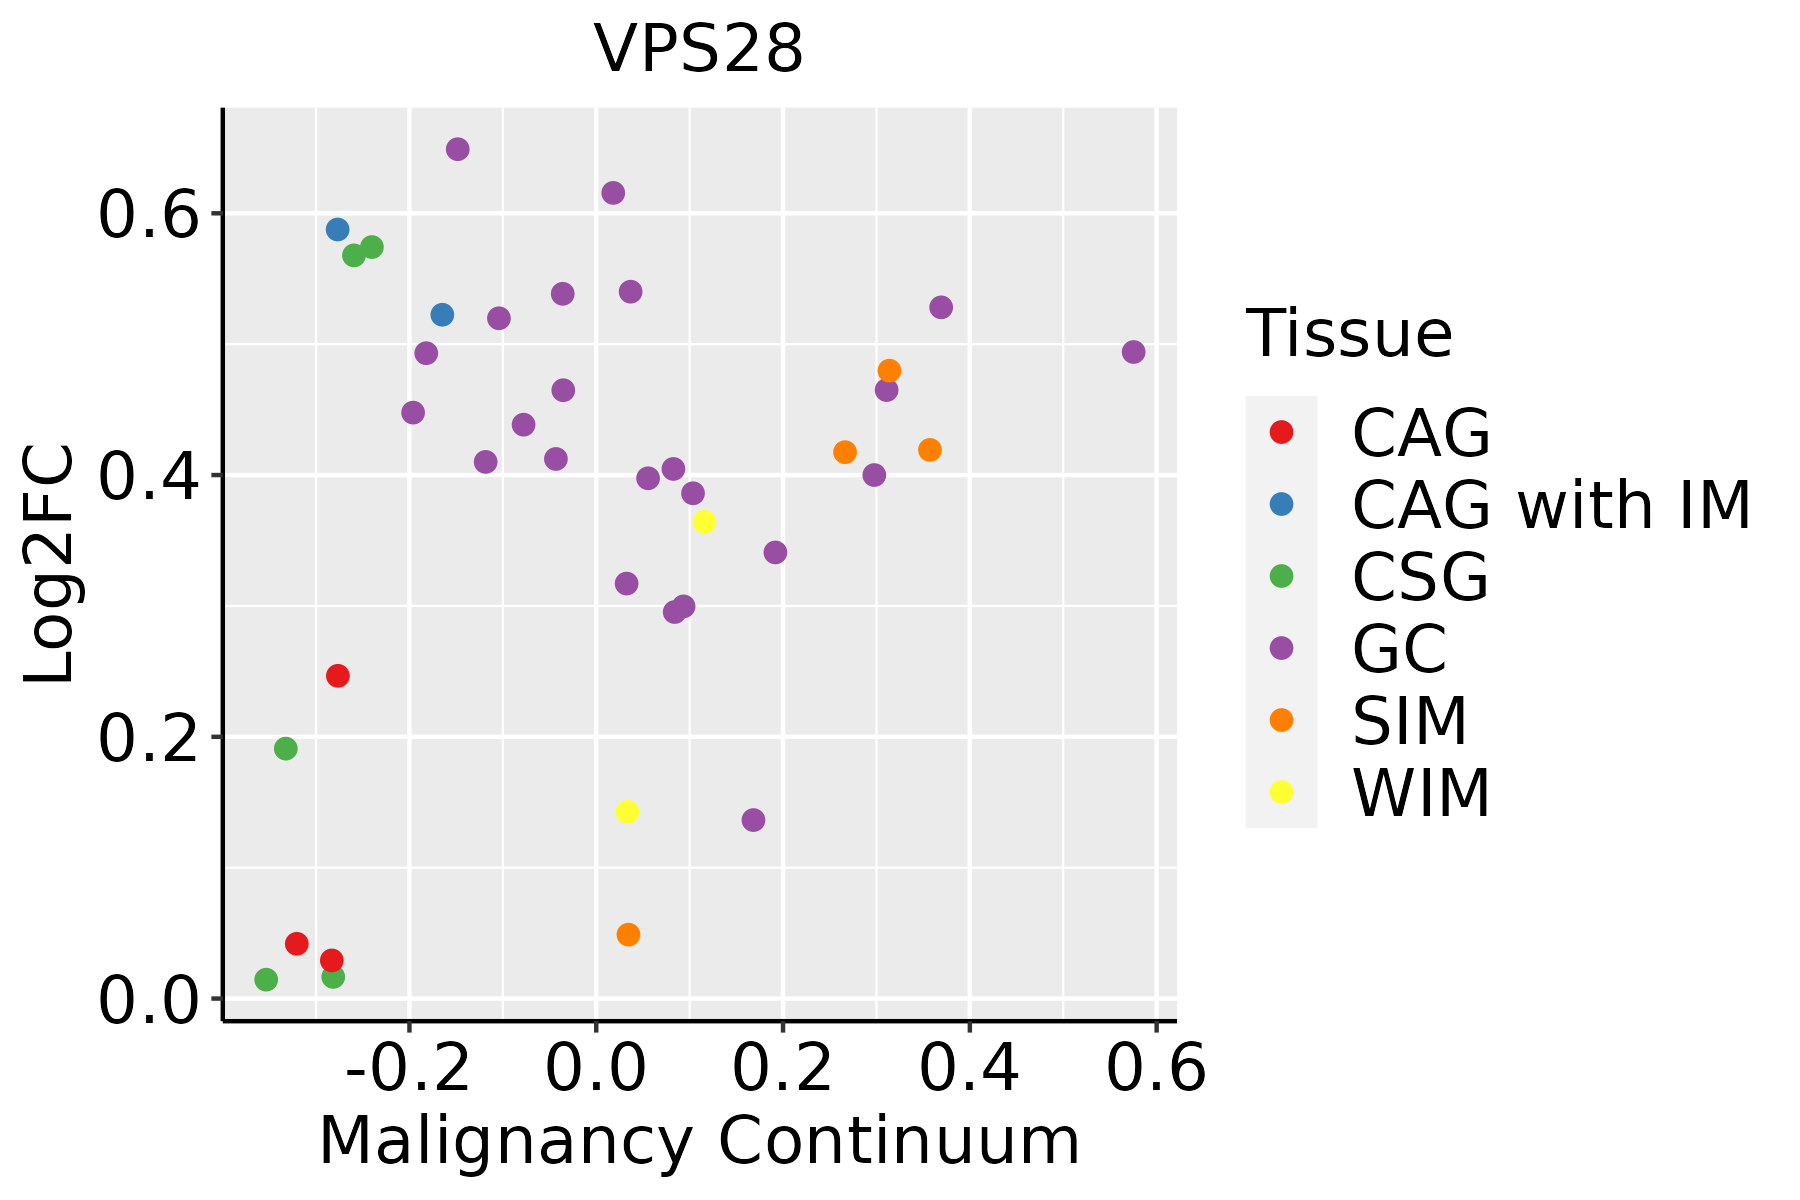 | CAG: Chronic atrophic gastritis |
| CAG with IM: Chronic atrophic gastritis with intestinal metaplasia | ||
| CSG: Chronic superficial gastritis | ||
| GC: Gastric cancer | ||
| SIM: Severe intestinal metaplasia | ||
| WIM: Wild intestinal metaplasia | ||
| Liver |  | HCC: Hepatocellular carcinoma |
| NAFLD: Non-alcoholic fatty liver disease | ||
| Oral Cavity | 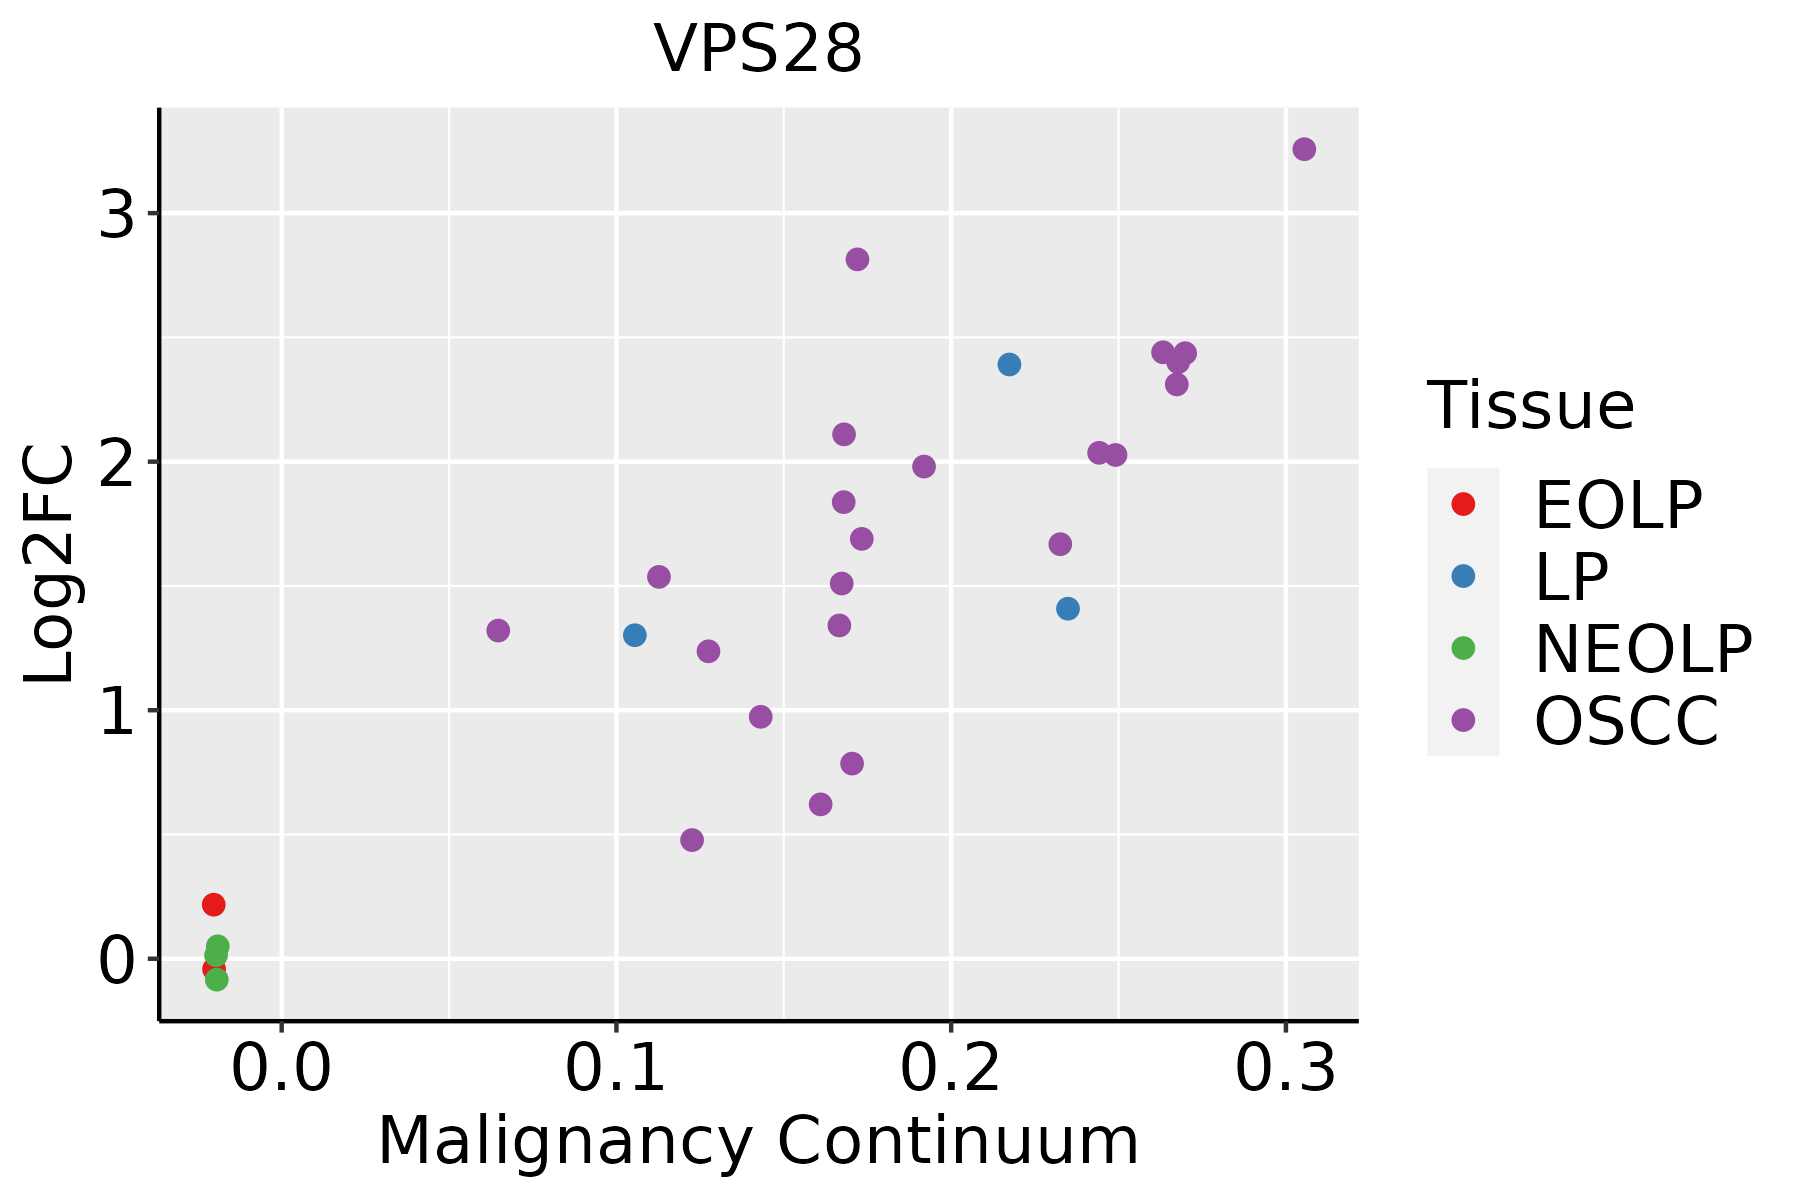 | EOLP: Erosive Oral lichen planus |
| LP: leukoplakia | ||
| NEOLP: Non-erosive oral lichen planus | ||
| OSCC: Oral squamous cell carcinoma | ||
| Prostate |  | BPH: Benign Prostatic Hyperplasia |
| Skin | 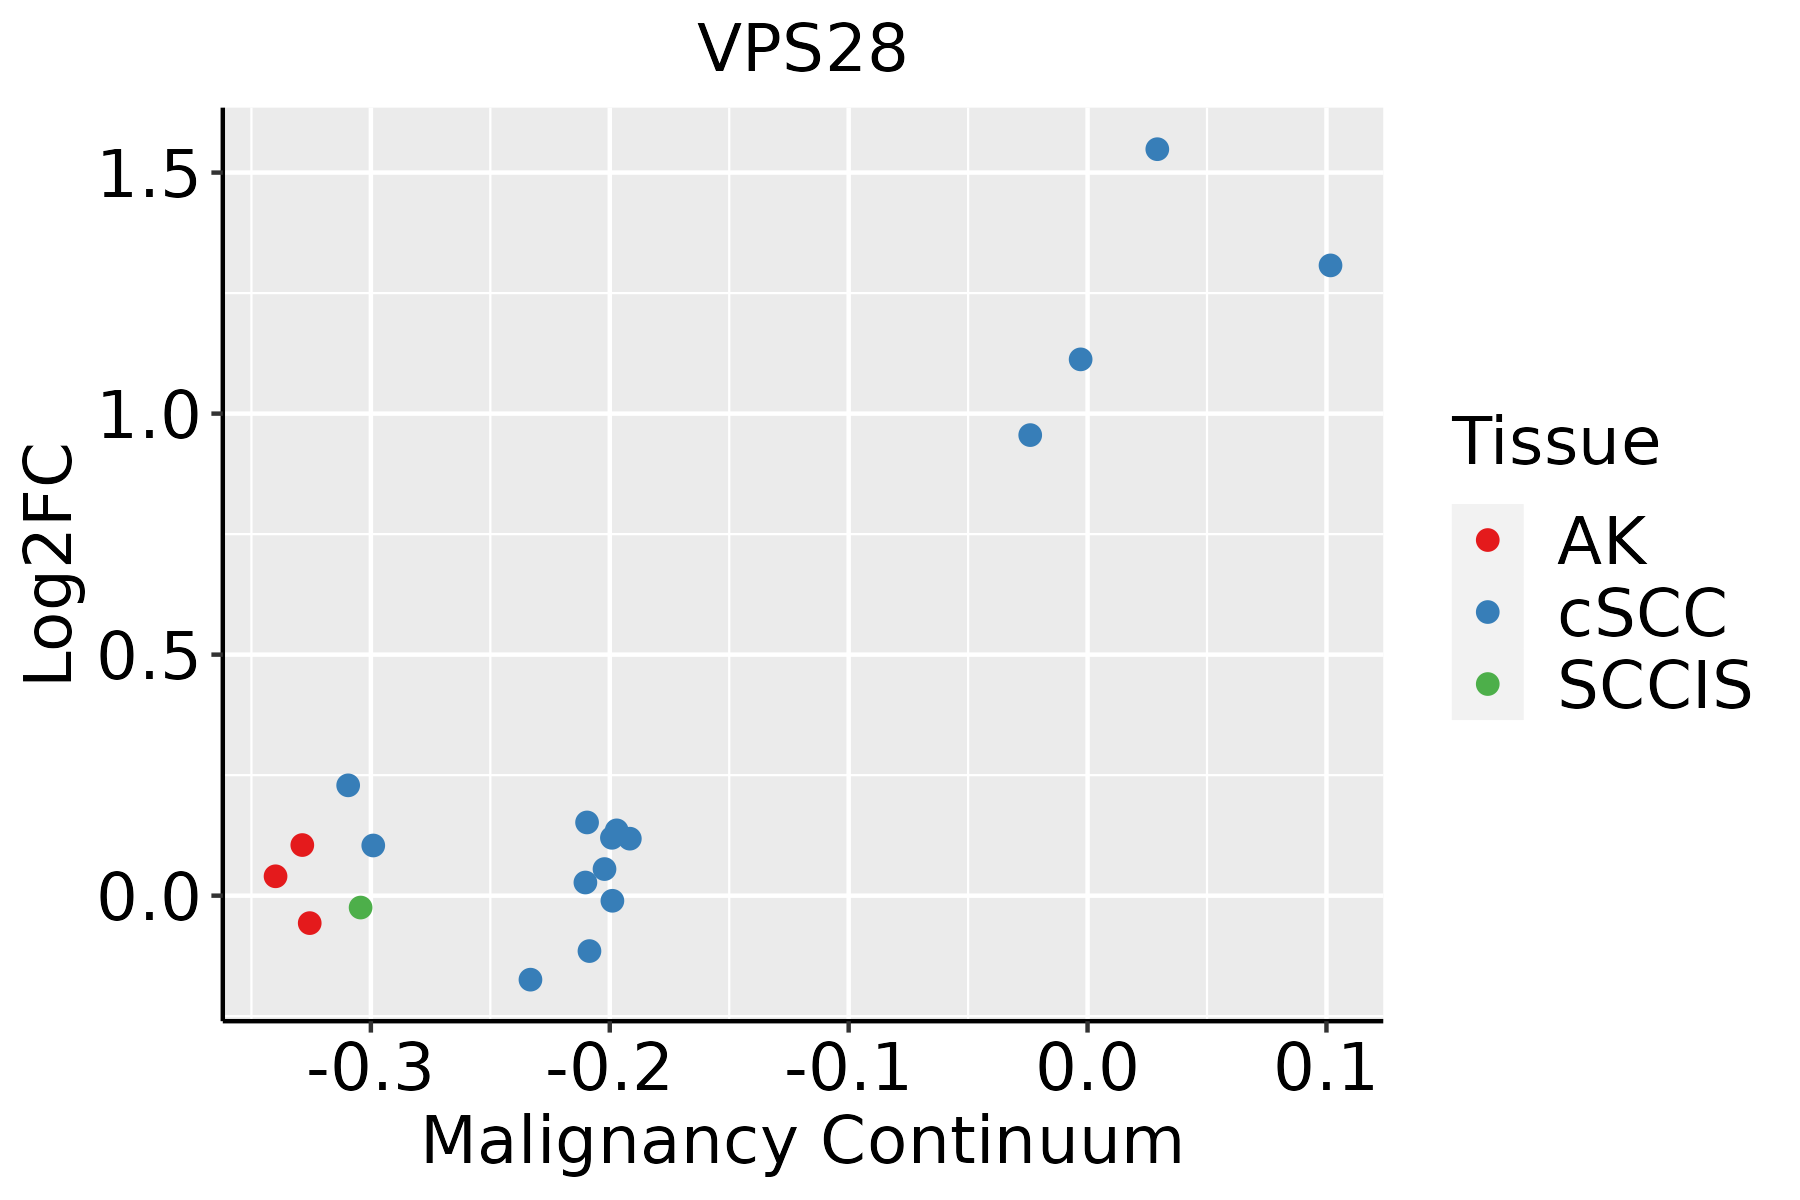 | AK: Actinic keratosis |
| cSCC: Cutaneous squamous cell carcinoma | ||
| SCCIS:squamous cell carcinoma in situ | ||
| Thyroid | 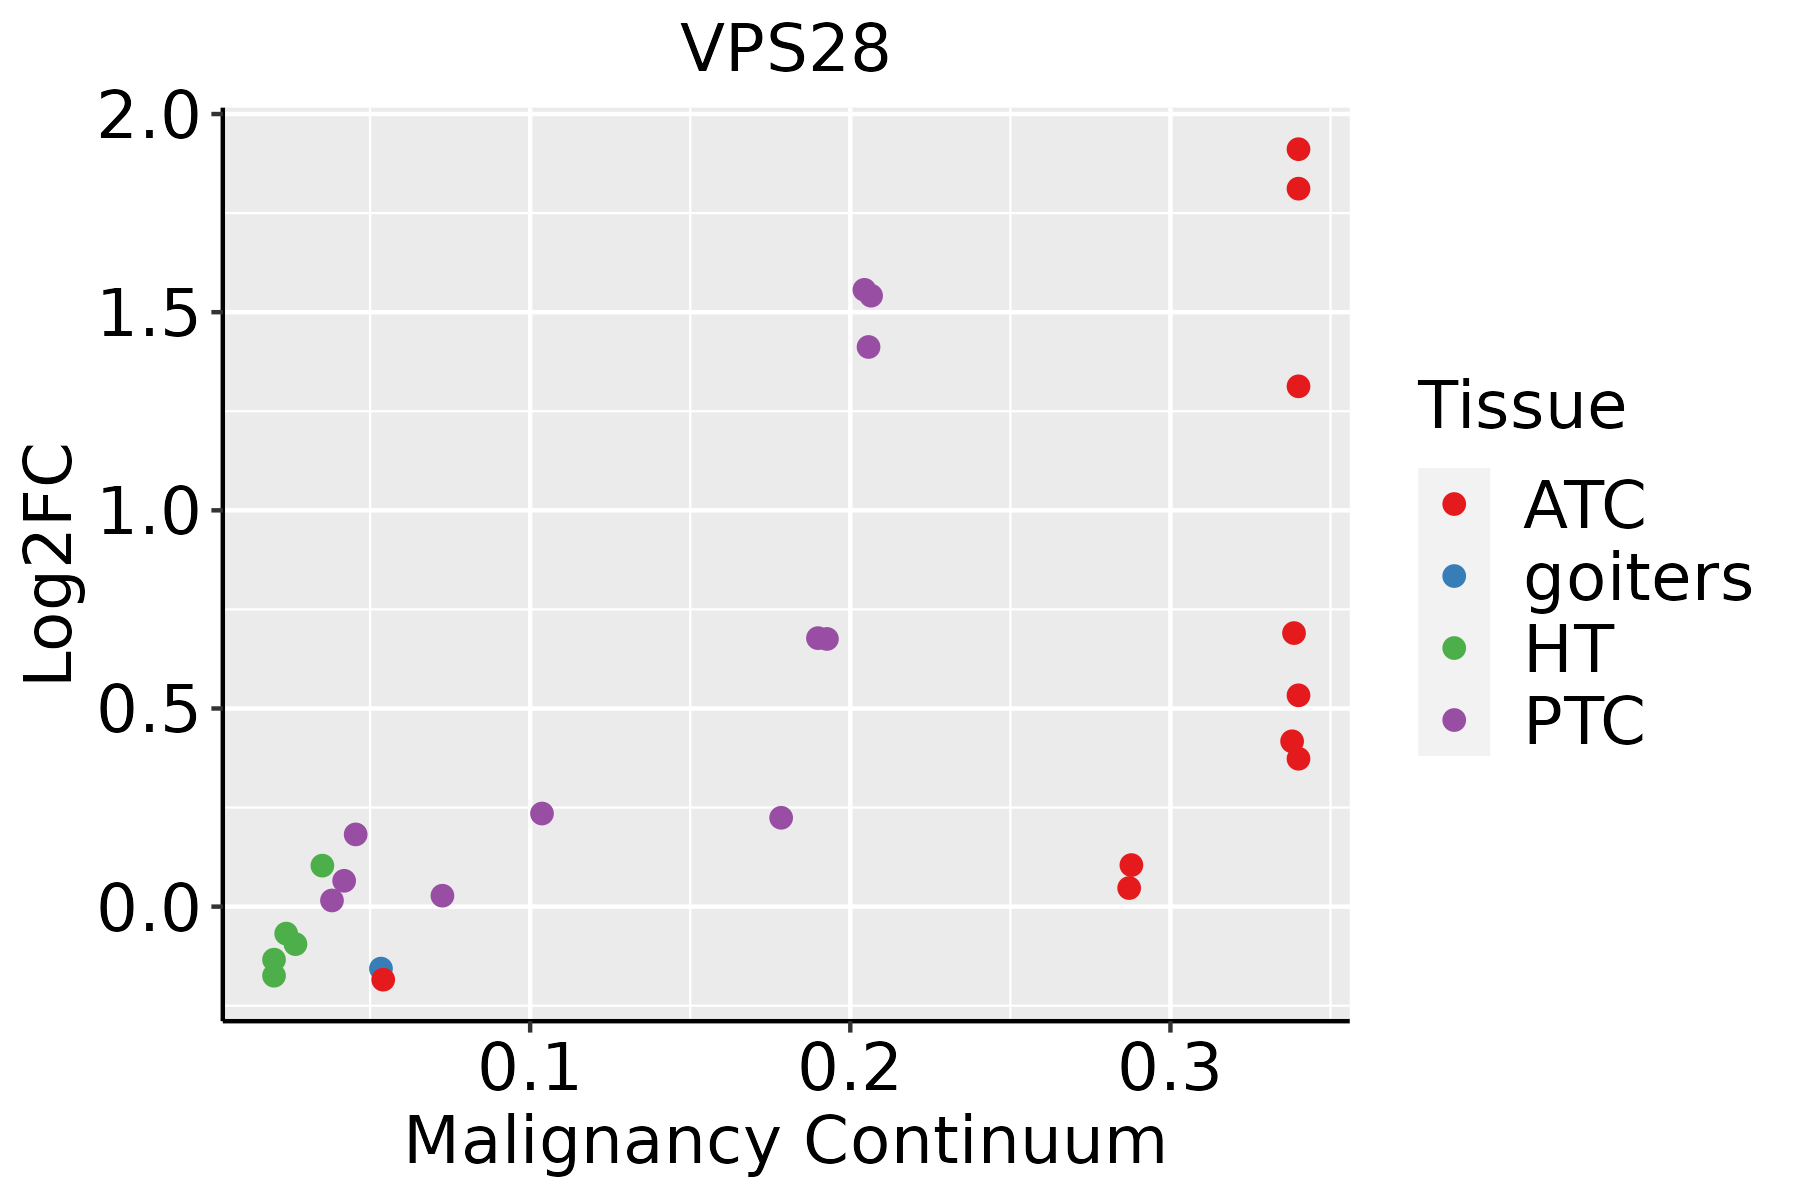 | ATC: Anaplastic thyroid cancer |
| HT: Hashimoto's thyroiditis | ||
| PTC: Papillary thyroid cancer |
| ∗log2FC in expression of this searched gene in stem-like cells from each diseased tissue sample relative to stem-like cells in normal samples in each tissue plotted against the malignancy continuum. Samples are colored based on if they are from different disease stage. |
Top |
Malignant transformation related pathway analysis |
| Find out the enriched GO biological processes and KEGG pathways involved in transition from healthy to precancer to cancer |
| Tissue | Disease Stage | Enriched GO biological Processes |
| Colorectum | AD |  |
| Colorectum | SER |  |
| Colorectum | MSS |  |
| Colorectum | MSI-H |  |
| Colorectum | FAP |  |
| ∗Top 15 enriched GO BP terms are showed in the bar plot of each disease state in each tissue. Each row represents a significant GO biological process which is colored according to the -log10(p.adjust). |
| Page: 1 2 3 4 5 6 7 8 9 |
| GO ID | Tissue | Disease Stage | Description | Gene Ratio | Bg Ratio | pvalue | p.adjust | Count |
| GO:00160329 | Breast | Precancer | viral process | 58/1080 | 415/18723 | 3.42e-10 | 3.16e-08 | 58 |
| GO:00190589 | Breast | Precancer | viral life cycle | 47/1080 | 317/18723 | 2.42e-09 | 1.99e-07 | 47 |
| GO:19033209 | Breast | Precancer | regulation of protein modification by small protein conjugation or removal | 38/1080 | 242/18723 | 1.71e-08 | 1.17e-06 | 38 |
| GO:19033219 | Breast | Precancer | negative regulation of protein modification by small protein conjugation or removal | 21/1080 | 95/18723 | 8.09e-08 | 4.61e-06 | 21 |
| GO:00313969 | Breast | Precancer | regulation of protein ubiquitination | 33/1080 | 210/18723 | 1.45e-07 | 7.82e-06 | 33 |
| GO:00313979 | Breast | Precancer | negative regulation of protein ubiquitination | 19/1080 | 83/18723 | 1.85e-07 | 9.54e-06 | 19 |
| GO:00421769 | Breast | Precancer | regulation of protein catabolic process | 47/1080 | 391/18723 | 1.50e-06 | 5.58e-05 | 47 |
| GO:19049519 | Breast | Precancer | positive regulation of establishment of protein localization | 36/1080 | 319/18723 | 9.30e-05 | 1.75e-03 | 36 |
| GO:00098969 | Breast | Precancer | positive regulation of catabolic process | 48/1080 | 492/18723 | 2.62e-04 | 3.84e-03 | 48 |
| GO:19038299 | Breast | Precancer | positive regulation of cellular protein localization | 30/1080 | 276/18723 | 6.48e-04 | 7.99e-03 | 30 |
| GO:00725948 | Breast | Precancer | establishment of protein localization to organelle | 41/1080 | 422/18723 | 7.75e-04 | 9.20e-03 | 41 |
| GO:00512229 | Breast | Precancer | positive regulation of protein transport | 31/1080 | 303/18723 | 1.44e-03 | 1.50e-02 | 31 |
| GO:00458076 | Breast | Precancer | positive regulation of endocytosis | 14/1080 | 100/18723 | 1.77e-03 | 1.74e-02 | 14 |
| GO:00457329 | Breast | Precancer | positive regulation of protein catabolic process | 25/1080 | 231/18723 | 1.87e-03 | 1.82e-02 | 25 |
| GO:001603214 | Breast | IDC | viral process | 75/1434 | 415/18723 | 1.98e-12 | 4.02e-10 | 75 |
| GO:001905814 | Breast | IDC | viral life cycle | 61/1434 | 317/18723 | 1.61e-11 | 2.77e-09 | 61 |
| GO:004217614 | Breast | IDC | regulation of protein catabolic process | 63/1434 | 391/18723 | 1.32e-08 | 9.61e-07 | 63 |
| GO:190332014 | Breast | IDC | regulation of protein modification by small protein conjugation or removal | 43/1434 | 242/18723 | 1.71e-07 | 9.16e-06 | 43 |
| GO:003139614 | Breast | IDC | regulation of protein ubiquitination | 37/1434 | 210/18723 | 1.50e-06 | 6.36e-05 | 37 |
| GO:190332114 | Breast | IDC | negative regulation of protein modification by small protein conjugation or removal | 22/1434 | 95/18723 | 2.16e-06 | 8.69e-05 | 22 |
| Page: 1 2 3 4 5 6 7 8 9 10 11 12 13 14 15 16 17 18 19 20 21 22 23 24 25 26 27 28 29 30 31 32 33 34 35 |
| Pathway ID | Tissue | Disease Stage | Description | Gene Ratio | Bg Ratio | pvalue | p.adjust | qvalue | Count |
| hsa0414416 | Breast | DCIS | Endocytosis | 37/846 | 251/8465 | 9.92e-03 | 4.40e-02 | 3.24e-02 | 37 |
| hsa0414417 | Breast | DCIS | Endocytosis | 37/846 | 251/8465 | 9.92e-03 | 4.40e-02 | 3.24e-02 | 37 |
| hsa0414418 | Cervix | CC | Endocytosis | 64/1267 | 251/8465 | 6.97e-06 | 6.10e-05 | 3.61e-05 | 64 |
| hsa0414419 | Cervix | CC | Endocytosis | 64/1267 | 251/8465 | 6.97e-06 | 6.10e-05 | 3.61e-05 | 64 |
| hsa04144 | Colorectum | AD | Endocytosis | 111/2092 | 251/8465 | 5.95e-12 | 1.42e-10 | 9.08e-11 | 111 |
| hsa041441 | Colorectum | AD | Endocytosis | 111/2092 | 251/8465 | 5.95e-12 | 1.42e-10 | 9.08e-11 | 111 |
| hsa041442 | Colorectum | SER | Endocytosis | 81/1580 | 251/8465 | 1.14e-07 | 2.36e-06 | 1.71e-06 | 81 |
| hsa041443 | Colorectum | SER | Endocytosis | 81/1580 | 251/8465 | 1.14e-07 | 2.36e-06 | 1.71e-06 | 81 |
| hsa041444 | Colorectum | MSS | Endocytosis | 102/1875 | 251/8465 | 1.85e-11 | 4.43e-10 | 2.71e-10 | 102 |
| hsa041445 | Colorectum | MSS | Endocytosis | 102/1875 | 251/8465 | 1.85e-11 | 4.43e-10 | 2.71e-10 | 102 |
| hsa041448 | Colorectum | CRC | Endocytosis | 65/1091 | 251/8465 | 1.27e-08 | 1.06e-06 | 7.19e-07 | 65 |
| hsa041449 | Colorectum | CRC | Endocytosis | 65/1091 | 251/8465 | 1.27e-08 | 1.06e-06 | 7.19e-07 | 65 |
| hsa0414420 | Endometrium | AEH | Endocytosis | 56/1197 | 251/8465 | 2.58e-04 | 2.15e-03 | 1.57e-03 | 56 |
| hsa04144110 | Endometrium | AEH | Endocytosis | 56/1197 | 251/8465 | 2.58e-04 | 2.15e-03 | 1.57e-03 | 56 |
| hsa0414424 | Endometrium | EEC | Endocytosis | 57/1237 | 251/8465 | 3.34e-04 | 2.82e-03 | 2.10e-03 | 57 |
| hsa0414434 | Endometrium | EEC | Endocytosis | 57/1237 | 251/8465 | 3.34e-04 | 2.82e-03 | 2.10e-03 | 57 |
| hsa0414429 | Esophagus | HGIN | Endocytosis | 76/1383 | 251/8465 | 1.74e-08 | 3.34e-07 | 2.65e-07 | 76 |
| hsa04144113 | Esophagus | HGIN | Endocytosis | 76/1383 | 251/8465 | 1.74e-08 | 3.34e-07 | 2.65e-07 | 76 |
| hsa04144210 | Esophagus | ESCC | Endocytosis | 186/4205 | 251/8465 | 9.74e-16 | 4.66e-14 | 2.39e-14 | 186 |
| hsa0414437 | Esophagus | ESCC | Endocytosis | 186/4205 | 251/8465 | 9.74e-16 | 4.66e-14 | 2.39e-14 | 186 |
| Page: 1 2 |
Top |
Cell-cell communication analysis |
| Identification of potential cell-cell interactions between two cell types and their ligand-receptor pairs for different disease states |
| Ligand | Receptor | LRpair | Pathway | Tissue | Disease Stage |
| Page: 1 |
Top |
Single-cell gene regulatory network inference analysis |
| Find out the significant the regulons (TFs) and the target genes of each regulon across cell types for different disease states |
| TF | Cell Type | Tissue | Disease Stage | Target Gene | RSS | Regulon Activity |
| ∗The dot plots of a searched regulon are shown for all cell subpopulations in each disease state of each tissue based on the regulon specific score inferred using pySCENIC and by calculating the average expression. |
| Page: 1 |
Top |
Somatic mutation of malignant transformation related genes |
| Annotation of somatic variants for genes involved in malignant transformation |
| Hugo Symbol | Variant Class | Variant Classification | dbSNP RS | HGVSc | HGVSp | HGVSp Short | SWISSPROT | BIOTYPE | SIFT | PolyPhen | Tumor Sample Barcode | Tissue | Histology | Sex | Age | Stage | Therapy Types | Drugs | Outcome |
| VPS28 | SNV | Missense_Mutation | rs782172751 | c.497N>A | p.Arg166His | p.R166H | Q9UK41 | protein_coding | deleterious(0) | possibly_damaging(0.76) | TCGA-E2-A154-01 | Breast | breast invasive carcinoma | Female | >=65 | I/II | Hormone Therapy | arimidex | SD |
| VPS28 | SNV | Missense_Mutation | rs781857387 | c.43G>A | p.Gly15Arg | p.G15R | Q9UK41 | protein_coding | tolerated(0.06) | possibly_damaging(0.595) | TCGA-AD-6895-01 | Colorectum | colon adenocarcinoma | Male | >=65 | III/IV | Unknown | Unknown | SD |
| VPS28 | SNV | Missense_Mutation | rs781982468 | c.290N>A | p.Arg97His | p.R97H | Q9UK41 | protein_coding | deleterious(0.02) | benign(0.03) | TCGA-CK-4951-01 | Colorectum | colon adenocarcinoma | Female | >=65 | I/II | Unknown | Unknown | PD |
| VPS28 | SNV | Missense_Mutation | rs782001806 | c.326N>A | p.Arg109Gln | p.R109Q | Q9UK41 | protein_coding | deleterious(0) | probably_damaging(1) | TCGA-CK-5913-01 | Colorectum | colon adenocarcinoma | Female | <65 | I/II | Unknown | Unknown | SD |
| VPS28 | SNV | Missense_Mutation | rs782640000 | c.608G>A | p.Arg203Gln | p.R203Q | Q9UK41 | protein_coding | tolerated_low_confidence(1) | benign(0) | TCGA-AG-4021-01 | Colorectum | rectum adenocarcinoma | Female | >=65 | III/IV | Unknown | Unknown | PD |
| VPS28 | SNV | Missense_Mutation | rs782803588 | c.289C>T | p.Arg97Cys | p.R97C | Q9UK41 | protein_coding | deleterious(0) | possibly_damaging(0.886) | TCGA-A5-A0VP-01 | Endometrium | uterine corpus endometrioid carcinoma | Female | >=65 | I/II | Unknown | Unknown | SD |
| VPS28 | SNV | Missense_Mutation | rs369965146 | c.682C>T | p.Arg228Trp | p.R228W | Q9UK41 | protein_coding | deleterious_low_confidence(0) | benign(0) | TCGA-A5-A1OF-01 | Endometrium | uterine corpus endometrioid carcinoma | Female | <65 | I/II | Unknown | Unknown | SD |
| VPS28 | SNV | Missense_Mutation | novel | c.632C>T | p.Pro211Leu | p.P211L | Q9UK41 | protein_coding | deleterious_low_confidence(0.02) | benign(0) | TCGA-AX-A2HD-01 | Endometrium | uterine corpus endometrioid carcinoma | Female | >=65 | III/IV | Unknown | Unknown | SD |
| VPS28 | SNV | Missense_Mutation | rs149592460 | c.311N>T | p.Pro104Leu | p.P104L | Q9UK41 | protein_coding | deleterious(0.02) | probably_damaging(0.994) | TCGA-B5-A11E-01 | Endometrium | uterine corpus endometrioid carcinoma | Female | <65 | I/II | Unknown | Unknown | SD |
| VPS28 | SNV | Missense_Mutation | novel | c.431G>A | p.Arg144His | p.R144H | Q9UK41 | protein_coding | deleterious(0.03) | benign(0.273) | TCGA-B5-A3FC-01 | Endometrium | uterine corpus endometrioid carcinoma | Female | <65 | I/II | Unknown | Unknown | SD |
| Page: 1 2 3 |
Top |
Related drugs of malignant transformation related genes |
| Identification of chemicals and drugs interact with genes involved in malignant transfromation |
| (DGIdb 4.0) |
| Entrez ID | Symbol | Category | Interaction Types | Drug Claim Name | Drug Name | PMIDs |
| Page: 1 |

Copyright 2023-Present -The University of Texas Health Science Center at Houston |