
|
|||||
|
 | |
| |
| |
| |
| |
| |
|
Gene: VPS26B |
Gene summary for VPS26B |
| Gene information | Species | Human | Gene symbol | VPS26B | Gene ID | 112936 |
| Gene name | VPS26, retromer complex component B | |
| Gene Alias | Pep8b | |
| Cytomap | 11q25 | |
| Gene Type | protein-coding | GO ID | GO:0002376 | UniProtAcc | A0A024R3L9 |
Top |
Malignant transformation analysis |
| Identification of the aberrant gene expression in precancerous and cancerous lesions by comparing the gene expression of stem-like cells in diseased tissues with normal stem cells |
| Entrez ID | Symbol | Replicates | Species | Organ | Tissue | Adj P-value | Log2FC | Malignancy |
| 112936 | VPS26B | LZE24T | Human | Esophagus | ESCC | 1.58e-15 | 4.06e-01 | 0.0596 |
| 112936 | VPS26B | P1T-E | Human | Esophagus | ESCC | 2.51e-04 | 1.81e-01 | 0.0875 |
| 112936 | VPS26B | P2T-E | Human | Esophagus | ESCC | 5.04e-19 | 2.45e-01 | 0.1177 |
| 112936 | VPS26B | P4T-E | Human | Esophagus | ESCC | 5.18e-28 | 6.85e-01 | 0.1323 |
| 112936 | VPS26B | P5T-E | Human | Esophagus | ESCC | 1.88e-12 | 1.15e-01 | 0.1327 |
| 112936 | VPS26B | P8T-E | Human | Esophagus | ESCC | 3.73e-16 | 2.48e-01 | 0.0889 |
| 112936 | VPS26B | P9T-E | Human | Esophagus | ESCC | 5.95e-15 | 2.95e-01 | 0.1131 |
| 112936 | VPS26B | P10T-E | Human | Esophagus | ESCC | 3.39e-28 | 4.78e-01 | 0.116 |
| 112936 | VPS26B | P11T-E | Human | Esophagus | ESCC | 1.00e-10 | 4.24e-01 | 0.1426 |
| 112936 | VPS26B | P12T-E | Human | Esophagus | ESCC | 9.52e-19 | 3.20e-01 | 0.1122 |
| 112936 | VPS26B | P15T-E | Human | Esophagus | ESCC | 1.07e-10 | 2.32e-01 | 0.1149 |
| 112936 | VPS26B | P16T-E | Human | Esophagus | ESCC | 2.18e-25 | 5.15e-01 | 0.1153 |
| 112936 | VPS26B | P19T-E | Human | Esophagus | ESCC | 2.84e-05 | 3.56e-01 | 0.1662 |
| 112936 | VPS26B | P20T-E | Human | Esophagus | ESCC | 7.07e-16 | 3.54e-01 | 0.1124 |
| 112936 | VPS26B | P21T-E | Human | Esophagus | ESCC | 7.46e-25 | 5.75e-01 | 0.1617 |
| 112936 | VPS26B | P22T-E | Human | Esophagus | ESCC | 6.80e-24 | 3.63e-01 | 0.1236 |
| 112936 | VPS26B | P23T-E | Human | Esophagus | ESCC | 1.27e-16 | 3.03e-01 | 0.108 |
| 112936 | VPS26B | P24T-E | Human | Esophagus | ESCC | 6.84e-13 | 1.76e-01 | 0.1287 |
| 112936 | VPS26B | P26T-E | Human | Esophagus | ESCC | 2.07e-28 | 4.36e-01 | 0.1276 |
| 112936 | VPS26B | P27T-E | Human | Esophagus | ESCC | 1.68e-22 | 2.58e-01 | 0.1055 |
| Page: 1 2 3 4 |
| Tissue | Expression Dynamics | Abbreviation |
| Esophagus | 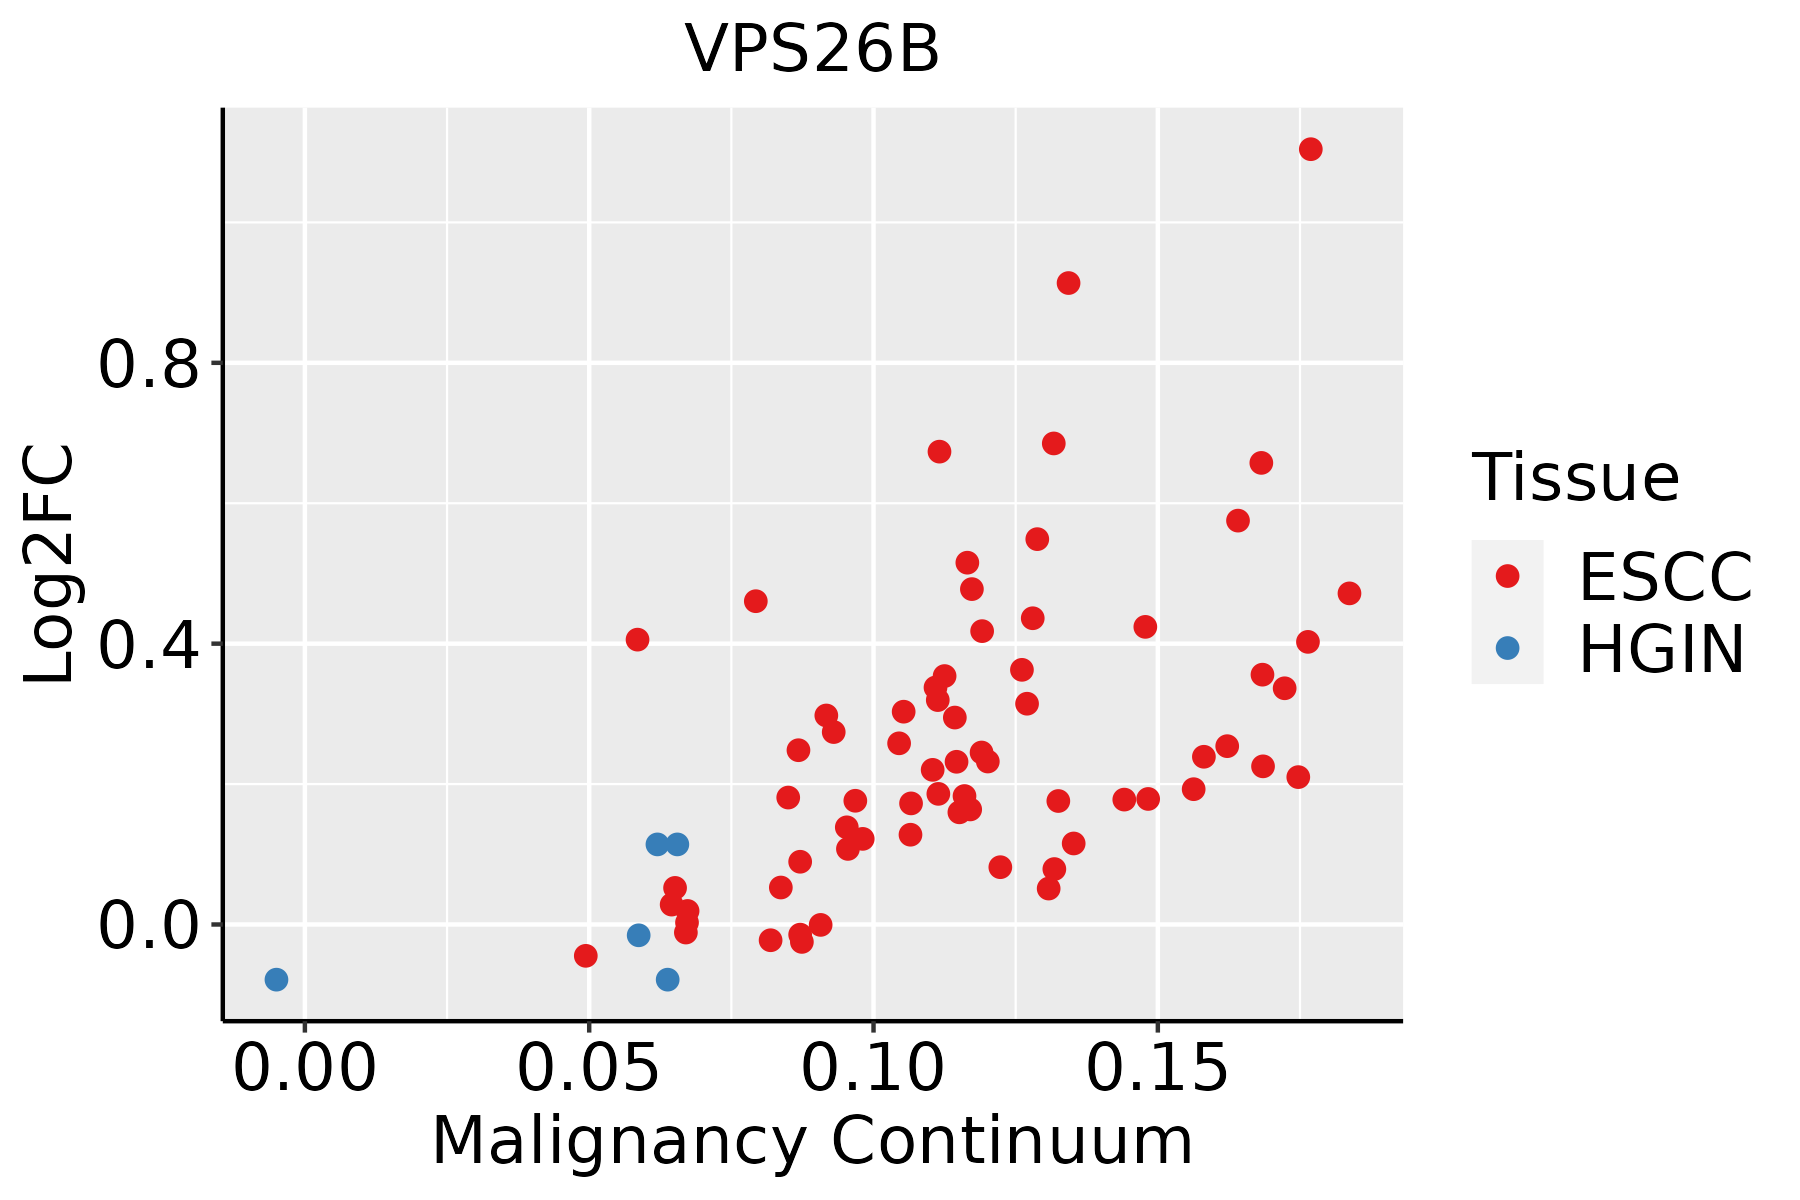 | ESCC: Esophageal squamous cell carcinoma |
| HGIN: High-grade intraepithelial neoplasias | ||
| LGIN: Low-grade intraepithelial neoplasias | ||
| Liver | 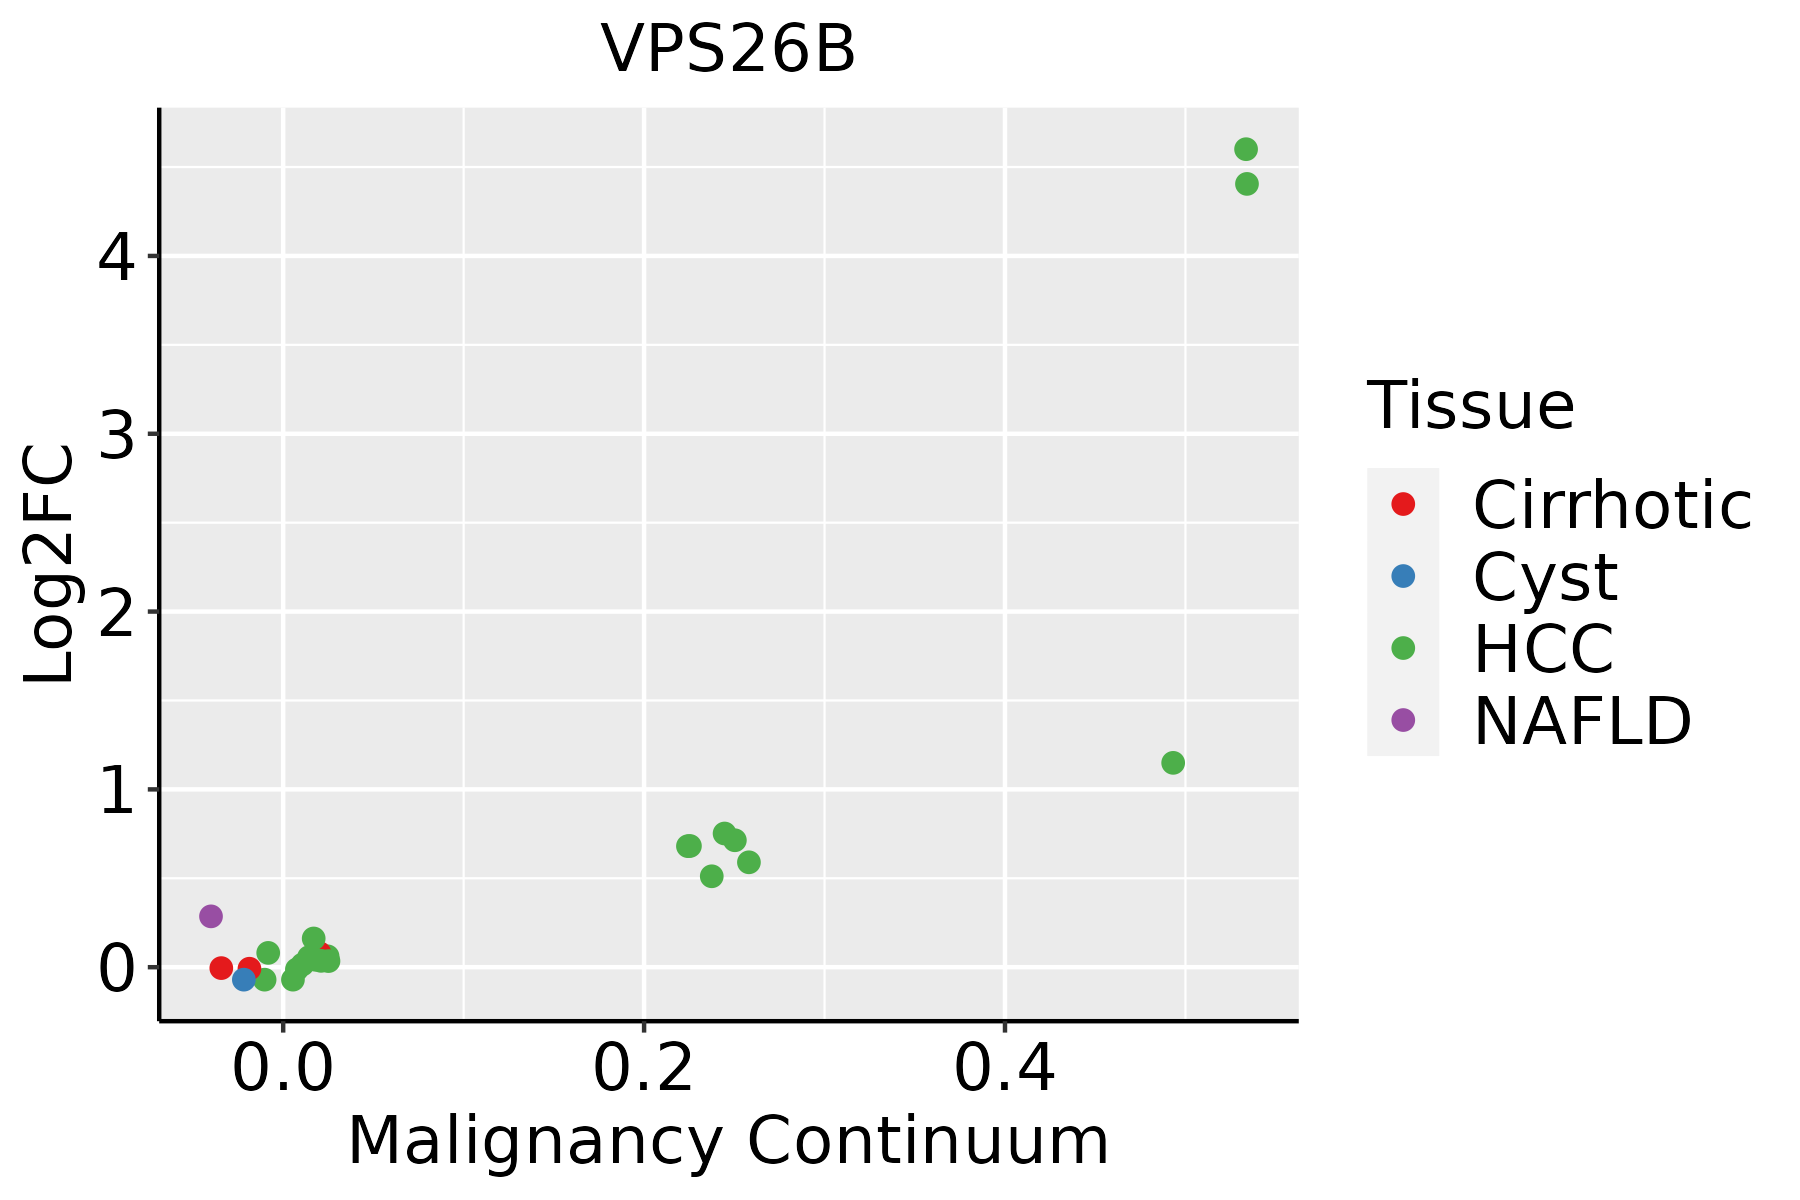 | HCC: Hepatocellular carcinoma |
| NAFLD: Non-alcoholic fatty liver disease | ||
| Oral Cavity |  | EOLP: Erosive Oral lichen planus |
| LP: leukoplakia | ||
| NEOLP: Non-erosive oral lichen planus | ||
| OSCC: Oral squamous cell carcinoma | ||
| Prostate |  | BPH: Benign Prostatic Hyperplasia |
| ∗log2FC in expression of this searched gene in stem-like cells from each diseased tissue sample relative to stem-like cells in normal samples in each tissue plotted against the malignancy continuum. Samples are colored based on if they are from different disease stage. |
Top |
Malignant transformation related pathway analysis |
| Find out the enriched GO biological processes and KEGG pathways involved in transition from healthy to precancer to cancer |
| Tissue | Disease Stage | Enriched GO biological Processes |
| Colorectum | AD |  |
| Colorectum | SER |  |
| Colorectum | MSS |  |
| Colorectum | MSI-H |  |
| Colorectum | FAP |  |
| ∗Top 15 enriched GO BP terms are showed in the bar plot of each disease state in each tissue. Each row represents a significant GO biological process which is colored according to the -log10(p.adjust). |
| Page: 1 2 3 4 5 6 7 8 9 |
| GO ID | Tissue | Disease Stage | Description | Gene Ratio | Bg Ratio | pvalue | p.adjust | Count |
| GO:001623617 | Esophagus | ESCC | macroautophagy | 216/8552 | 291/18723 | 1.94e-23 | 4.57e-21 | 216 |
| GO:001050617 | Esophagus | ESCC | regulation of autophagy | 220/8552 | 317/18723 | 6.72e-18 | 6.36e-16 | 220 |
| GO:001619715 | Esophagus | ESCC | endosomal transport | 168/8552 | 230/18723 | 2.28e-17 | 1.93e-15 | 168 |
| GO:001648210 | Esophagus | ESCC | cytosolic transport | 124/8552 | 168/18723 | 9.69e-14 | 4.69e-12 | 124 |
| GO:001624114 | Esophagus | ESCC | regulation of macroautophagy | 102/8552 | 141/18723 | 1.09e-10 | 3.27e-09 | 102 |
| GO:00421477 | Esophagus | ESCC | retrograde transport, endosome to Golgi | 63/8552 | 91/18723 | 4.58e-06 | 4.87e-05 | 63 |
| GO:00343418 | Esophagus | ESCC | response to interferon-gamma | 86/8552 | 141/18723 | 1.74e-04 | 1.14e-03 | 86 |
| GO:00713466 | Esophagus | ESCC | cellular response to interferon-gamma | 69/8552 | 118/18723 | 3.44e-03 | 1.41e-02 | 69 |
| GO:001623621 | Liver | HCC | macroautophagy | 204/7958 | 291/18723 | 8.66e-22 | 1.41e-19 | 204 |
| GO:001050621 | Liver | HCC | regulation of autophagy | 210/7958 | 317/18723 | 7.59e-18 | 8.45e-16 | 210 |
| GO:001619721 | Liver | HCC | endosomal transport | 154/7958 | 230/18723 | 4.74e-14 | 2.95e-12 | 154 |
| GO:001648221 | Liver | HCC | cytosolic transport | 117/7958 | 168/18723 | 8.83e-13 | 4.48e-11 | 117 |
| GO:001624111 | Liver | HCC | regulation of macroautophagy | 96/7958 | 141/18723 | 6.82e-10 | 2.14e-08 | 96 |
| GO:004214721 | Liver | HCC | retrograde transport, endosome to Golgi | 61/7958 | 91/18723 | 1.94e-06 | 2.68e-05 | 61 |
| GO:00343411 | Liver | HCC | response to interferon-gamma | 82/7958 | 141/18723 | 1.25e-04 | 1.03e-03 | 82 |
| GO:00713461 | Liver | HCC | cellular response to interferon-gamma | 70/7958 | 118/18723 | 1.66e-04 | 1.32e-03 | 70 |
| GO:001623610 | Oral cavity | OSCC | macroautophagy | 192/7305 | 291/18723 | 7.01e-21 | 1.14e-18 | 192 |
| GO:001050610 | Oral cavity | OSCC | regulation of autophagy | 198/7305 | 317/18723 | 1.63e-17 | 1.51e-15 | 198 |
| GO:00162417 | Oral cavity | OSCC | regulation of macroautophagy | 96/7305 | 141/18723 | 2.33e-12 | 9.75e-11 | 96 |
| GO:00161979 | Oral cavity | OSCC | endosomal transport | 141/7305 | 230/18723 | 5.40e-12 | 2.06e-10 | 141 |
| Page: 1 2 |
| Pathway ID | Tissue | Disease Stage | Description | Gene Ratio | Bg Ratio | pvalue | p.adjust | qvalue | Count |
| hsa04144210 | Esophagus | ESCC | Endocytosis | 186/4205 | 251/8465 | 9.74e-16 | 4.66e-14 | 2.39e-14 | 186 |
| hsa0414437 | Esophagus | ESCC | Endocytosis | 186/4205 | 251/8465 | 9.74e-16 | 4.66e-14 | 2.39e-14 | 186 |
| hsa0414422 | Liver | HCC | Endocytosis | 178/4020 | 251/8465 | 2.03e-14 | 5.22e-13 | 2.91e-13 | 178 |
| hsa0414432 | Liver | HCC | Endocytosis | 178/4020 | 251/8465 | 2.03e-14 | 5.22e-13 | 2.91e-13 | 178 |
| hsa0414427 | Oral cavity | OSCC | Endocytosis | 174/3704 | 251/8465 | 9.42e-17 | 4.51e-15 | 2.29e-15 | 174 |
| hsa04144112 | Oral cavity | OSCC | Endocytosis | 174/3704 | 251/8465 | 9.42e-17 | 4.51e-15 | 2.29e-15 | 174 |
| hsa0414428 | Oral cavity | LP | Endocytosis | 121/2418 | 251/8465 | 1.89e-11 | 3.70e-10 | 2.38e-10 | 121 |
| hsa0414436 | Oral cavity | LP | Endocytosis | 121/2418 | 251/8465 | 1.89e-11 | 3.70e-10 | 2.38e-10 | 121 |
| hsa0414426 | Prostate | Tumor | Endocytosis | 92/1791 | 251/8465 | 7.83e-09 | 1.04e-07 | 6.43e-08 | 92 |
| hsa0414435 | Prostate | Tumor | Endocytosis | 92/1791 | 251/8465 | 7.83e-09 | 1.04e-07 | 6.43e-08 | 92 |
| Page: 1 |
Top |
Cell-cell communication analysis |
| Identification of potential cell-cell interactions between two cell types and their ligand-receptor pairs for different disease states |
| Ligand | Receptor | LRpair | Pathway | Tissue | Disease Stage |
| Page: 1 |
Top |
Single-cell gene regulatory network inference analysis |
| Find out the significant the regulons (TFs) and the target genes of each regulon across cell types for different disease states |
| TF | Cell Type | Tissue | Disease Stage | Target Gene | RSS | Regulon Activity |
| ∗The dot plots of a searched regulon are shown for all cell subpopulations in each disease state of each tissue based on the regulon specific score inferred using pySCENIC and by calculating the average expression. |
| Page: 1 |
Top |
Somatic mutation of malignant transformation related genes |
| Annotation of somatic variants for genes involved in malignant transformation |
| Hugo Symbol | Variant Class | Variant Classification | dbSNP RS | HGVSc | HGVSp | HGVSp Short | SWISSPROT | BIOTYPE | SIFT | PolyPhen | Tumor Sample Barcode | Tissue | Histology | Sex | Age | Stage | Therapy Types | Drugs | Outcome |
| VPS26B | SNV | Missense_Mutation | rs776450098 | c.895N>A | p.Val299Ile | p.V299I | Q4G0F5 | protein_coding | tolerated(0.26) | benign(0) | TCGA-D8-A1XW-01 | Breast | breast invasive carcinoma | Female | <65 | I/II | Chemotherapy | adriamycin+cyclophosphamide | SD |
| VPS26B | SNV | Missense_Mutation | c.242N>C | p.Gly81Ala | p.G81A | Q4G0F5 | protein_coding | deleterious(0.02) | benign(0.286) | TCGA-GI-A2C8-01 | Breast | breast invasive carcinoma | Female | <65 | III/IV | Unspecific | Adriamycin | SD | |
| VPS26B | SNV | Missense_Mutation | novel | c.991N>C | p.Asp331His | p.D331H | Q4G0F5 | protein_coding | deleterious_low_confidence(0.01) | benign(0.062) | TCGA-LQ-A4E4-01 | Breast | breast invasive carcinoma | Female | >=65 | III/IV | Hormone Therapy | anastrozole | PD |
| VPS26B | insertion | Nonsense_Mutation | novel | c.695_696insTCCCCTGTAAGATGGCGCAGGTGGTCTCCTGCTGCTTTT | p.Glu232delinsAspProLeuTerAspGlyAlaGlyGlyLeuLeuLeuLeuLeu | p.E232delinsDPL*DGAGGLLLLL | Q4G0F5 | protein_coding | TCGA-A2-A0D1-01 | Breast | breast invasive carcinoma | Female | >=65 | I/II | Chemotherapy | taxotere | SD | ||
| VPS26B | SNV | Missense_Mutation | novel | c.920N>T | p.Ala307Val | p.A307V | Q4G0F5 | protein_coding | tolerated(0.19) | benign(0.037) | TCGA-2W-A8YY-01 | Cervix | cervical & endocervical cancer | Female | <65 | I/II | Chemotherapy | cisplatin | CR |
| VPS26B | SNV | Missense_Mutation | novel | c.637N>A | p.Glu213Lys | p.E213K | Q4G0F5 | protein_coding | deleterious(0) | probably_damaging(1) | TCGA-EK-A3GK-01 | Cervix | cervical & endocervical cancer | Female | <65 | I/II | Unknown | Unknown | SD |
| VPS26B | SNV | Missense_Mutation | rs764777364 | c.565N>G | p.Ile189Val | p.I189V | Q4G0F5 | protein_coding | tolerated(0.23) | benign(0.161) | TCGA-5M-AAT6-01 | Colorectum | colon adenocarcinoma | Female | <65 | III/IV | Unknown | Unknown | PD |
| VPS26B | SNV | Missense_Mutation | c.430N>A | p.Glu144Lys | p.E144K | Q4G0F5 | protein_coding | deleterious(0) | probably_damaging(0.999) | TCGA-AA-3492-01 | Colorectum | colon adenocarcinoma | Female | >=65 | I/II | Unknown | Unknown | SD | |
| VPS26B | SNV | Missense_Mutation | c.268N>A | p.Val90Met | p.V90M | Q4G0F5 | protein_coding | deleterious(0.03) | benign(0.062) | TCGA-AA-3672-01 | Colorectum | colon adenocarcinoma | Female | >=65 | III/IV | Unknown | Unknown | SD | |
| VPS26B | SNV | Missense_Mutation | rs751395535 | c.910N>A | p.Ser304Thr | p.S304T | Q4G0F5 | protein_coding | tolerated(0.47) | benign(0.003) | TCGA-F4-6856-01 | Colorectum | colon adenocarcinoma | Male | <65 | I/II | Ancillary | leucovorin | CR |
| Page: 1 2 3 4 |
Top |
Related drugs of malignant transformation related genes |
| Identification of chemicals and drugs interact with genes involved in malignant transfromation |
| (DGIdb 4.0) |
| Entrez ID | Symbol | Category | Interaction Types | Drug Claim Name | Drug Name | PMIDs |
| Page: 1 |

Copyright 2023-Present -The University of Texas Health Science Center at Houston |