
|
|||||
|
 | |
| |
| |
| |
| |
| |
|
Gene: VPS25 |
Gene summary for VPS25 |
| Gene information | Species | Human | Gene symbol | VPS25 | Gene ID | 84313 |
| Gene name | vacuolar protein sorting 25 homolog | |
| Gene Alias | DERP9 | |
| Cytomap | 17q21.2 | |
| Gene Type | protein-coding | GO ID | GO:0001932 | UniProtAcc | A0A024R1X3 |
Top |
Malignant transformation analysis |
| Identification of the aberrant gene expression in precancerous and cancerous lesions by comparing the gene expression of stem-like cells in diseased tissues with normal stem cells |
| Entrez ID | Symbol | Replicates | Species | Organ | Tissue | Adj P-value | Log2FC | Malignancy |
| 84313 | VPS25 | HTA11_2487_2000001011 | Human | Colorectum | SER | 4.32e-04 | 2.57e-01 | -0.1808 |
| 84313 | VPS25 | HTA11_1938_2000001011 | Human | Colorectum | AD | 9.58e-07 | 3.45e-01 | -0.0811 |
| 84313 | VPS25 | HTA11_347_2000001011 | Human | Colorectum | AD | 4.25e-07 | 2.53e-01 | -0.1954 |
| 84313 | VPS25 | HTA11_411_2000001011 | Human | Colorectum | SER | 1.27e-06 | 6.23e-01 | -0.2602 |
| 84313 | VPS25 | HTA11_2112_2000001011 | Human | Colorectum | SER | 2.10e-04 | 4.40e-01 | -0.2196 |
| 84313 | VPS25 | HTA11_696_2000001011 | Human | Colorectum | AD | 4.87e-14 | 2.87e-01 | -0.1464 |
| 84313 | VPS25 | HTA11_866_2000001011 | Human | Colorectum | AD | 3.74e-05 | 1.85e-01 | -0.1001 |
| 84313 | VPS25 | HTA11_1391_2000001011 | Human | Colorectum | AD | 5.05e-05 | 2.71e-01 | -0.059 |
| 84313 | VPS25 | HTA11_5212_2000001011 | Human | Colorectum | AD | 2.26e-04 | 3.55e-01 | -0.2061 |
| 84313 | VPS25 | HTA11_866_3004761011 | Human | Colorectum | AD | 8.57e-05 | 2.37e-01 | 0.096 |
| 84313 | VPS25 | HTA11_7696_3000711011 | Human | Colorectum | AD | 3.88e-05 | 2.15e-01 | 0.0674 |
| 84313 | VPS25 | HTA11_99999970781_79442 | Human | Colorectum | MSS | 2.19e-13 | 3.05e-01 | 0.294 |
| 84313 | VPS25 | HTA11_99999965104_69814 | Human | Colorectum | MSS | 1.35e-03 | 3.22e-01 | 0.281 |
| 84313 | VPS25 | HTA11_99999971662_82457 | Human | Colorectum | MSS | 1.13e-11 | 3.38e-01 | 0.3859 |
| 84313 | VPS25 | HTA11_99999973899_84307 | Human | Colorectum | MSS | 2.90e-02 | 3.19e-01 | 0.2585 |
| 84313 | VPS25 | HTA11_99999974143_84620 | Human | Colorectum | MSS | 1.05e-17 | 3.69e-01 | 0.3005 |
| 84313 | VPS25 | LZE2T | Human | Esophagus | ESCC | 1.27e-02 | 5.90e-01 | 0.082 |
| 84313 | VPS25 | LZE4T | Human | Esophagus | ESCC | 5.90e-22 | 6.25e-01 | 0.0811 |
| 84313 | VPS25 | LZE5T | Human | Esophagus | ESCC | 1.14e-06 | 6.72e-01 | 0.0514 |
| 84313 | VPS25 | LZE7T | Human | Esophagus | ESCC | 7.02e-13 | 8.31e-01 | 0.0667 |
| Page: 1 2 3 4 5 6 7 8 |
| Tissue | Expression Dynamics | Abbreviation |
| Colorectum (GSE201348) |  | FAP: Familial adenomatous polyposis |
| CRC: Colorectal cancer | ||
| Colorectum (HTA11) |  | AD: Adenomas |
| SER: Sessile serrated lesions | ||
| MSI-H: Microsatellite-high colorectal cancer | ||
| MSS: Microsatellite stable colorectal cancer | ||
| Esophagus | 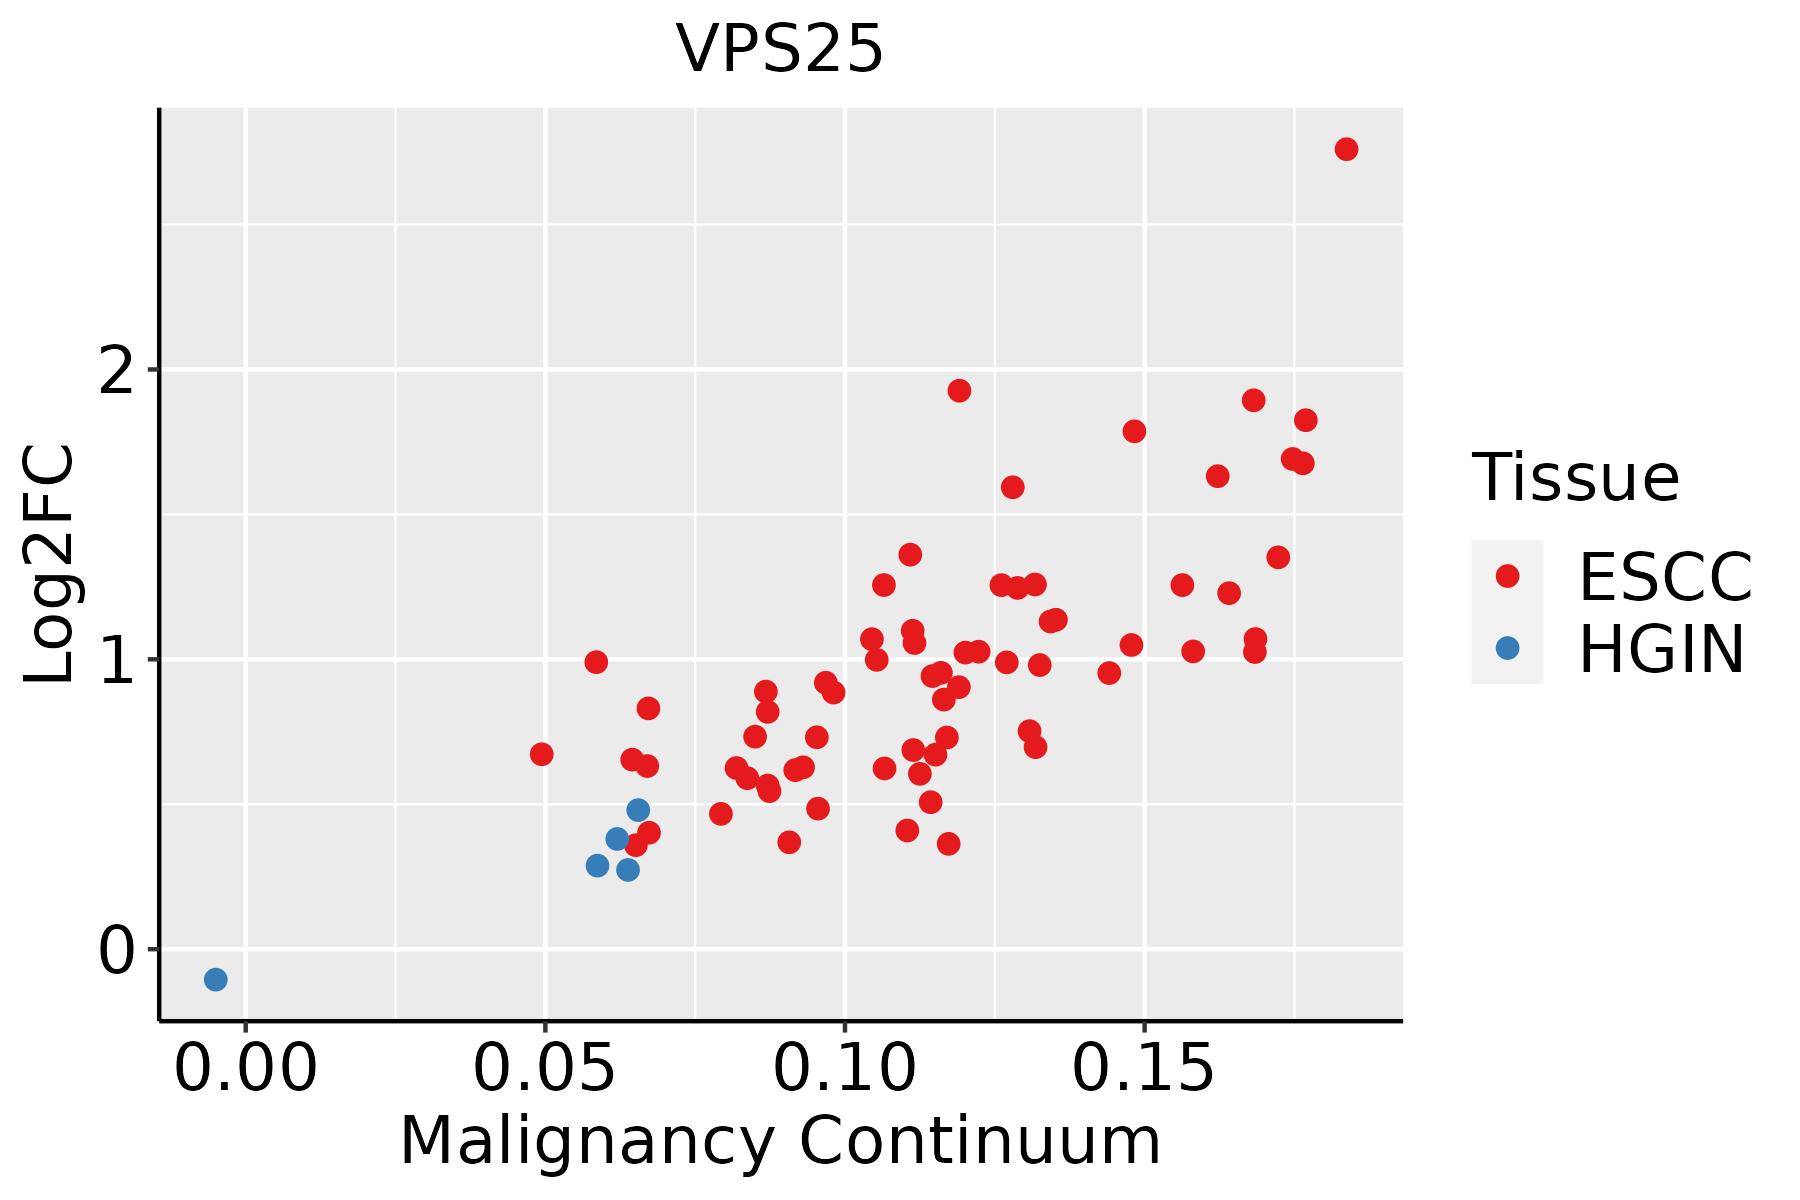 | ESCC: Esophageal squamous cell carcinoma |
| HGIN: High-grade intraepithelial neoplasias | ||
| LGIN: Low-grade intraepithelial neoplasias | ||
| Liver | 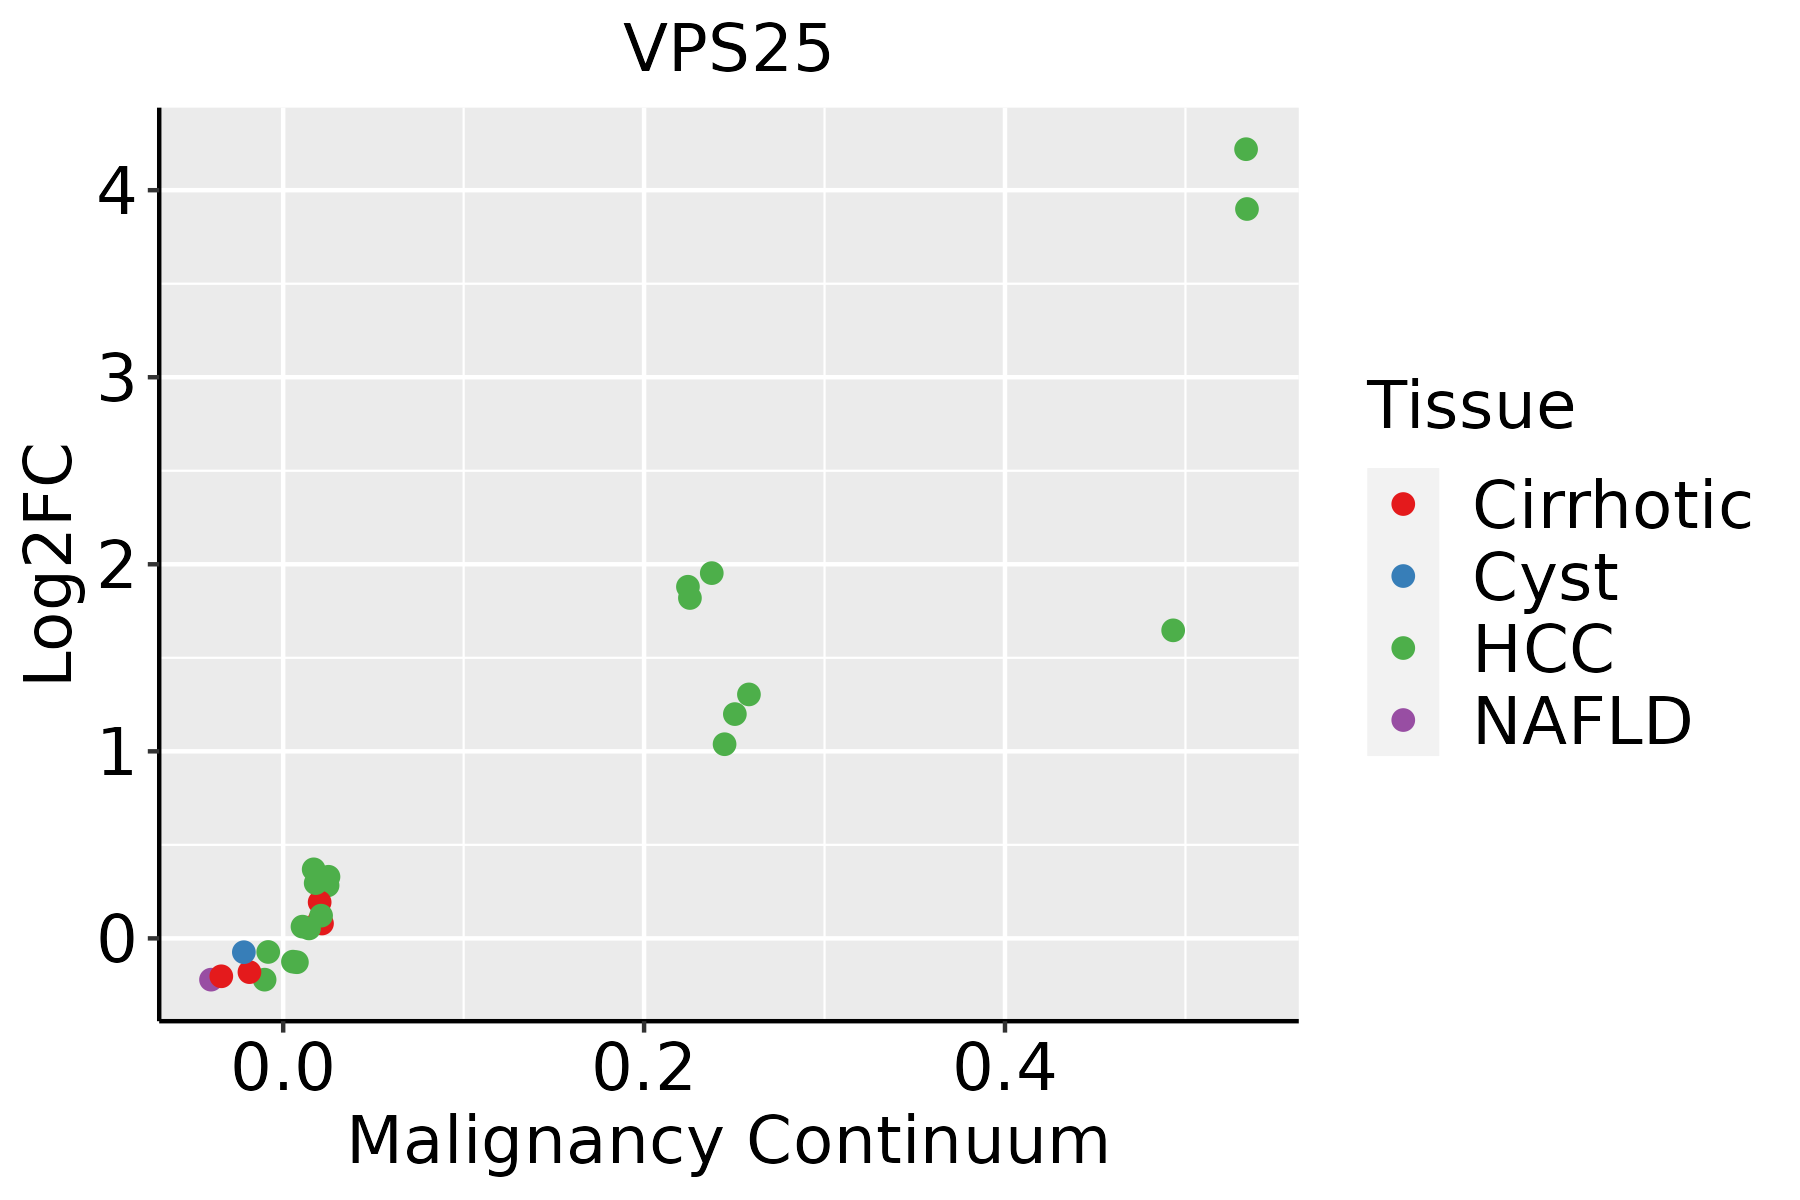 | HCC: Hepatocellular carcinoma |
| NAFLD: Non-alcoholic fatty liver disease | ||
| Oral Cavity | 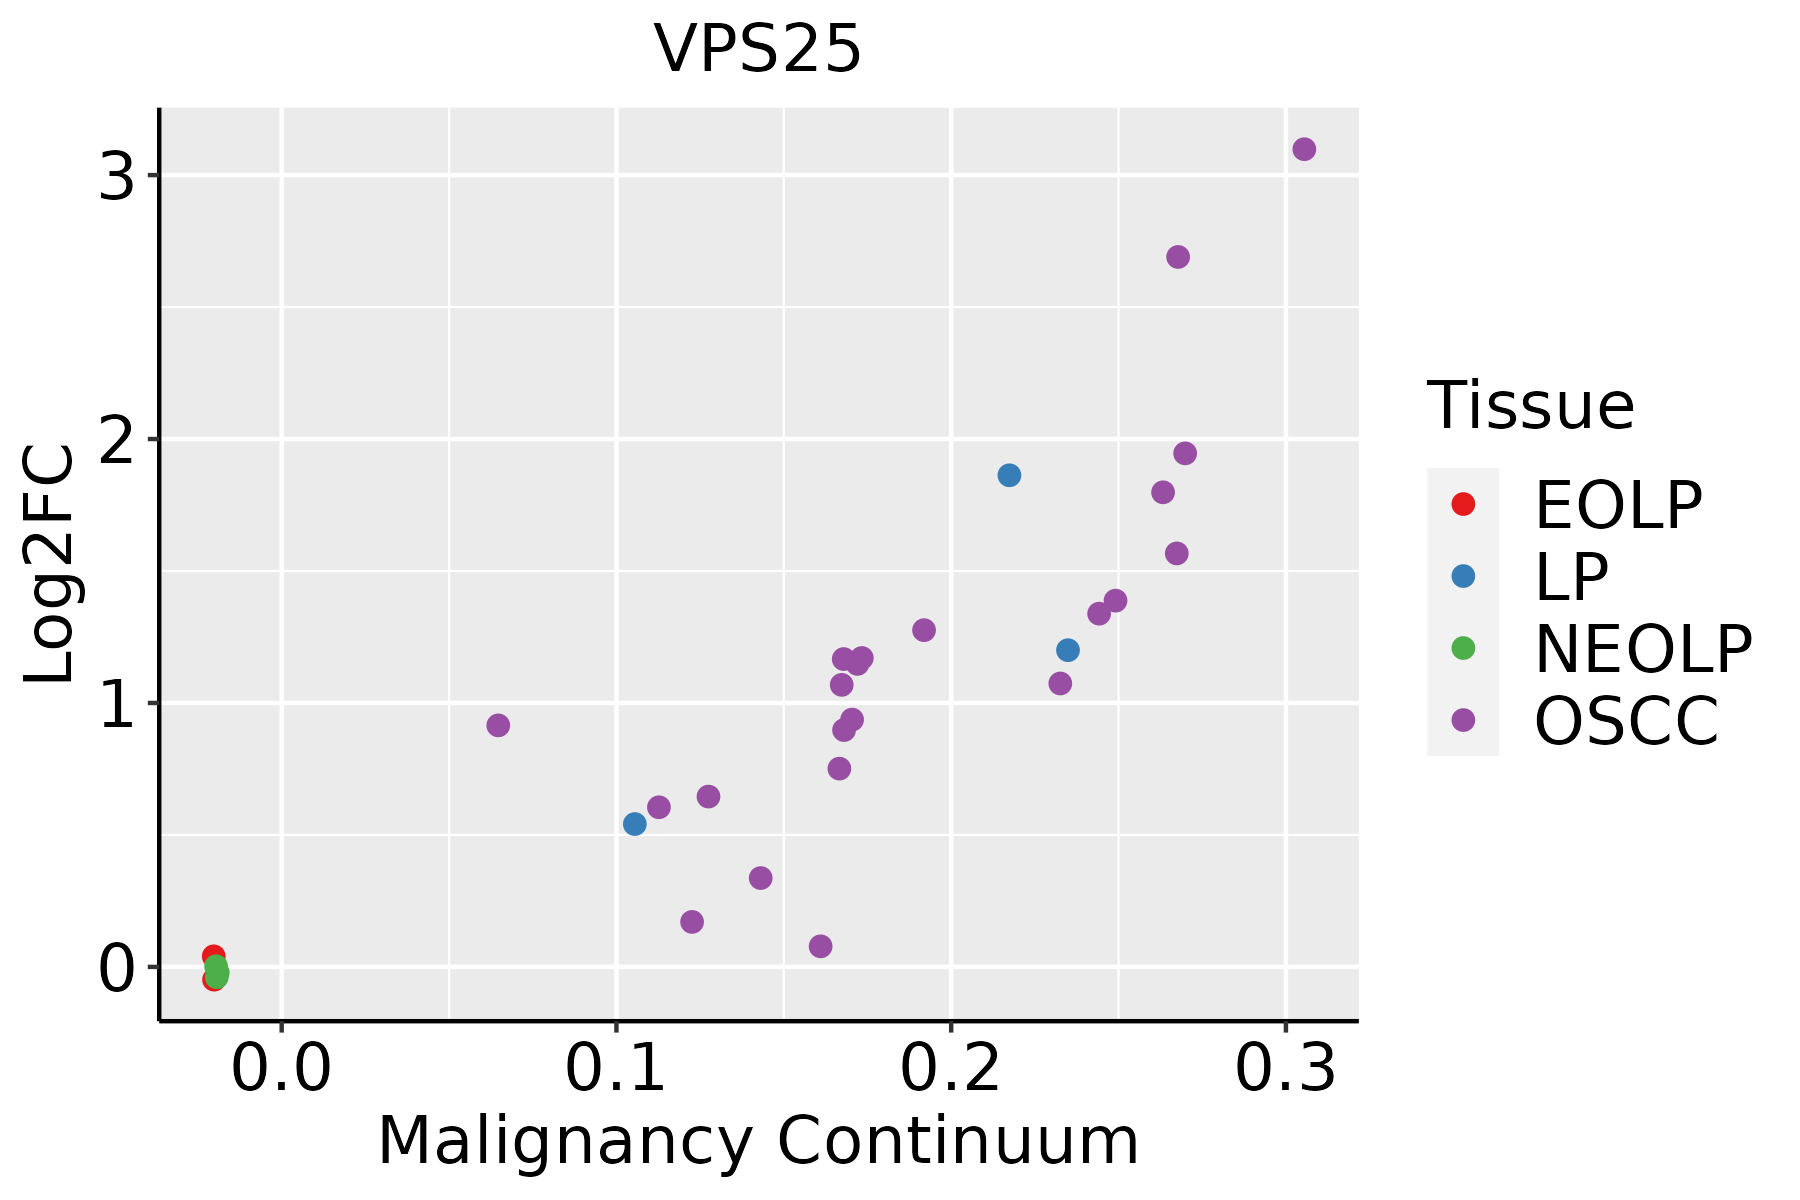 | EOLP: Erosive Oral lichen planus |
| LP: leukoplakia | ||
| NEOLP: Non-erosive oral lichen planus | ||
| OSCC: Oral squamous cell carcinoma | ||
| Skin | 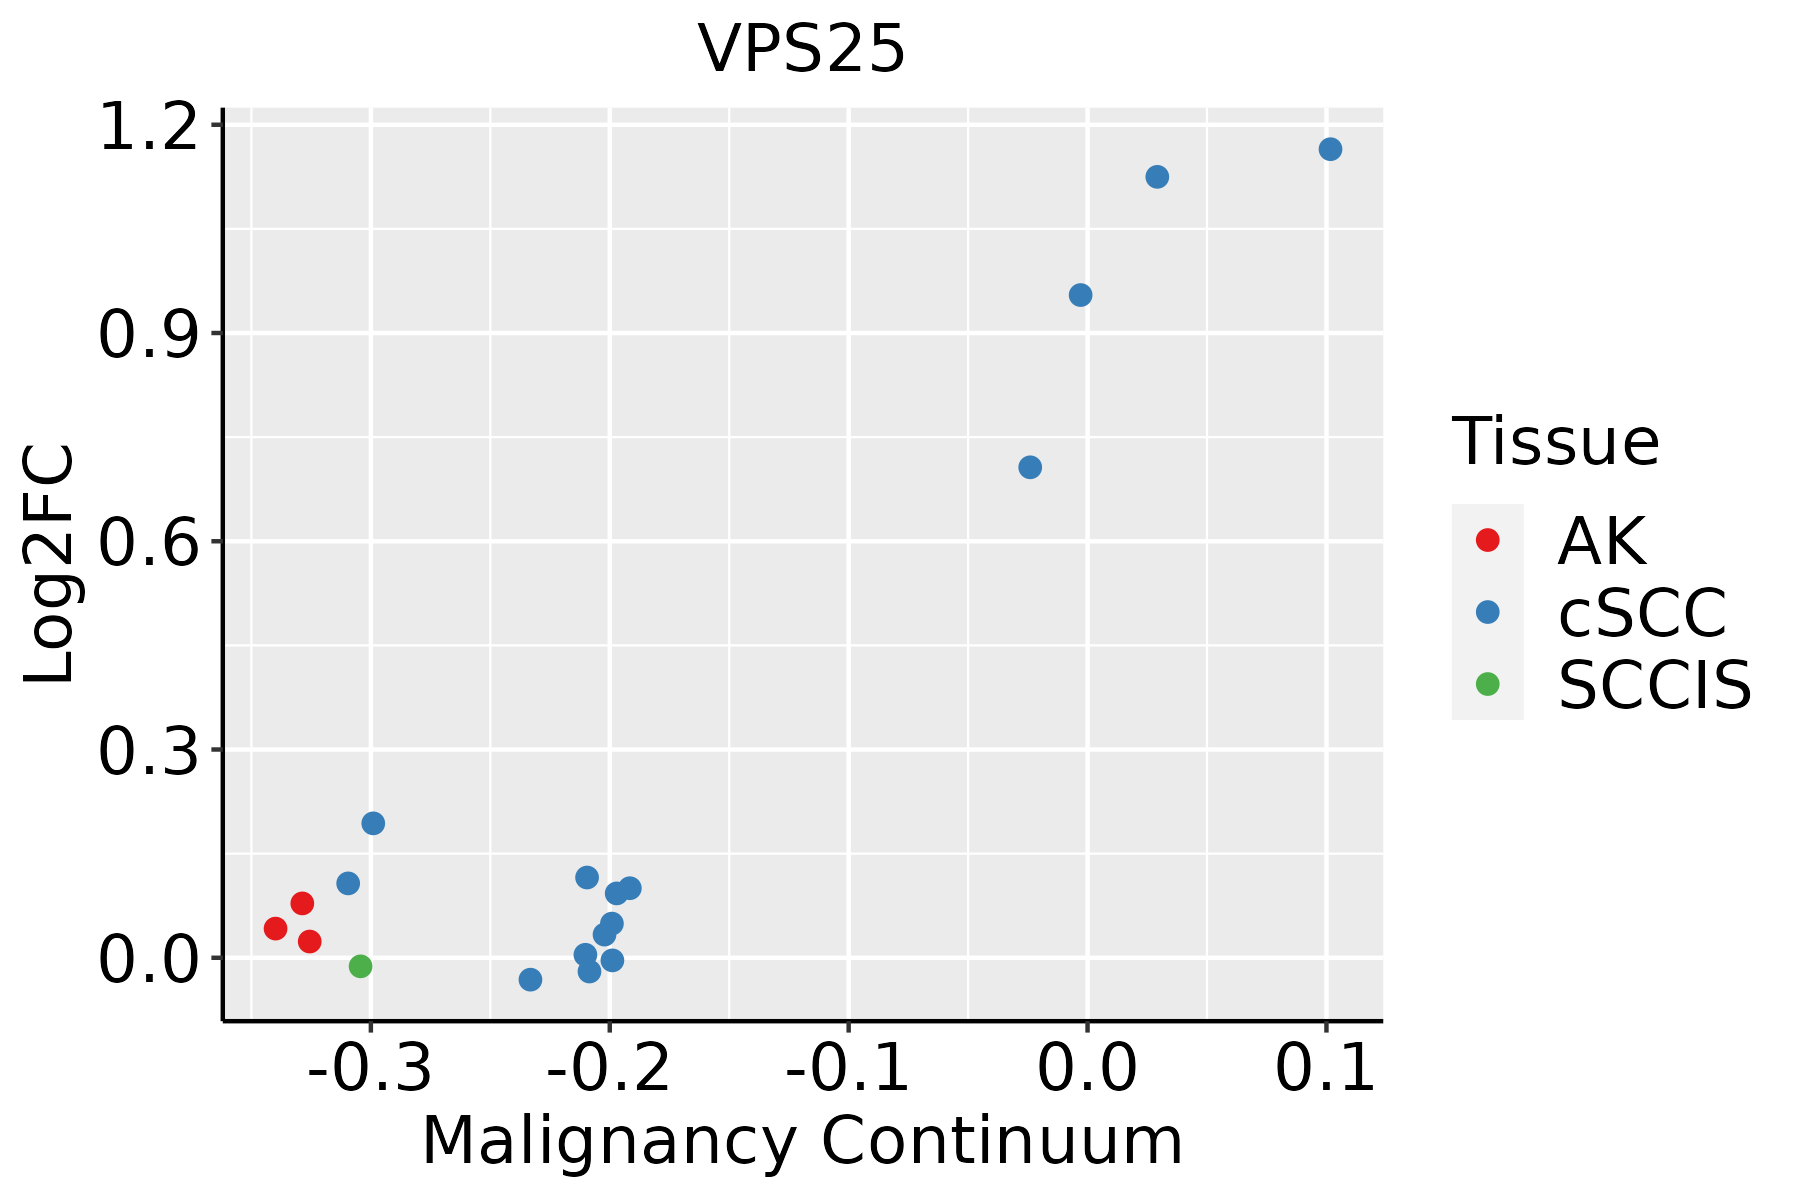 | AK: Actinic keratosis |
| cSCC: Cutaneous squamous cell carcinoma | ||
| SCCIS:squamous cell carcinoma in situ | ||
| Thyroid | 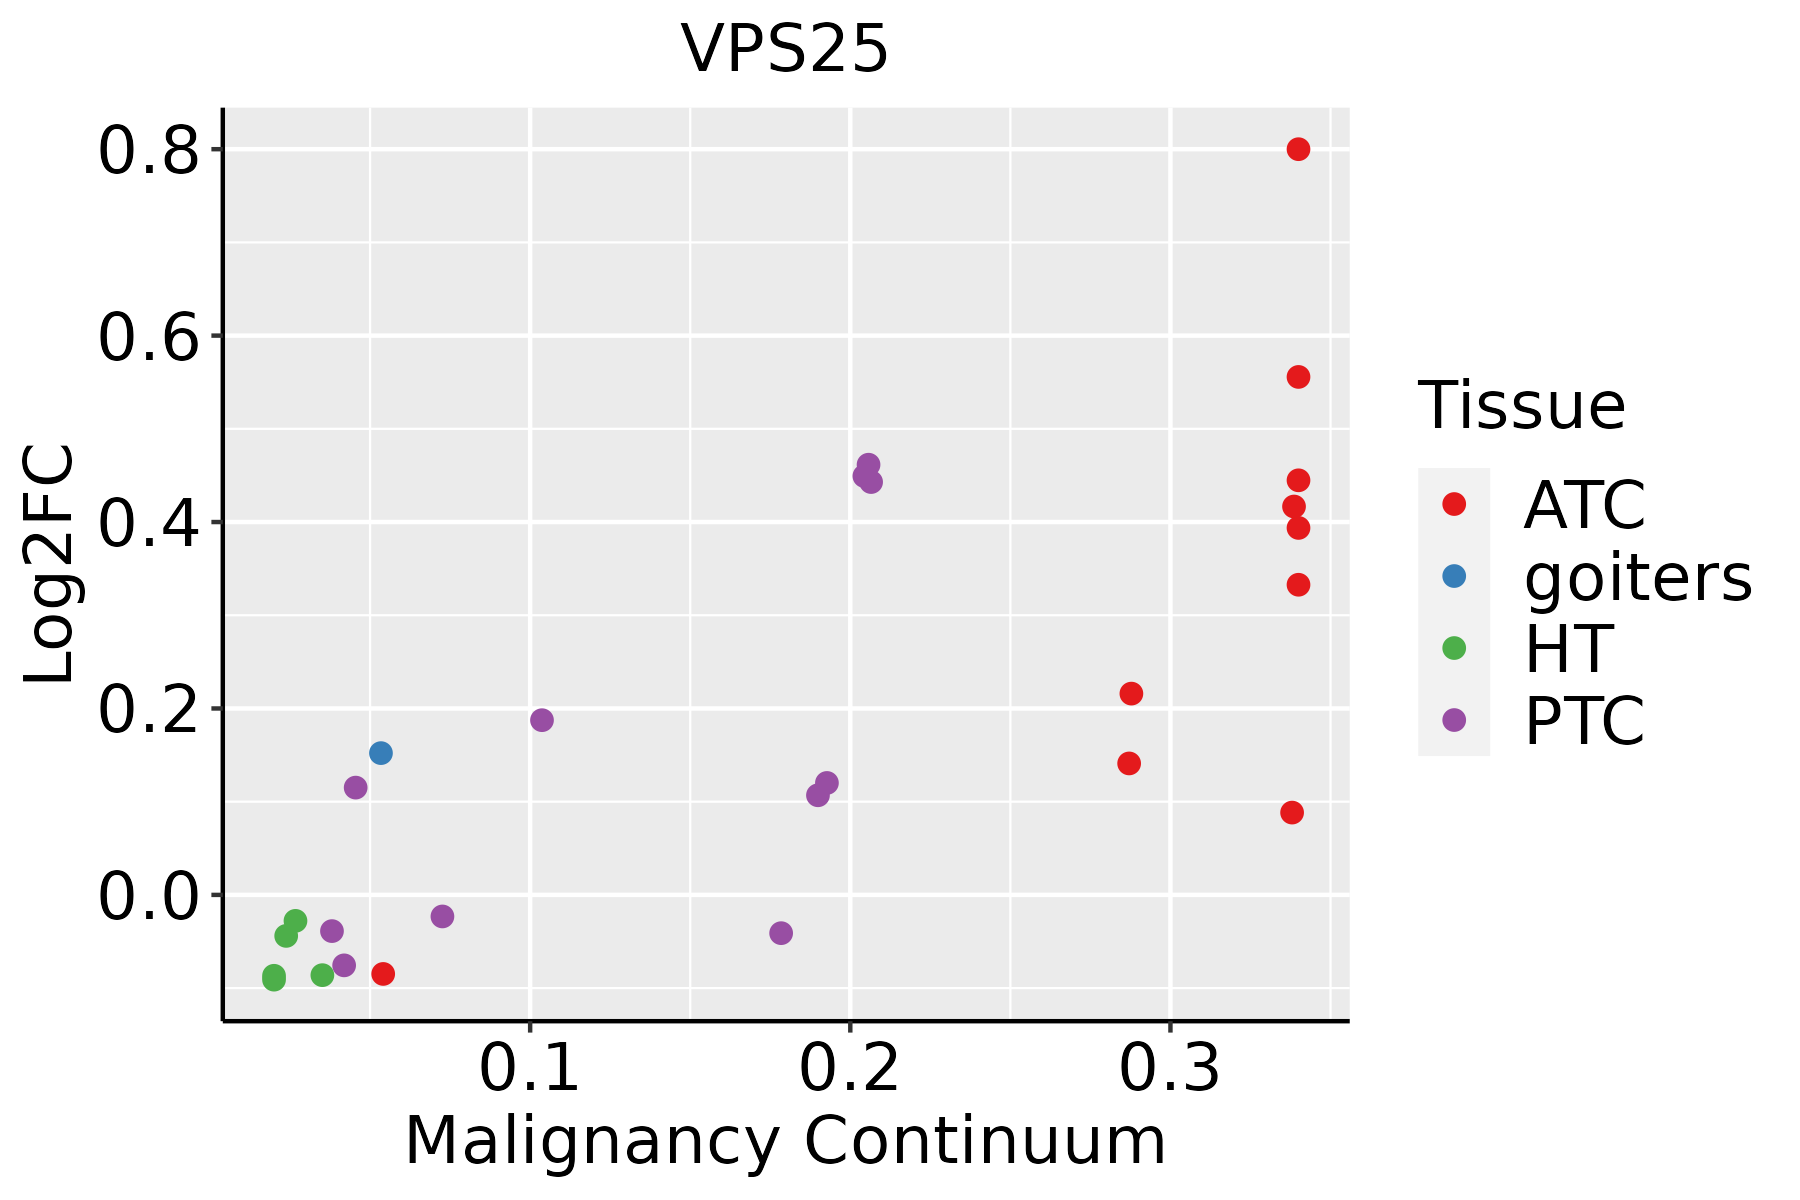 | ATC: Anaplastic thyroid cancer |
| HT: Hashimoto's thyroiditis | ||
| PTC: Papillary thyroid cancer |
| ∗log2FC in expression of this searched gene in stem-like cells from each diseased tissue sample relative to stem-like cells in normal samples in each tissue plotted against the malignancy continuum. Samples are colored based on if they are from different disease stage. |
Top |
Malignant transformation related pathway analysis |
| Find out the enriched GO biological processes and KEGG pathways involved in transition from healthy to precancer to cancer |
| Tissue | Disease Stage | Enriched GO biological Processes |
| Colorectum | AD |  |
| Colorectum | SER |  |
| Colorectum | MSS |  |
| Colorectum | MSI-H |  |
| Colorectum | FAP |  |
| ∗Top 15 enriched GO BP terms are showed in the bar plot of each disease state in each tissue. Each row represents a significant GO biological process which is colored according to the -log10(p.adjust). |
| Page: 1 2 3 4 5 6 7 8 9 |
| GO ID | Tissue | Disease Stage | Description | Gene Ratio | Bg Ratio | pvalue | p.adjust | Count |
| GO:0072594 | Colorectum | AD | establishment of protein localization to organelle | 148/3918 | 422/18723 | 7.95e-12 | 1.04e-09 | 148 |
| GO:0016197 | Colorectum | AD | endosomal transport | 90/3918 | 230/18723 | 1.88e-10 | 1.73e-08 | 90 |
| GO:0038127 | Colorectum | AD | ERBB signaling pathway | 55/3918 | 121/18723 | 1.19e-09 | 8.85e-08 | 55 |
| GO:0007173 | Colorectum | AD | epidermal growth factor receptor signaling pathway | 50/3918 | 108/18723 | 3.08e-09 | 2.07e-07 | 50 |
| GO:0016236 | Colorectum | AD | macroautophagy | 103/3918 | 291/18723 | 6.76e-09 | 4.15e-07 | 103 |
| GO:0016050 | Colorectum | AD | vesicle organization | 101/3918 | 300/18723 | 1.65e-07 | 7.17e-06 | 101 |
| GO:0007034 | Colorectum | AD | vacuolar transport | 60/3918 | 157/18723 | 4.97e-07 | 1.85e-05 | 60 |
| GO:1901185 | Colorectum | AD | negative regulation of ERBB signaling pathway | 19/3918 | 32/18723 | 2.39e-06 | 6.98e-05 | 19 |
| GO:1901184 | Colorectum | AD | regulation of ERBB signaling pathway | 34/3918 | 79/18723 | 7.46e-06 | 1.82e-04 | 34 |
| GO:0010563 | Colorectum | AD | negative regulation of phosphorus metabolic process | 130/3918 | 442/18723 | 1.26e-05 | 2.76e-04 | 130 |
| GO:0045936 | Colorectum | AD | negative regulation of phosphate metabolic process | 129/3918 | 441/18723 | 1.81e-05 | 3.76e-04 | 129 |
| GO:0051348 | Colorectum | AD | negative regulation of transferase activity | 85/3918 | 268/18723 | 2.07e-05 | 4.19e-04 | 85 |
| GO:0042058 | Colorectum | AD | regulation of epidermal growth factor receptor signaling pathway | 31/3918 | 73/18723 | 2.56e-05 | 4.89e-04 | 31 |
| GO:0042059 | Colorectum | AD | negative regulation of epidermal growth factor receptor signaling pathway | 16/3918 | 28/18723 | 2.96e-05 | 5.46e-04 | 16 |
| GO:0036257 | Colorectum | AD | multivesicular body organization | 17/3918 | 31/18723 | 3.45e-05 | 6.29e-04 | 17 |
| GO:0071985 | Colorectum | AD | multivesicular body sorting pathway | 19/3918 | 37/18723 | 4.08e-05 | 7.26e-04 | 19 |
| GO:0007032 | Colorectum | AD | endosome organization | 33/3918 | 82/18723 | 5.30e-05 | 9.01e-04 | 33 |
| GO:0042326 | Colorectum | AD | negative regulation of phosphorylation | 112/3918 | 385/18723 | 8.02e-05 | 1.27e-03 | 112 |
| GO:0036258 | Colorectum | AD | multivesicular body assembly | 16/3918 | 30/18723 | 9.18e-05 | 1.40e-03 | 16 |
| GO:0001933 | Colorectum | AD | negative regulation of protein phosphorylation | 101/3918 | 342/18723 | 9.39e-05 | 1.42e-03 | 101 |
| Page: 1 2 3 4 5 6 7 8 9 10 11 12 13 14 15 16 17 18 |
| Pathway ID | Tissue | Disease Stage | Description | Gene Ratio | Bg Ratio | pvalue | p.adjust | qvalue | Count |
| hsa04144 | Colorectum | AD | Endocytosis | 111/2092 | 251/8465 | 5.95e-12 | 1.42e-10 | 9.08e-11 | 111 |
| hsa041441 | Colorectum | AD | Endocytosis | 111/2092 | 251/8465 | 5.95e-12 | 1.42e-10 | 9.08e-11 | 111 |
| hsa041442 | Colorectum | SER | Endocytosis | 81/1580 | 251/8465 | 1.14e-07 | 2.36e-06 | 1.71e-06 | 81 |
| hsa041443 | Colorectum | SER | Endocytosis | 81/1580 | 251/8465 | 1.14e-07 | 2.36e-06 | 1.71e-06 | 81 |
| hsa041444 | Colorectum | MSS | Endocytosis | 102/1875 | 251/8465 | 1.85e-11 | 4.43e-10 | 2.71e-10 | 102 |
| hsa041445 | Colorectum | MSS | Endocytosis | 102/1875 | 251/8465 | 1.85e-11 | 4.43e-10 | 2.71e-10 | 102 |
| hsa0414429 | Esophagus | HGIN | Endocytosis | 76/1383 | 251/8465 | 1.74e-08 | 3.34e-07 | 2.65e-07 | 76 |
| hsa04144113 | Esophagus | HGIN | Endocytosis | 76/1383 | 251/8465 | 1.74e-08 | 3.34e-07 | 2.65e-07 | 76 |
| hsa04144210 | Esophagus | ESCC | Endocytosis | 186/4205 | 251/8465 | 9.74e-16 | 4.66e-14 | 2.39e-14 | 186 |
| hsa0414437 | Esophagus | ESCC | Endocytosis | 186/4205 | 251/8465 | 9.74e-16 | 4.66e-14 | 2.39e-14 | 186 |
| hsa0414412 | Liver | Cirrhotic | Endocytosis | 119/2530 | 251/8465 | 2.33e-09 | 4.56e-08 | 2.81e-08 | 119 |
| hsa0414413 | Liver | Cirrhotic | Endocytosis | 119/2530 | 251/8465 | 2.33e-09 | 4.56e-08 | 2.81e-08 | 119 |
| hsa0414422 | Liver | HCC | Endocytosis | 178/4020 | 251/8465 | 2.03e-14 | 5.22e-13 | 2.91e-13 | 178 |
| hsa0414432 | Liver | HCC | Endocytosis | 178/4020 | 251/8465 | 2.03e-14 | 5.22e-13 | 2.91e-13 | 178 |
| hsa0414427 | Oral cavity | OSCC | Endocytosis | 174/3704 | 251/8465 | 9.42e-17 | 4.51e-15 | 2.29e-15 | 174 |
| hsa04144112 | Oral cavity | OSCC | Endocytosis | 174/3704 | 251/8465 | 9.42e-17 | 4.51e-15 | 2.29e-15 | 174 |
| hsa0414428 | Oral cavity | LP | Endocytosis | 121/2418 | 251/8465 | 1.89e-11 | 3.70e-10 | 2.38e-10 | 121 |
| hsa0414436 | Oral cavity | LP | Endocytosis | 121/2418 | 251/8465 | 1.89e-11 | 3.70e-10 | 2.38e-10 | 121 |
| Page: 1 |
Top |
Cell-cell communication analysis |
| Identification of potential cell-cell interactions between two cell types and their ligand-receptor pairs for different disease states |
| Ligand | Receptor | LRpair | Pathway | Tissue | Disease Stage |
| Page: 1 |
Top |
Single-cell gene regulatory network inference analysis |
| Find out the significant the regulons (TFs) and the target genes of each regulon across cell types for different disease states |
| TF | Cell Type | Tissue | Disease Stage | Target Gene | RSS | Regulon Activity |
| ∗The dot plots of a searched regulon are shown for all cell subpopulations in each disease state of each tissue based on the regulon specific score inferred using pySCENIC and by calculating the average expression. |
| Page: 1 |
Top |
Somatic mutation of malignant transformation related genes |
| Annotation of somatic variants for genes involved in malignant transformation |
| Hugo Symbol | Variant Class | Variant Classification | dbSNP RS | HGVSc | HGVSp | HGVSp Short | SWISSPROT | BIOTYPE | SIFT | PolyPhen | Tumor Sample Barcode | Tissue | Histology | Sex | Age | Stage | Therapy Types | Drugs | Outcome |
| VPS25 | SNV | Missense_Mutation | c.445C>G | p.Leu149Val | p.L149V | Q9BRG1 | protein_coding | deleterious(0.05) | possibly_damaging(0.554) | TCGA-LQ-A4E4-01 | Breast | breast invasive carcinoma | Female | >=65 | III/IV | Hormone Therapy | anastrozole | PD | |
| VPS25 | SNV | Missense_Mutation | c.316N>A | p.Glu106Lys | p.E106K | Q9BRG1 | protein_coding | deleterious(0) | probably_damaging(0.959) | TCGA-C5-A1MK-01 | Cervix | cervical & endocervical cancer | Female | >=65 | III/IV | Chemotherapy | carboplatin | PD | |
| VPS25 | SNV | Missense_Mutation | novel | c.34N>G | p.Arg12Gly | p.R12G | Q9BRG1 | protein_coding | tolerated(0.07) | benign(0.007) | TCGA-MY-A913-01 | Cervix | cervical & endocervical cancer | Female | <65 | I/II | Chemotherapy | cisplatin | CR |
| VPS25 | SNV | Missense_Mutation | novel | c.528N>A | p.Phe176Leu | p.F176L | Q9BRG1 | protein_coding | tolerated(0.16) | benign(0.131) | TCGA-EO-A3B0-01 | Endometrium | uterine corpus endometrioid carcinoma | Female | <65 | III/IV | Unknown | Unknown | SD |
| VPS25 | SNV | Missense_Mutation | novel | c.262N>A | p.Glu88Lys | p.E88K | Q9BRG1 | protein_coding | tolerated(0.07) | possibly_damaging(0.876) | TCGA-EY-A215-01 | Endometrium | uterine corpus endometrioid carcinoma | Female | <65 | I/II | Unknown | Unknown | SD |
| VPS25 | SNV | Missense_Mutation | novel | c.406N>G | p.Thr136Ala | p.T136A | Q9BRG1 | protein_coding | deleterious(0.05) | benign(0.425) | TCGA-4R-AA8I-01 | Liver | liver hepatocellular carcinoma | Male | >=65 | I/II | Unknown | Unknown | PD |
| VPS25 | SNV | Missense_Mutation | novel | c.77N>T | p.Arg26Leu | p.R26L | Q9BRG1 | protein_coding | deleterious(0.03) | benign(0.313) | TCGA-5C-A9VG-01 | Liver | liver hepatocellular carcinoma | Male | <65 | I/II | Unknown | Unknown | SD |
| VPS25 | SNV | Missense_Mutation | rs141909224 | c.23N>T | p.Pro8Leu | p.P8L | Q9BRG1 | protein_coding | deleterious(0) | probably_damaging(1) | TCGA-CN-6998-01 | Oral cavity | head & neck squamous cell carcinoma | Male | <65 | I/II | Chemotherapy | cisplatin | PD |
| VPS25 | SNV | Missense_Mutation | novel | c.356N>A | p.Gly119Asp | p.G119D | Q9BRG1 | protein_coding | deleterious(0) | probably_damaging(0.996) | TCGA-FP-A4BE-01 | Stomach | stomach adenocarcinoma | Male | <65 | I/II | Chemotherapy | 5-fluorouracil | CR |
| Page: 1 |
Top |
Related drugs of malignant transformation related genes |
| Identification of chemicals and drugs interact with genes involved in malignant transfromation |
| (DGIdb 4.0) |
| Entrez ID | Symbol | Category | Interaction Types | Drug Claim Name | Drug Name | PMIDs |
| Page: 1 |

Copyright 2023-Present -The University of Texas Health Science Center at Houston |