
|
|||||
|
 | |
| |
| |
| |
| |
| |
|
Gene: VPS16 |
Gene summary for VPS16 |
| Gene information | Species | Human | Gene symbol | VPS16 | Gene ID | 64601 |
| Gene name | VPS16 core subunit of CORVET and HOPS complexes | |
| Gene Alias | DYT30 | |
| Cytomap | 20p13 | |
| Gene Type | protein-coding | GO ID | GO:0006810 | UniProtAcc | Q9H269 |
Top |
Malignant transformation analysis |
| Identification of the aberrant gene expression in precancerous and cancerous lesions by comparing the gene expression of stem-like cells in diseased tissues with normal stem cells |
| Entrez ID | Symbol | Replicates | Species | Organ | Tissue | Adj P-value | Log2FC | Malignancy |
| 64601 | VPS16 | LZE4T | Human | Esophagus | ESCC | 2.57e-03 | 1.50e-01 | 0.0811 |
| 64601 | VPS16 | LZE7T | Human | Esophagus | ESCC | 2.84e-03 | 2.31e-01 | 0.0667 |
| 64601 | VPS16 | LZE8T | Human | Esophagus | ESCC | 9.33e-04 | 1.37e-01 | 0.067 |
| 64601 | VPS16 | LZE24T | Human | Esophagus | ESCC | 2.88e-06 | 2.52e-01 | 0.0596 |
| 64601 | VPS16 | P1T-E | Human | Esophagus | ESCC | 1.27e-06 | 3.79e-01 | 0.0875 |
| 64601 | VPS16 | P2T-E | Human | Esophagus | ESCC | 6.44e-19 | 2.68e-01 | 0.1177 |
| 64601 | VPS16 | P4T-E | Human | Esophagus | ESCC | 3.37e-04 | 1.17e-01 | 0.1323 |
| 64601 | VPS16 | P5T-E | Human | Esophagus | ESCC | 7.02e-06 | 4.42e-02 | 0.1327 |
| 64601 | VPS16 | P8T-E | Human | Esophagus | ESCC | 7.84e-12 | 1.65e-01 | 0.0889 |
| 64601 | VPS16 | P9T-E | Human | Esophagus | ESCC | 1.35e-07 | 1.23e-01 | 0.1131 |
| 64601 | VPS16 | P10T-E | Human | Esophagus | ESCC | 1.95e-12 | 2.53e-01 | 0.116 |
| 64601 | VPS16 | P11T-E | Human | Esophagus | ESCC | 6.46e-08 | 4.38e-01 | 0.1426 |
| 64601 | VPS16 | P12T-E | Human | Esophagus | ESCC | 1.25e-21 | 3.95e-01 | 0.1122 |
| 64601 | VPS16 | P15T-E | Human | Esophagus | ESCC | 3.14e-07 | 1.94e-01 | 0.1149 |
| 64601 | VPS16 | P16T-E | Human | Esophagus | ESCC | 2.12e-16 | 2.09e-01 | 0.1153 |
| 64601 | VPS16 | P17T-E | Human | Esophagus | ESCC | 4.50e-14 | 4.69e-01 | 0.1278 |
| 64601 | VPS16 | P19T-E | Human | Esophagus | ESCC | 8.32e-04 | 3.53e-01 | 0.1662 |
| 64601 | VPS16 | P20T-E | Human | Esophagus | ESCC | 5.76e-11 | 2.66e-01 | 0.1124 |
| 64601 | VPS16 | P21T-E | Human | Esophagus | ESCC | 4.51e-24 | 5.13e-01 | 0.1617 |
| 64601 | VPS16 | P22T-E | Human | Esophagus | ESCC | 1.64e-08 | 4.96e-02 | 0.1236 |
| Page: 1 2 3 4 5 6 |
| Tissue | Expression Dynamics | Abbreviation |
| Esophagus |  | ESCC: Esophageal squamous cell carcinoma |
| HGIN: High-grade intraepithelial neoplasias | ||
| LGIN: Low-grade intraepithelial neoplasias | ||
| Liver |  | HCC: Hepatocellular carcinoma |
| NAFLD: Non-alcoholic fatty liver disease | ||
| Oral Cavity |  | EOLP: Erosive Oral lichen planus |
| LP: leukoplakia | ||
| NEOLP: Non-erosive oral lichen planus | ||
| OSCC: Oral squamous cell carcinoma | ||
| Thyroid | 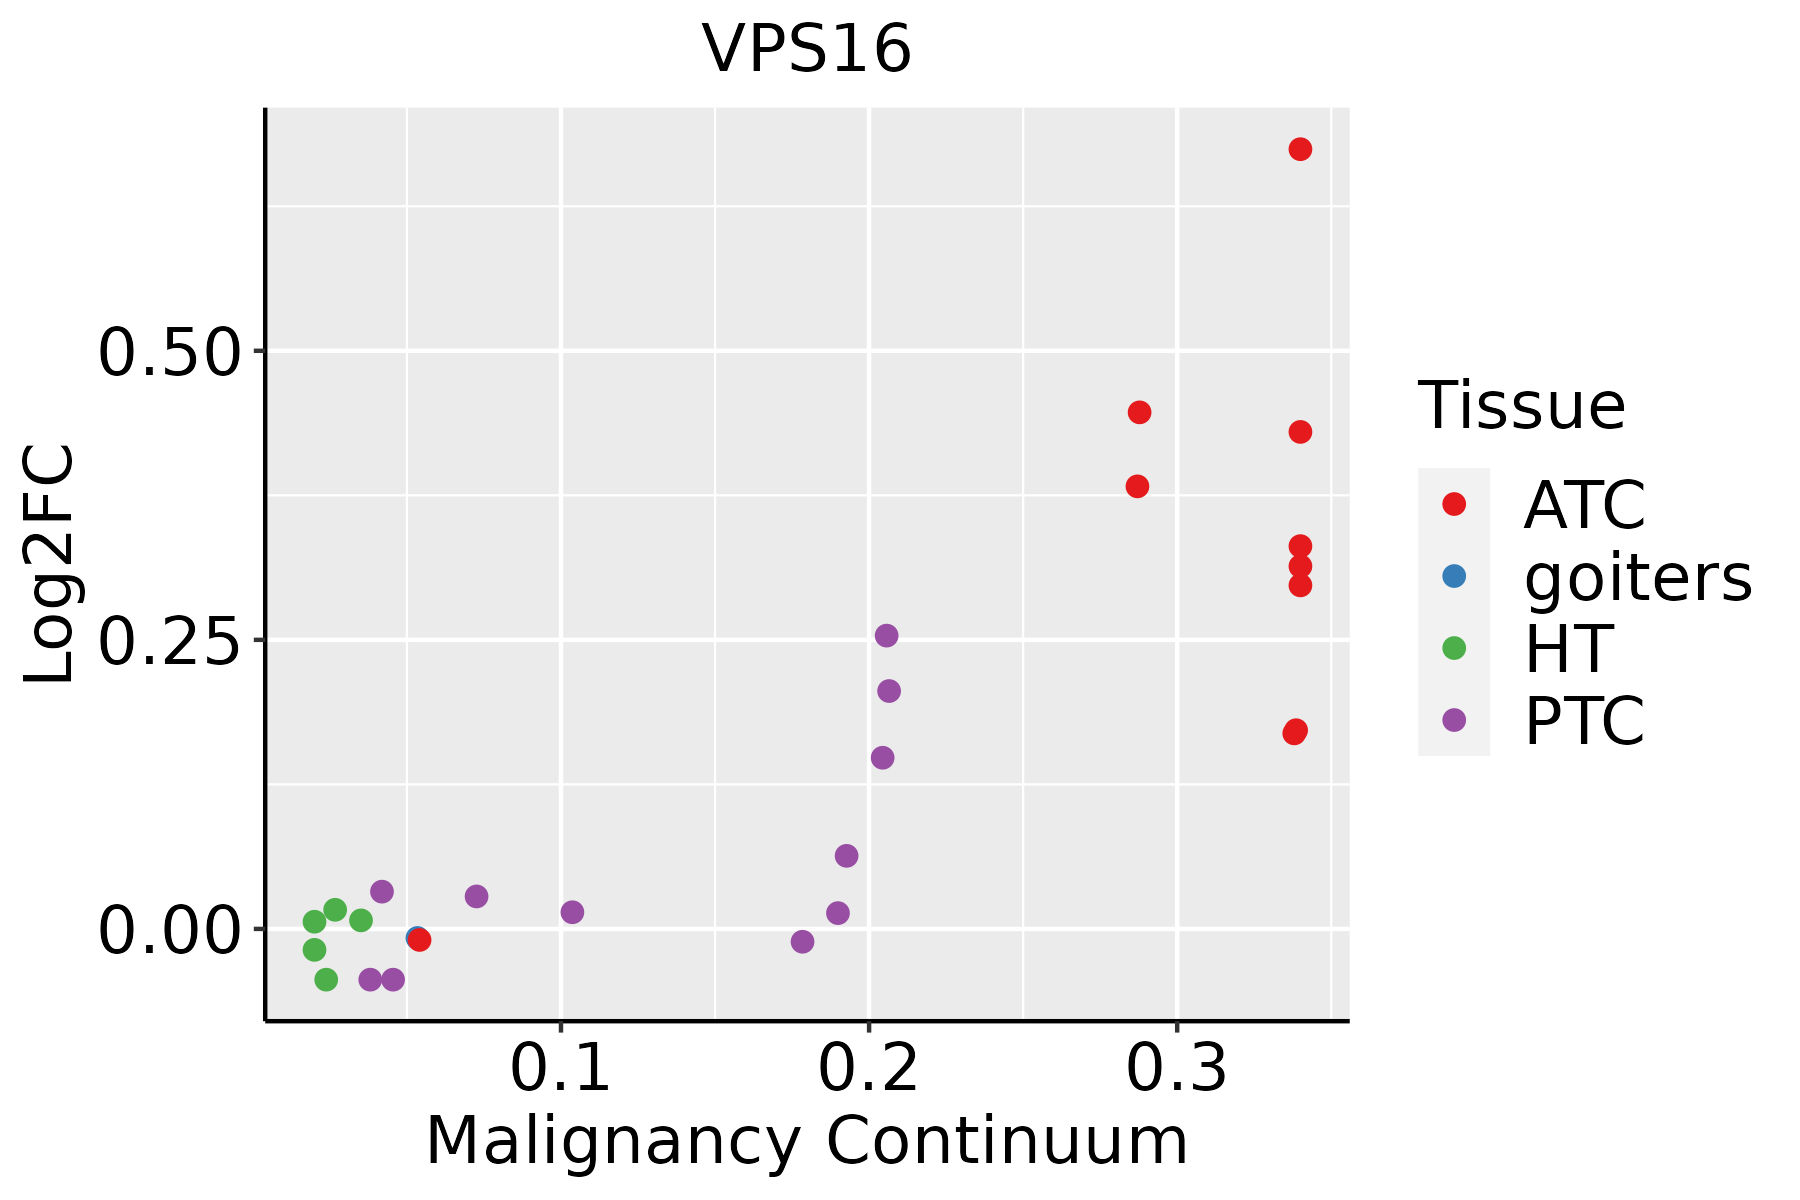 | ATC: Anaplastic thyroid cancer |
| HT: Hashimoto's thyroiditis | ||
| PTC: Papillary thyroid cancer |
| ∗log2FC in expression of this searched gene in stem-like cells from each diseased tissue sample relative to stem-like cells in normal samples in each tissue plotted against the malignancy continuum. Samples are colored based on if they are from different disease stage. |
Top |
Malignant transformation related pathway analysis |
| Find out the enriched GO biological processes and KEGG pathways involved in transition from healthy to precancer to cancer |
| Tissue | Disease Stage | Enriched GO biological Processes |
| Colorectum | AD |  |
| Colorectum | SER |  |
| Colorectum | MSS |  |
| Colorectum | MSI-H |  |
| Colorectum | FAP |  |
| ∗Top 15 enriched GO BP terms are showed in the bar plot of each disease state in each tissue. Each row represents a significant GO biological process which is colored according to the -log10(p.adjust). |
| Page: 1 2 3 4 5 6 7 8 9 |
| GO ID | Tissue | Disease Stage | Description | Gene Ratio | Bg Ratio | pvalue | p.adjust | Count |
| GO:001623617 | Esophagus | ESCC | macroautophagy | 216/8552 | 291/18723 | 1.94e-23 | 4.57e-21 | 216 |
| GO:0022411111 | Esophagus | ESCC | cellular component disassembly | 305/8552 | 443/18723 | 1.94e-23 | 4.57e-21 | 305 |
| GO:001619715 | Esophagus | ESCC | endosomal transport | 168/8552 | 230/18723 | 2.28e-17 | 1.93e-15 | 168 |
| GO:000703417 | Esophagus | ESCC | vacuolar transport | 119/8552 | 157/18723 | 1.16e-14 | 6.30e-13 | 119 |
| GO:000703314 | Esophagus | ESCC | vacuole organization | 127/8552 | 180/18723 | 1.04e-11 | 3.85e-10 | 127 |
| GO:003298416 | Esophagus | ESCC | protein-containing complex disassembly | 151/8552 | 224/18723 | 3.45e-11 | 1.15e-09 | 151 |
| GO:00070419 | Esophagus | ESCC | lysosomal transport | 83/8552 | 114/18723 | 3.52e-09 | 7.41e-08 | 83 |
| GO:00482844 | Esophagus | ESCC | organelle fusion | 94/8552 | 141/18723 | 3.72e-07 | 5.16e-06 | 94 |
| GO:00973523 | Esophagus | ESCC | autophagosome maturation | 31/8552 | 40/18723 | 4.04e-05 | 3.26e-04 | 31 |
| GO:00083333 | Esophagus | ESCC | endosome to lysosome transport | 40/8552 | 55/18723 | 4.27e-05 | 3.42e-04 | 40 |
| GO:00224117 | Liver | Cirrhotic | cellular component disassembly | 182/4634 | 443/18723 | 1.59e-14 | 1.54e-12 | 182 |
| GO:001623611 | Liver | Cirrhotic | macroautophagy | 129/4634 | 291/18723 | 1.75e-13 | 1.41e-11 | 129 |
| GO:000703411 | Liver | Cirrhotic | vacuolar transport | 75/4634 | 157/18723 | 3.13e-10 | 1.53e-08 | 75 |
| GO:00070332 | Liver | Cirrhotic | vacuole organization | 80/4634 | 180/18723 | 5.73e-09 | 2.25e-07 | 80 |
| GO:001619711 | Liver | Cirrhotic | endosomal transport | 93/4634 | 230/18723 | 1.01e-07 | 2.93e-06 | 93 |
| GO:000704111 | Liver | Cirrhotic | lysosomal transport | 50/4634 | 114/18723 | 6.15e-06 | 9.82e-05 | 50 |
| GO:00329846 | Liver | Cirrhotic | protein-containing complex disassembly | 82/4634 | 224/18723 | 4.78e-05 | 5.54e-04 | 82 |
| GO:00482842 | Liver | Cirrhotic | organelle fusion | 52/4634 | 141/18723 | 8.77e-04 | 6.31e-03 | 52 |
| GO:0008333 | Liver | Cirrhotic | endosome to lysosome transport | 24/4634 | 55/18723 | 1.67e-03 | 1.07e-02 | 24 |
| GO:0097352 | Liver | Cirrhotic | autophagosome maturation | 17/4634 | 40/18723 | 1.04e-02 | 4.61e-02 | 17 |
| Page: 1 2 3 4 |
| Pathway ID | Tissue | Disease Stage | Description | Gene Ratio | Bg Ratio | pvalue | p.adjust | qvalue | Count |
| hsa05132211 | Esophagus | ESCC | Salmonella infection | 191/4205 | 249/8465 | 6.51e-19 | 5.45e-17 | 2.79e-17 | 191 |
| hsa05132310 | Esophagus | ESCC | Salmonella infection | 191/4205 | 249/8465 | 6.51e-19 | 5.45e-17 | 2.79e-17 | 191 |
| hsa0513222 | Liver | Cirrhotic | Salmonella infection | 121/2530 | 249/8465 | 2.47e-10 | 5.13e-09 | 3.16e-09 | 121 |
| hsa0513232 | Liver | Cirrhotic | Salmonella infection | 121/2530 | 249/8465 | 2.47e-10 | 5.13e-09 | 3.16e-09 | 121 |
| hsa0513242 | Liver | HCC | Salmonella infection | 178/4020 | 249/8465 | 5.90e-15 | 1.98e-13 | 1.10e-13 | 178 |
| hsa0513252 | Liver | HCC | Salmonella infection | 178/4020 | 249/8465 | 5.90e-15 | 1.98e-13 | 1.10e-13 | 178 |
| hsa0513230 | Oral cavity | OSCC | Salmonella infection | 174/3704 | 249/8465 | 2.67e-17 | 1.49e-15 | 7.58e-16 | 174 |
| hsa05132114 | Oral cavity | OSCC | Salmonella infection | 174/3704 | 249/8465 | 2.67e-17 | 1.49e-15 | 7.58e-16 | 174 |
| hsa05132210 | Oral cavity | LP | Salmonella infection | 128/2418 | 249/8465 | 1.17e-14 | 2.79e-13 | 1.80e-13 | 128 |
| hsa0513238 | Oral cavity | LP | Salmonella infection | 128/2418 | 249/8465 | 1.17e-14 | 2.79e-13 | 1.80e-13 | 128 |
| Page: 1 |
Top |
Cell-cell communication analysis |
| Identification of potential cell-cell interactions between two cell types and their ligand-receptor pairs for different disease states |
| Ligand | Receptor | LRpair | Pathway | Tissue | Disease Stage |
| Page: 1 |
Top |
Single-cell gene regulatory network inference analysis |
| Find out the significant the regulons (TFs) and the target genes of each regulon across cell types for different disease states |
| TF | Cell Type | Tissue | Disease Stage | Target Gene | RSS | Regulon Activity |
| ∗The dot plots of a searched regulon are shown for all cell subpopulations in each disease state of each tissue based on the regulon specific score inferred using pySCENIC and by calculating the average expression. |
| Page: 1 |
Top |
Somatic mutation of malignant transformation related genes |
| Annotation of somatic variants for genes involved in malignant transformation |
| Hugo Symbol | Variant Class | Variant Classification | dbSNP RS | HGVSc | HGVSp | HGVSp Short | SWISSPROT | BIOTYPE | SIFT | PolyPhen | Tumor Sample Barcode | Tissue | Histology | Sex | Age | Stage | Therapy Types | Drugs | Outcome |
| VPS16 | SNV | Missense_Mutation | c.1382G>A | p.Arg461Lys | p.R461K | Q9H269 | protein_coding | tolerated(0.21) | benign(0.02) | TCGA-AC-A23H-01 | Breast | breast invasive carcinoma | Female | >=65 | I/II | Unknown | Unknown | PD | |
| VPS16 | insertion | Nonsense_Mutation | novel | c.941_942insATTGCCCAGGCCTTAGCTGGCGAAGTCAG | p.Asp314GlufsTer6 | p.D314Efs*6 | Q9H269 | protein_coding | TCGA-MS-A51U-01 | Breast | breast invasive carcinoma | Female | <65 | I/II | Chemotherapy | adriamycin | SD | ||
| VPS16 | SNV | Missense_Mutation | novel | c.851N>T | p.Ala284Val | p.A284V | Q9H269 | protein_coding | tolerated(0.48) | benign(0.136) | TCGA-2W-A8YY-01 | Cervix | cervical & endocervical cancer | Female | <65 | I/II | Chemotherapy | cisplatin | CR |
| VPS16 | SNV | Missense_Mutation | rs779619779 | c.1316N>T | p.Pro439Leu | p.P439L | Q9H269 | protein_coding | deleterious(0) | probably_damaging(0.97) | TCGA-2W-A8YY-01 | Cervix | cervical & endocervical cancer | Female | <65 | I/II | Chemotherapy | cisplatin | CR |
| VPS16 | SNV | Missense_Mutation | novel | c.1758N>A | p.Asn586Lys | p.N586K | Q9H269 | protein_coding | tolerated(0.39) | benign(0.038) | TCGA-C5-A8XH-01 | Cervix | cervical & endocervical cancer | Female | <65 | I/II | Unknown | Unknown | SD |
| VPS16 | SNV | Missense_Mutation | c.533C>G | p.Ser178Cys | p.S178C | Q9H269 | protein_coding | deleterious(0) | probably_damaging(0.964) | TCGA-JX-A3Q0-01 | Cervix | cervical & endocervical cancer | Female | <65 | III/IV | Unknown | Unknown | SD | |
| VPS16 | SNV | Missense_Mutation | rs774866901 | c.164N>A | p.Arg55Gln | p.R55Q | Q9H269 | protein_coding | tolerated(0.3) | benign(0.028) | TCGA-5M-AAT6-01 | Colorectum | colon adenocarcinoma | Female | <65 | III/IV | Unknown | Unknown | PD |
| VPS16 | SNV | Missense_Mutation | rs375302670 | c.1630N>T | p.Arg544Cys | p.R544C | Q9H269 | protein_coding | deleterious(0) | probably_damaging(0.949) | TCGA-A6-6780-01 | Colorectum | colon adenocarcinoma | Male | >=65 | I/II | Unknown | Unknown | SD |
| VPS16 | SNV | Missense_Mutation | rs760297252 | c.199G>A | p.Asp67Asn | p.D67N | Q9H269 | protein_coding | tolerated(0.29) | benign(0.025) | TCGA-AA-3984-01 | Colorectum | colon adenocarcinoma | Female | <65 | I/II | Unknown | Unknown | SD |
| VPS16 | SNV | Missense_Mutation | c.1879C>G | p.Gln627Glu | p.Q627E | Q9H269 | protein_coding | tolerated(0.29) | benign(0.007) | TCGA-AA-A01P-01 | Colorectum | colon adenocarcinoma | Female | >=65 | III/IV | Unknown | Unknown | PD |
| Page: 1 2 3 4 5 6 7 8 |
Top |
Related drugs of malignant transformation related genes |
| Identification of chemicals and drugs interact with genes involved in malignant transfromation |
| (DGIdb 4.0) |
| Entrez ID | Symbol | Category | Interaction Types | Drug Claim Name | Drug Name | PMIDs |
| Page: 1 |

Copyright 2023-Present -The University of Texas Health Science Center at Houston |