| Tissue | Expression Dynamics | Abbreviation |
| Cervix | 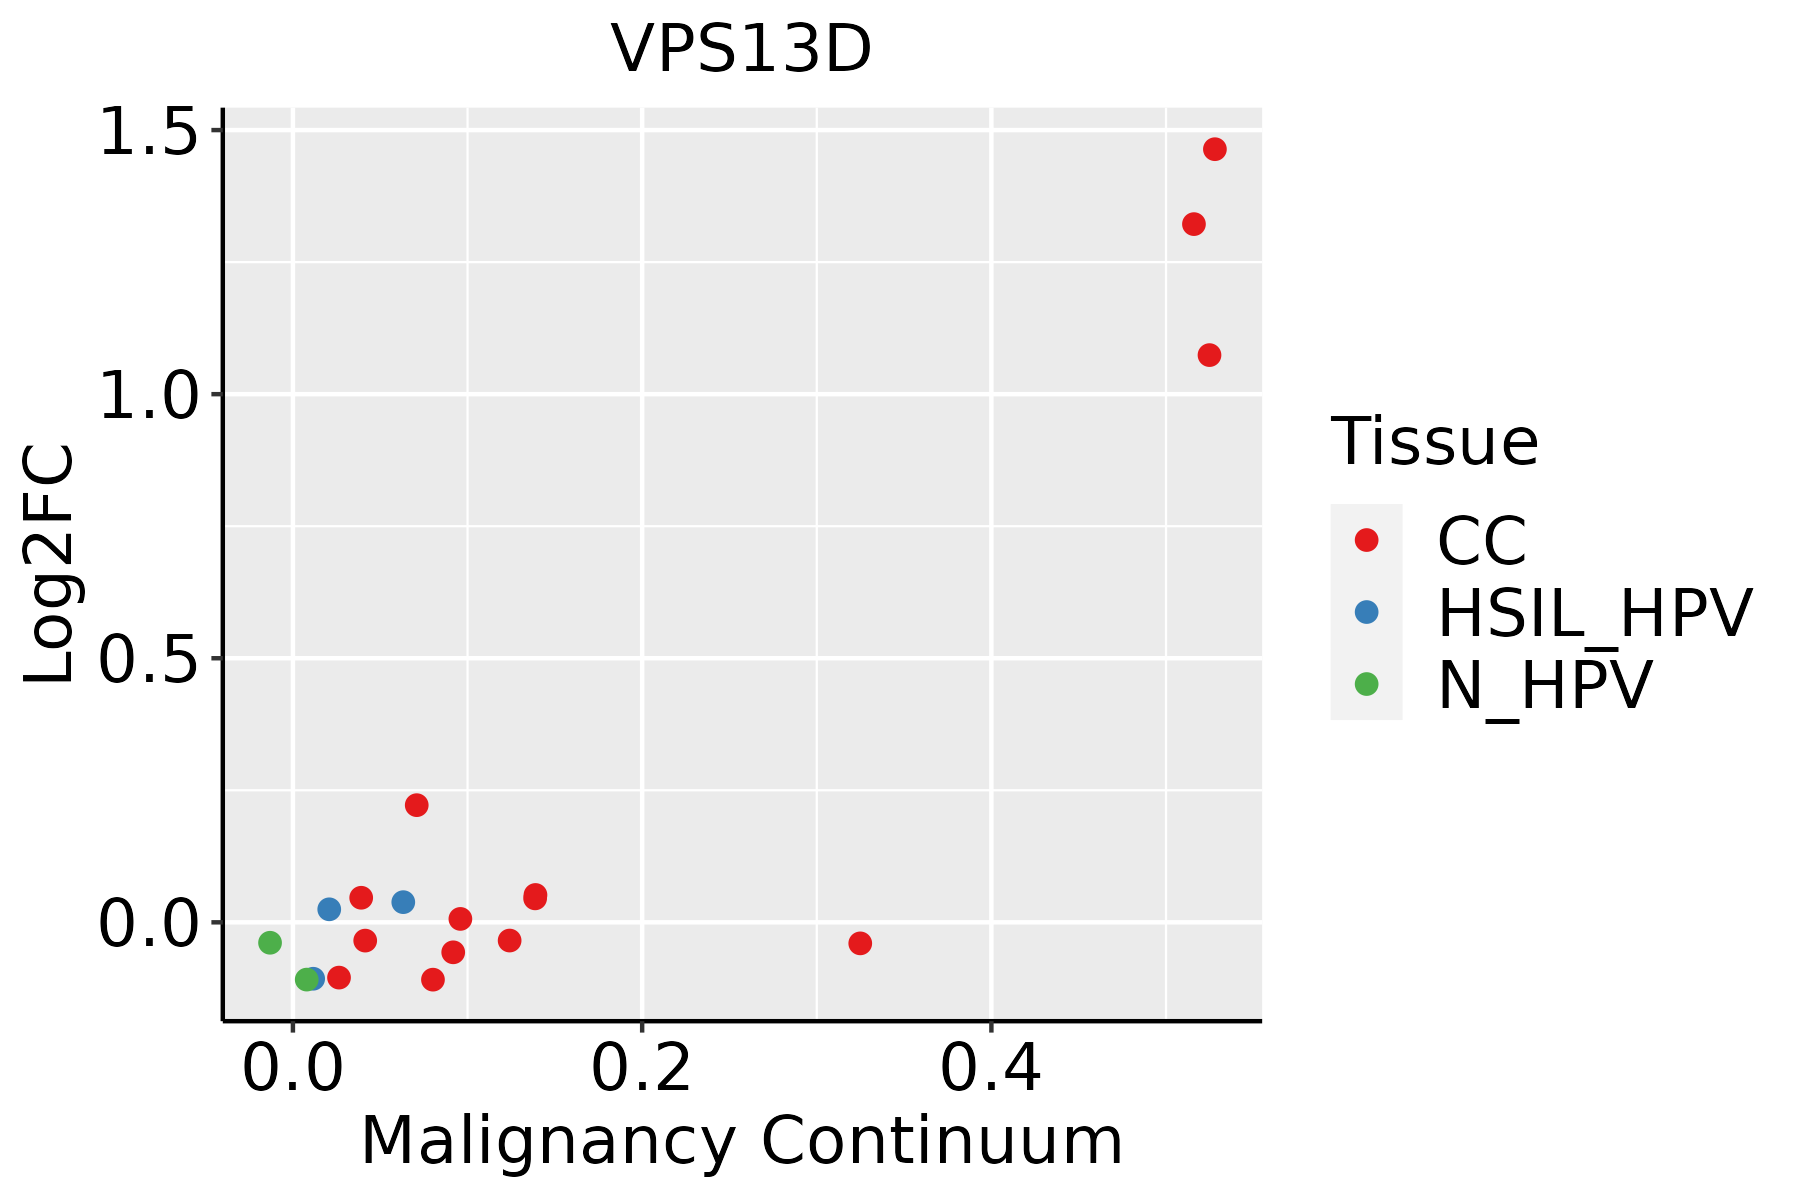 | CC: Cervix cancer |
| HSIL_HPV: HPV-infected high-grade squamous intraepithelial lesions |
| N_HPV: HPV-infected normal cervix |
| Colorectum (GSE201348) |  | FAP: Familial adenomatous polyposis |
| CRC: Colorectal cancer |
| Colorectum (HTA11) |  | AD: Adenomas |
| SER: Sessile serrated lesions |
| MSI-H: Microsatellite-high colorectal cancer |
| MSS: Microsatellite stable colorectal cancer |
| Endometrium | 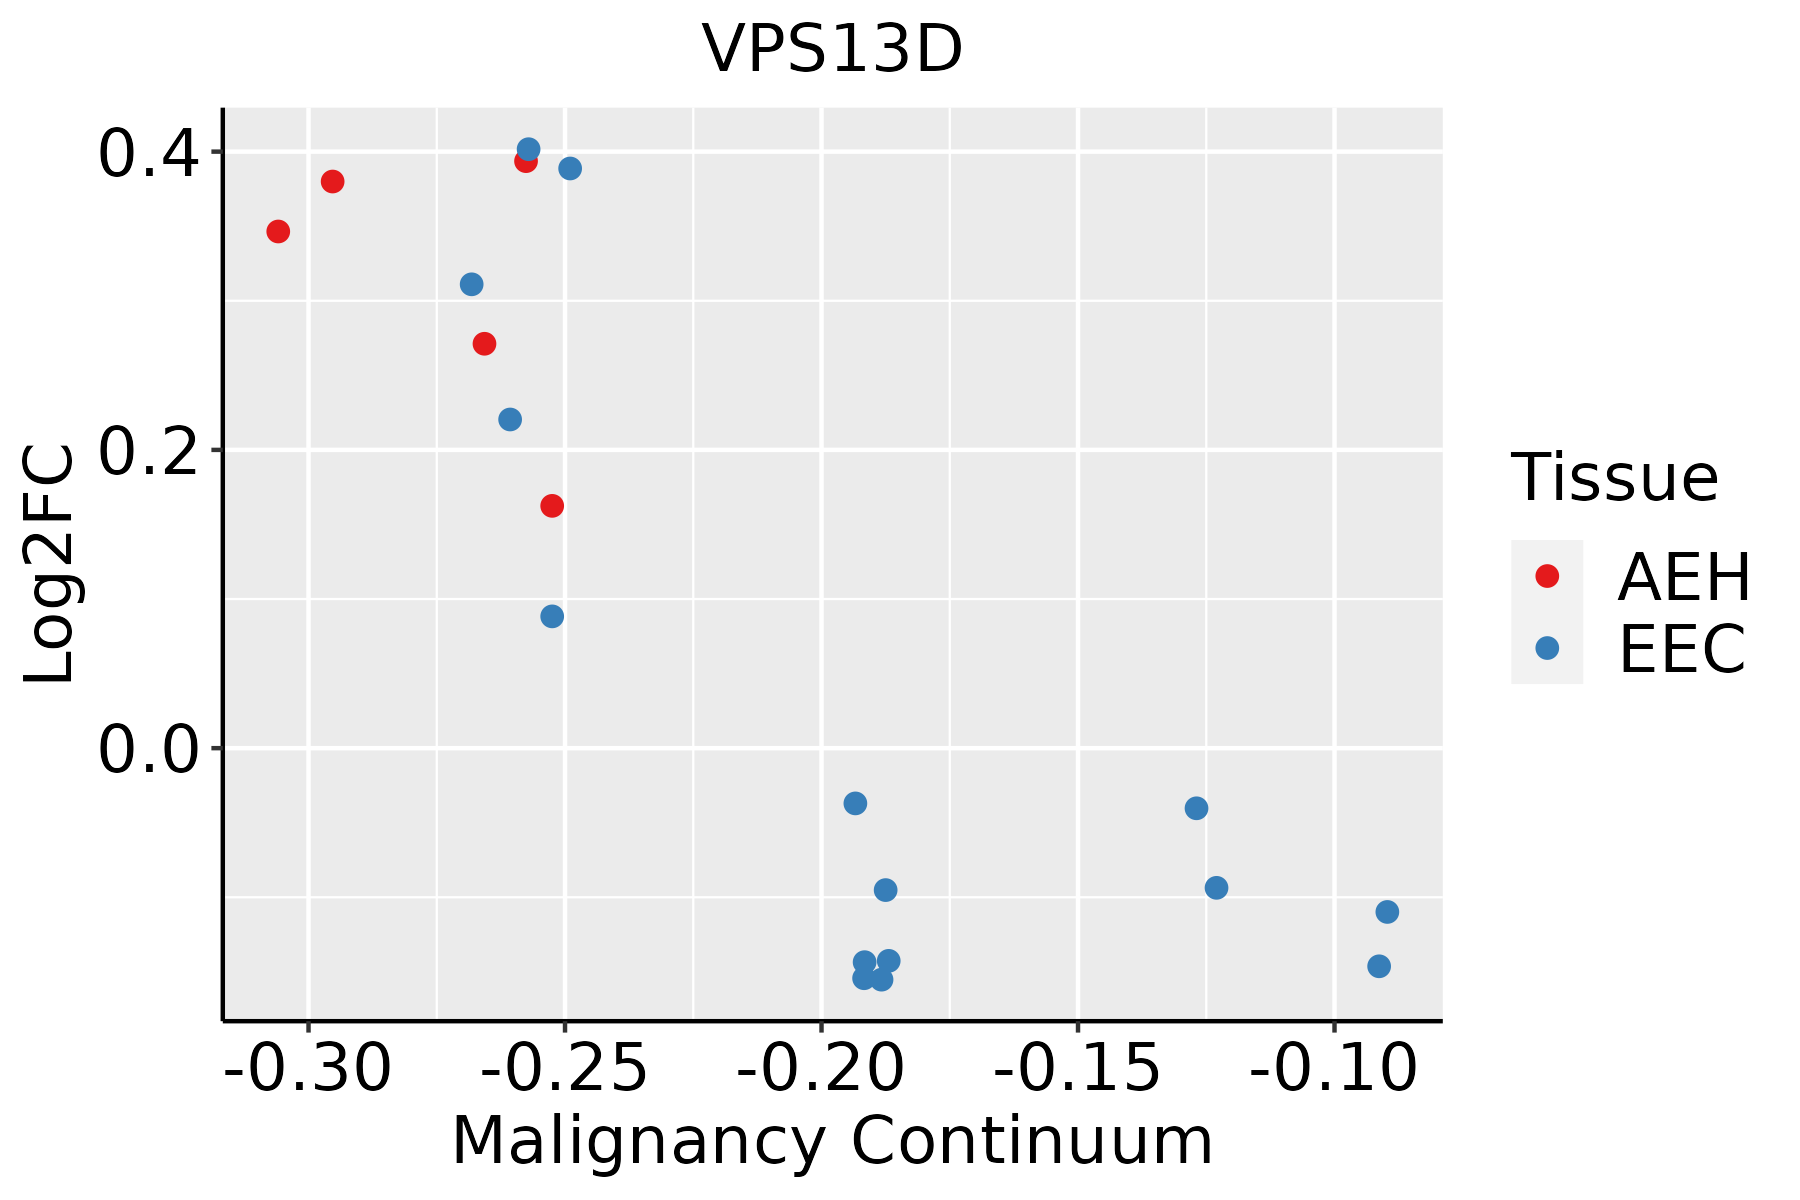 | AEH: Atypical endometrial hyperplasia |
| EEC: Endometrioid Cancer |
| Esophagus |  | ESCC: Esophageal squamous cell carcinoma |
| HGIN: High-grade intraepithelial neoplasias |
| LGIN: Low-grade intraepithelial neoplasias |
| Liver |  | HCC: Hepatocellular carcinoma |
| NAFLD: Non-alcoholic fatty liver disease |
| Lung |  | AAH: Atypical adenomatous hyperplasia |
| AIS: Adenocarcinoma in situ |
| IAC: Invasive lung adenocarcinoma |
| MIA: Minimally invasive adenocarcinoma |
| Prostate |  | BPH: Benign Prostatic Hyperplasia |
| Thyroid | 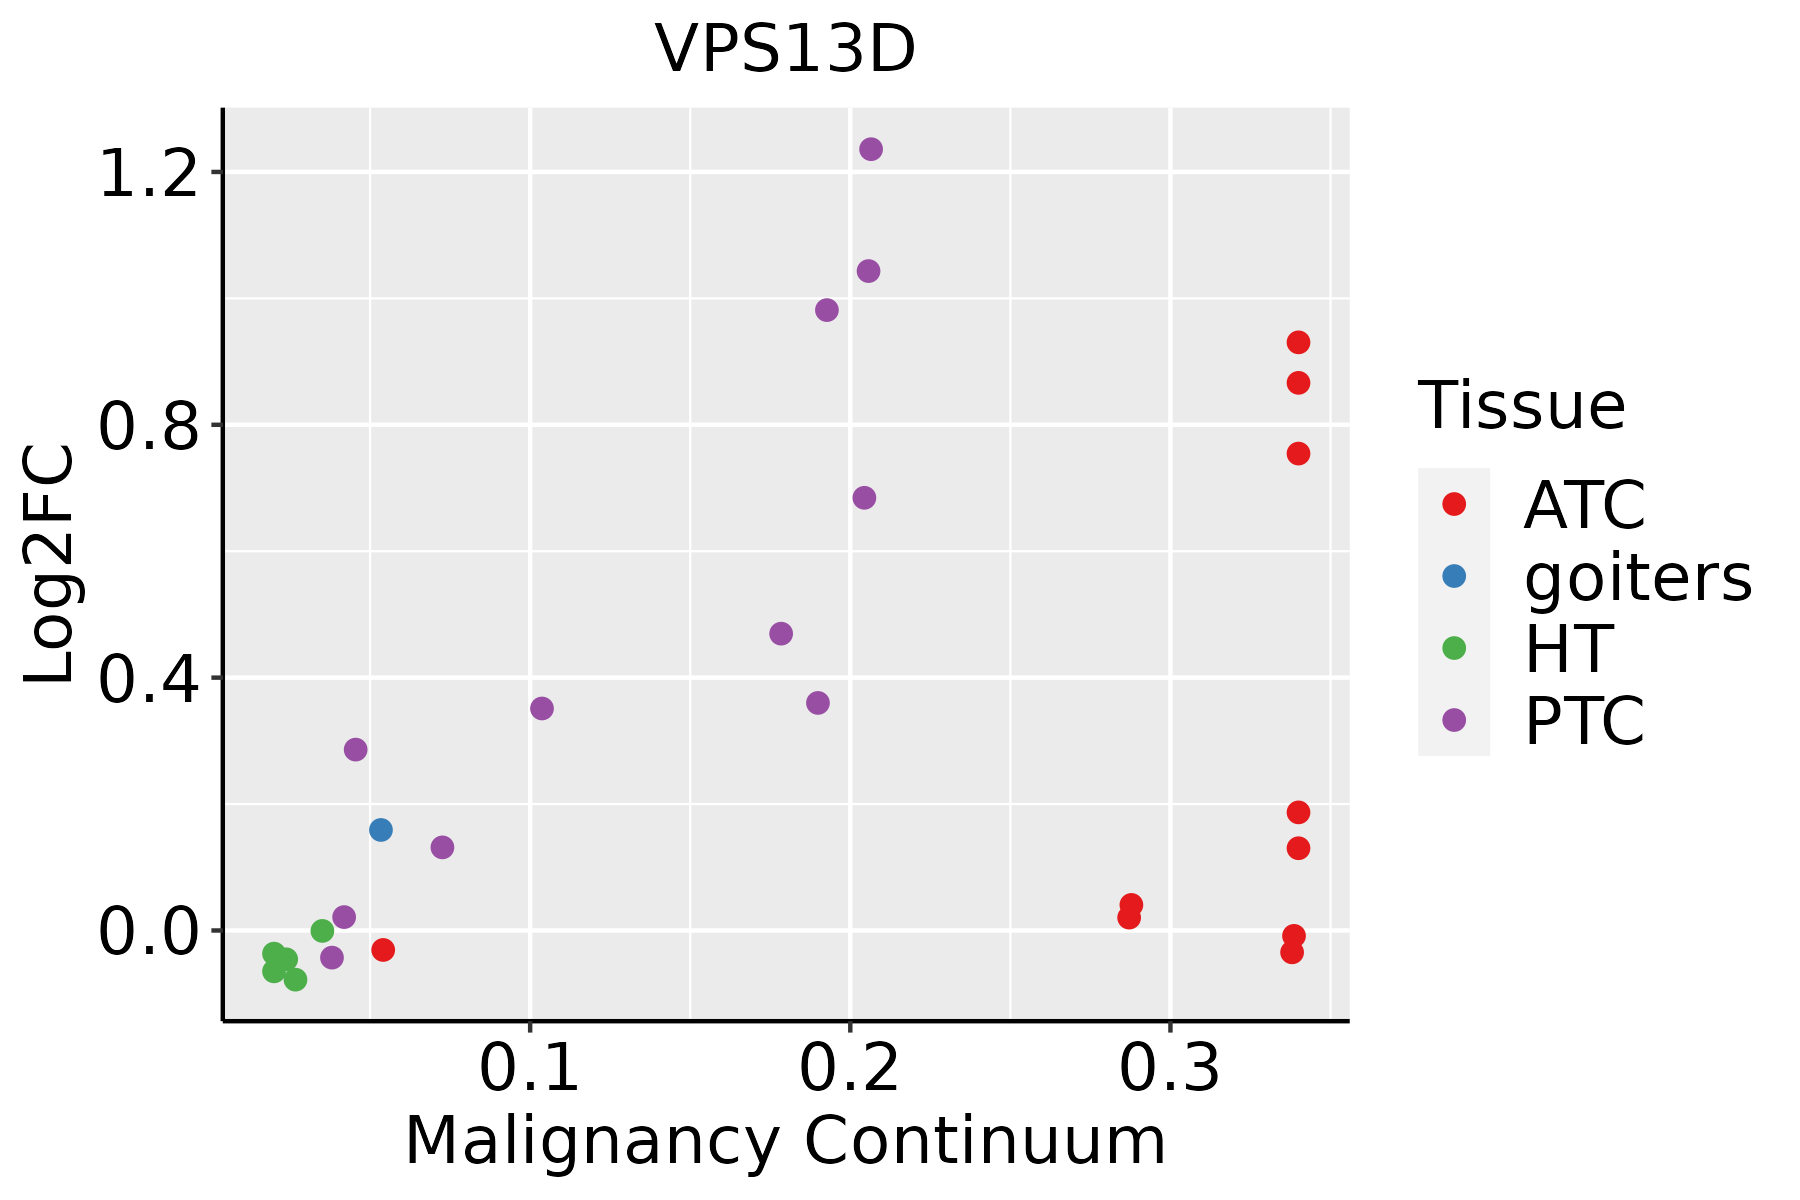 | ATC: Anaplastic thyroid cancer |
| HT: Hashimoto's thyroiditis |
| PTC: Papillary thyroid cancer |
| GO ID | Tissue | Disease Stage | Description | Gene Ratio | Bg Ratio | pvalue | p.adjust | Count |
| GO:00725949 | Cervix | CC | establishment of protein localization to organelle | 99/2311 | 422/18723 | 1.23e-10 | 2.11e-08 | 99 |
| GO:000989610 | Cervix | CC | positive regulation of catabolic process | 109/2311 | 492/18723 | 5.26e-10 | 6.99e-08 | 109 |
| GO:00512359 | Cervix | CC | maintenance of location | 78/2311 | 327/18723 | 5.18e-09 | 4.92e-07 | 78 |
| GO:005165110 | Cervix | CC | maintenance of location in cell | 55/2311 | 214/18723 | 6.63e-08 | 3.85e-06 | 55 |
| GO:003133110 | Cervix | CC | positive regulation of cellular catabolic process | 91/2311 | 427/18723 | 9.64e-08 | 5.25e-06 | 91 |
| GO:000660510 | Cervix | CC | protein targeting | 68/2311 | 314/18723 | 2.17e-06 | 6.55e-05 | 68 |
| GO:00325077 | Cervix | CC | maintenance of protein location in cell | 21/2311 | 65/18723 | 2.03e-05 | 3.71e-04 | 21 |
| GO:004518510 | Cervix | CC | maintenance of protein location | 26/2311 | 94/18723 | 4.85e-05 | 7.34e-04 | 26 |
| GO:002241110 | Cervix | CC | cellular component disassembly | 83/2311 | 443/18723 | 6.04e-05 | 8.68e-04 | 83 |
| GO:00726655 | Cervix | CC | protein localization to vacuole | 20/2311 | 67/18723 | 1.12e-04 | 1.40e-03 | 20 |
| GO:00108218 | Cervix | CC | regulation of mitochondrion organization | 34/2311 | 144/18723 | 1.27e-04 | 1.58e-03 | 34 |
| GO:00162367 | Cervix | CC | macroautophagy | 58/2311 | 291/18723 | 1.40e-04 | 1.70e-03 | 58 |
| GO:00105067 | Cervix | CC | regulation of autophagy | 61/2311 | 317/18723 | 2.61e-04 | 2.87e-03 | 61 |
| GO:00004227 | Cervix | CC | autophagy of mitochondrion | 21/2311 | 81/18723 | 6.47e-04 | 6.02e-03 | 21 |
| GO:00617267 | Cervix | CC | mitochondrion disassembly | 21/2311 | 81/18723 | 6.47e-04 | 6.02e-03 | 21 |
| GO:00070347 | Cervix | CC | vacuolar transport | 34/2311 | 157/18723 | 7.03e-04 | 6.40e-03 | 34 |
| GO:00066235 | Cervix | CC | protein targeting to vacuole | 12/2311 | 37/18723 | 1.15e-03 | 9.39e-03 | 12 |
| GO:00108224 | Cervix | CC | positive regulation of mitochondrion organization | 19/2311 | 74/18723 | 1.30e-03 | 1.03e-02 | 19 |
| GO:00726665 | Cervix | CC | establishment of protein localization to vacuole | 14/2311 | 49/18723 | 1.84e-03 | 1.37e-02 | 14 |
| GO:19031466 | Cervix | CC | regulation of autophagy of mitochondrion | 10/2311 | 33/18723 | 5.07e-03 | 3.00e-02 | 10 |
| Hugo Symbol | Variant Class | Variant Classification | dbSNP RS | HGVSc | HGVSp | HGVSp Short | SWISSPROT | BIOTYPE | SIFT | PolyPhen | Tumor Sample Barcode | Tissue | Histology | Sex | Age | Stage | Therapy Types | Drugs | Outcome |
| VPS13D | SNV | Missense_Mutation | | c.5552N>C | p.Ile1851Thr | p.I1851T | Q5THJ4 | protein_coding | tolerated(0.59) | benign(0) | TCGA-A1-A0SO-01 | Breast | breast invasive carcinoma | Female | >=65 | I/II | Chemotherapy | | SD |
| VPS13D | SNV | Missense_Mutation | | c.11399N>A | p.Ser3800Asn | p.S3800N | Q5THJ4 | protein_coding | tolerated(0.71) | benign(0) | TCGA-A2-A0CS-01 | Breast | breast invasive carcinoma | Female | >=65 | III/IV | Hormone Therapy | anastrozole | SD |
| VPS13D | SNV | Missense_Mutation | novel | c.3030N>C | p.Gln1010His | p.Q1010H | Q5THJ4 | protein_coding | deleterious(0) | probably_damaging(1) | TCGA-A7-A6VX-01 | Breast | breast invasive carcinoma | Female | >=65 | I/II | Chemotherapy | docetaxel | CR |
| VPS13D | SNV | Missense_Mutation | rs763271218 | c.7067C>T | p.Thr2356Met | p.T2356M | Q5THJ4 | protein_coding | tolerated(0.08) | benign(0.322) | TCGA-A8-A08P-01 | Breast | breast invasive carcinoma | Female | >=65 | III/IV | Chemotherapy | 5-fluorouracil | CR |
| VPS13D | SNV | Missense_Mutation | | c.9985G>C | p.Glu3329Gln | p.E3329Q | Q5THJ4 | protein_coding | deleterious(0) | probably_damaging(0.998) | TCGA-AC-A23H-01 | Breast | breast invasive carcinoma | Female | >=65 | I/II | Unknown | Unknown | PD |
| VPS13D | SNV | Missense_Mutation | rs771180052 | c.3561G>T | p.Glu1187Asp | p.E1187D | Q5THJ4 | protein_coding | tolerated(0.17) | benign(0.007) | TCGA-AN-A046-01 | Breast | breast invasive carcinoma | Female | >=65 | I/II | Unknown | Unknown | SD |
| VPS13D | SNV | Missense_Mutation | novel | c.4298C>A | p.Ser1433Tyr | p.S1433Y | Q5THJ4 | protein_coding | deleterious(0) | probably_damaging(0.981) | TCGA-AN-A046-01 | Breast | breast invasive carcinoma | Female | >=65 | I/II | Unknown | Unknown | SD |
| VPS13D | SNV | Missense_Mutation | | c.5452N>A | p.Asp1818Asn | p.D1818N | Q5THJ4 | protein_coding | deleterious(0) | probably_damaging(0.968) | TCGA-AO-A128-01 | Breast | breast invasive carcinoma | Female | <65 | I/II | Chemotherapy | doxorubicin | SD |
| VPS13D | SNV | Missense_Mutation | | c.8179G>C | p.Ala2727Pro | p.A2727P | Q5THJ4 | protein_coding | deleterious(0.02) | probably_damaging(0.972) | TCGA-AR-A24P-01 | Breast | breast invasive carcinoma | Female | <65 | I/II | Unknown | Unknown | SD |
| VPS13D | SNV | Missense_Mutation | rs775755003 | c.913N>G | p.Trp305Gly | p.W305G | Q5THJ4 | protein_coding | tolerated(0.17) | benign(0.169) | TCGA-BH-A0AW-01 | Breast | breast invasive carcinoma | Female | <65 | I/II | Chemotherapy | carboplatin | SD |


