
|
|||||
|
 | |
| |
| |
| |
| |
| |
|
Gene: VPS13B |
Gene summary for VPS13B |
| Gene information | Species | Human | Gene symbol | VPS13B | Gene ID | 157680 |
| Gene name | vacuolar protein sorting 13 homolog B | |
| Gene Alias | CHS1 | |
| Cytomap | 8q22.2 | |
| Gene Type | protein-coding | GO ID | GO:0006810 | UniProtAcc | Q7Z7G8 |
Top |
Malignant transformation analysis |
| Identification of the aberrant gene expression in precancerous and cancerous lesions by comparing the gene expression of stem-like cells in diseased tissues with normal stem cells |
| Entrez ID | Symbol | Replicates | Species | Organ | Tissue | Adj P-value | Log2FC | Malignancy |
| 157680 | VPS13B | CCI_1 | Human | Cervix | CC | 4.83e-17 | 1.07e+00 | 0.528 |
| 157680 | VPS13B | CCI_2 | Human | Cervix | CC | 1.55e-16 | 1.71e+00 | 0.5249 |
| 157680 | VPS13B | CCI_3 | Human | Cervix | CC | 4.46e-22 | 1.21e+00 | 0.516 |
| 157680 | VPS13B | CCII_1 | Human | Cervix | CC | 2.08e-06 | 2.63e-01 | 0.3249 |
| 157680 | VPS13B | HTA11_3410_2000001011 | Human | Colorectum | AD | 3.11e-29 | -7.81e-01 | 0.0155 |
| 157680 | VPS13B | HTA11_2487_2000001011 | Human | Colorectum | SER | 7.02e-05 | -4.67e-01 | -0.1808 |
| 157680 | VPS13B | HTA11_2951_2000001011 | Human | Colorectum | AD | 1.18e-06 | -7.96e-01 | 0.0216 |
| 157680 | VPS13B | HTA11_3361_2000001011 | Human | Colorectum | AD | 1.25e-06 | -6.06e-01 | -0.1207 |
| 157680 | VPS13B | HTA11_83_2000001011 | Human | Colorectum | SER | 1.26e-03 | -4.72e-01 | -0.1526 |
| 157680 | VPS13B | HTA11_696_2000001011 | Human | Colorectum | AD | 4.00e-15 | -4.62e-01 | -0.1464 |
| 157680 | VPS13B | HTA11_866_2000001011 | Human | Colorectum | AD | 1.18e-06 | -3.76e-01 | -0.1001 |
| 157680 | VPS13B | HTA11_5212_2000001011 | Human | Colorectum | AD | 3.27e-06 | -7.65e-01 | -0.2061 |
| 157680 | VPS13B | HTA11_9341_2000001011 | Human | Colorectum | SER | 4.87e-02 | -6.30e-01 | -0.00410000000000005 |
| 157680 | VPS13B | HTA11_7862_2000001011 | Human | Colorectum | AD | 1.64e-05 | -6.34e-01 | -0.0179 |
| 157680 | VPS13B | HTA11_866_3004761011 | Human | Colorectum | AD | 3.88e-17 | -6.00e-01 | 0.096 |
| 157680 | VPS13B | HTA11_4255_2000001011 | Human | Colorectum | SER | 1.69e-07 | -6.99e-01 | 0.0446 |
| 157680 | VPS13B | HTA11_9408_2000001011 | Human | Colorectum | AD | 3.82e-04 | -7.94e-01 | 0.0451 |
| 157680 | VPS13B | HTA11_8622_2000001021 | Human | Colorectum | SER | 1.17e-04 | -6.84e-01 | 0.0528 |
| 157680 | VPS13B | HTA11_6801_2000001011 | Human | Colorectum | SER | 9.80e-03 | -7.65e-01 | 0.0171 |
| 157680 | VPS13B | HTA11_10711_2000001011 | Human | Colorectum | AD | 2.22e-04 | -4.59e-01 | 0.0338 |
| Page: 1 2 3 4 5 6 7 8 9 10 11 |
| Tissue | Expression Dynamics | Abbreviation |
| Cervix |  | CC: Cervix cancer |
| HSIL_HPV: HPV-infected high-grade squamous intraepithelial lesions | ||
| N_HPV: HPV-infected normal cervix | ||
| Colorectum (GSE201348) |  | FAP: Familial adenomatous polyposis |
| CRC: Colorectal cancer | ||
| Colorectum (HTA11) |  | AD: Adenomas |
| SER: Sessile serrated lesions | ||
| MSI-H: Microsatellite-high colorectal cancer | ||
| MSS: Microsatellite stable colorectal cancer | ||
| Endometrium |  | AEH: Atypical endometrial hyperplasia |
| EEC: Endometrioid Cancer | ||
| Esophagus | 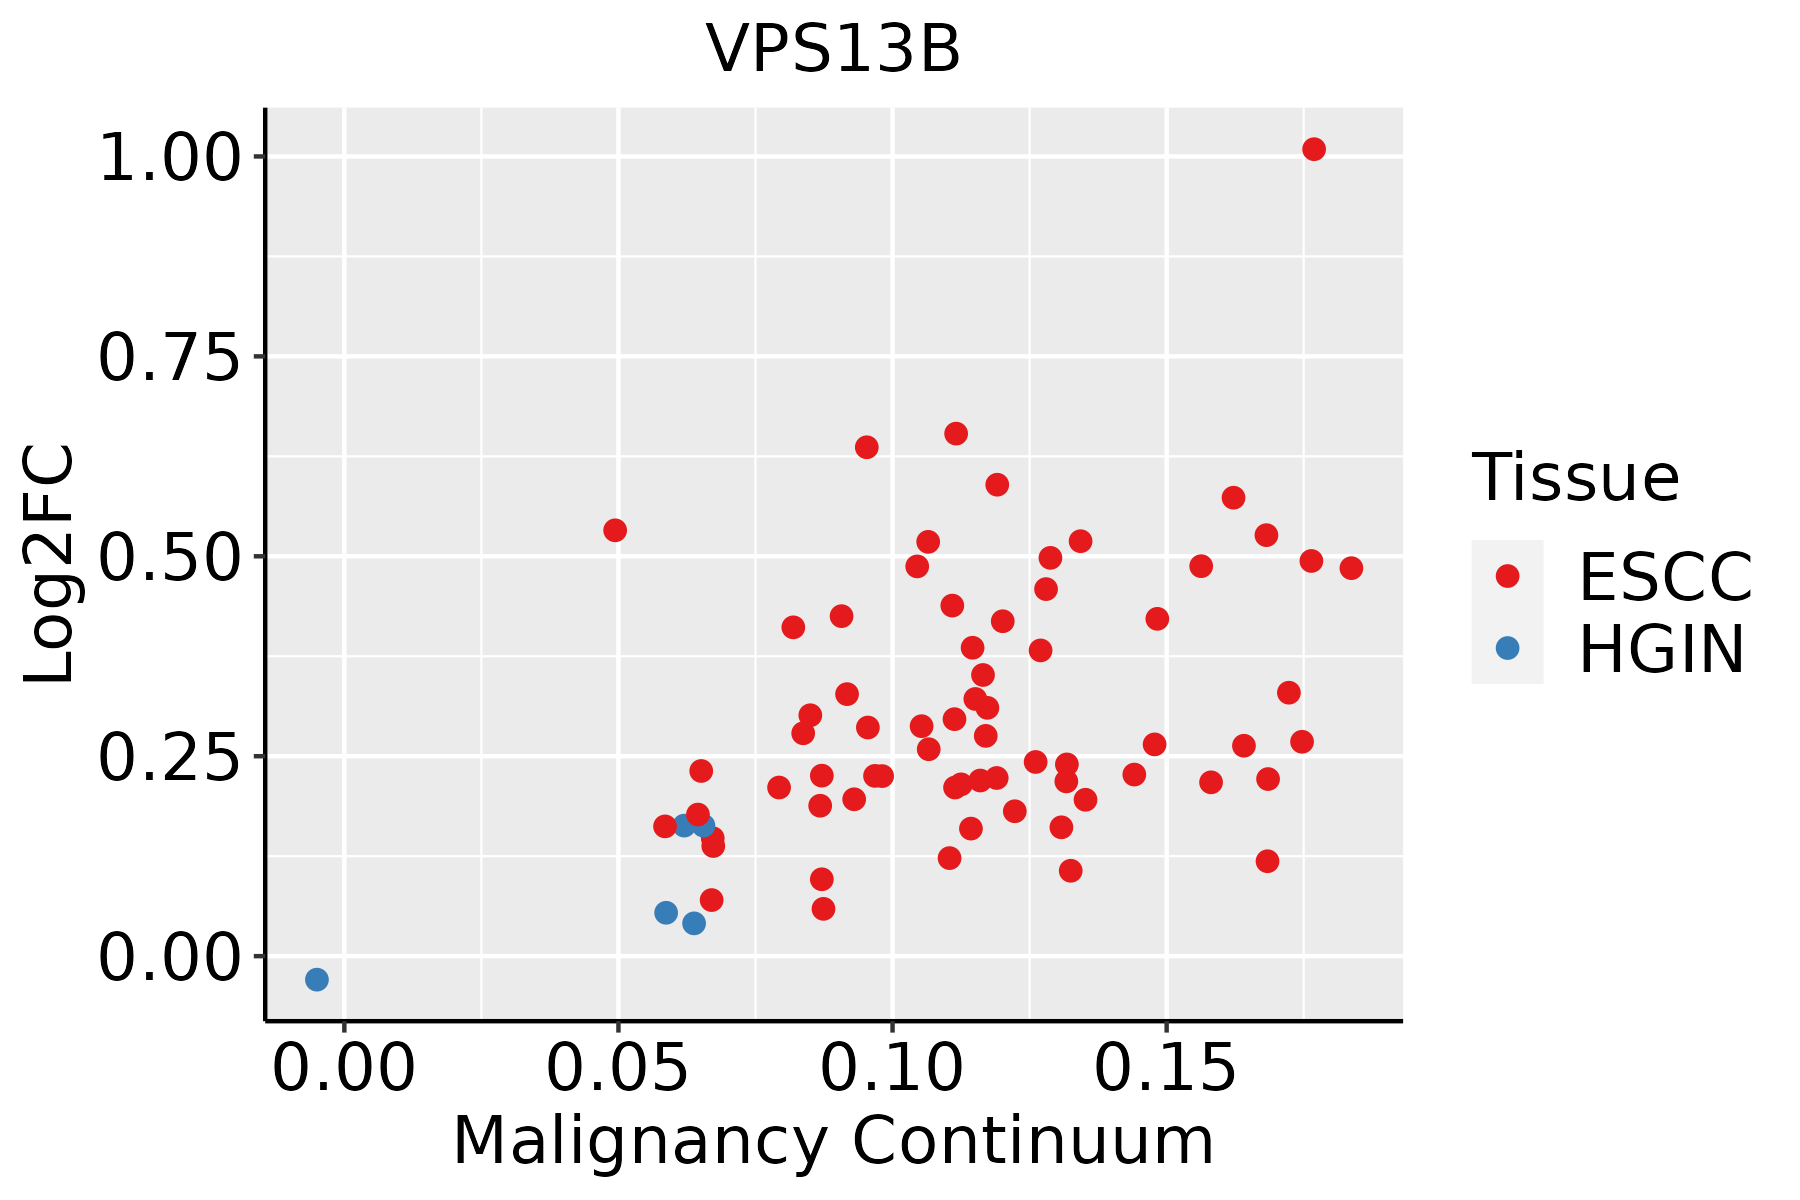 | ESCC: Esophageal squamous cell carcinoma |
| HGIN: High-grade intraepithelial neoplasias | ||
| LGIN: Low-grade intraepithelial neoplasias | ||
| Liver |  | HCC: Hepatocellular carcinoma |
| NAFLD: Non-alcoholic fatty liver disease | ||
| Lung | 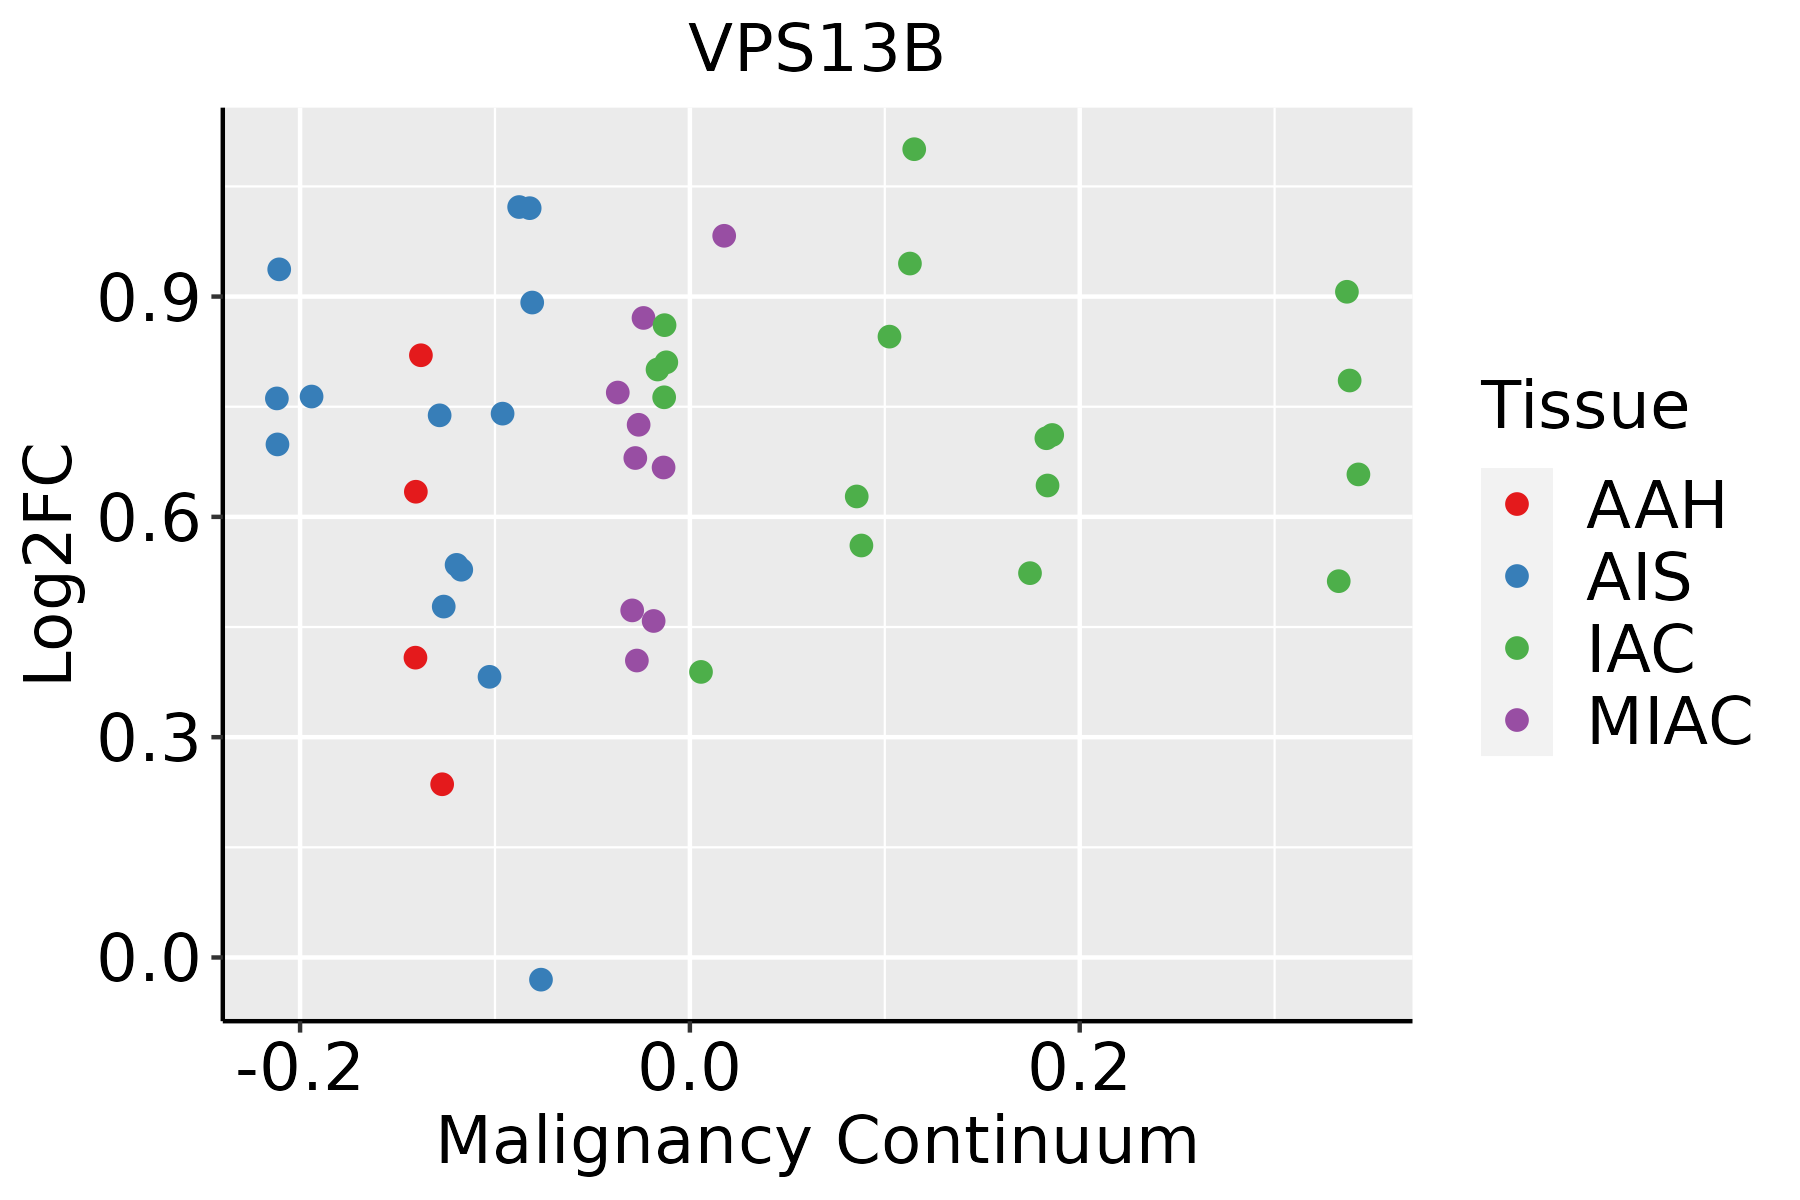 | AAH: Atypical adenomatous hyperplasia |
| AIS: Adenocarcinoma in situ | ||
| IAC: Invasive lung adenocarcinoma | ||
| MIA: Minimally invasive adenocarcinoma | ||
| Oral Cavity | 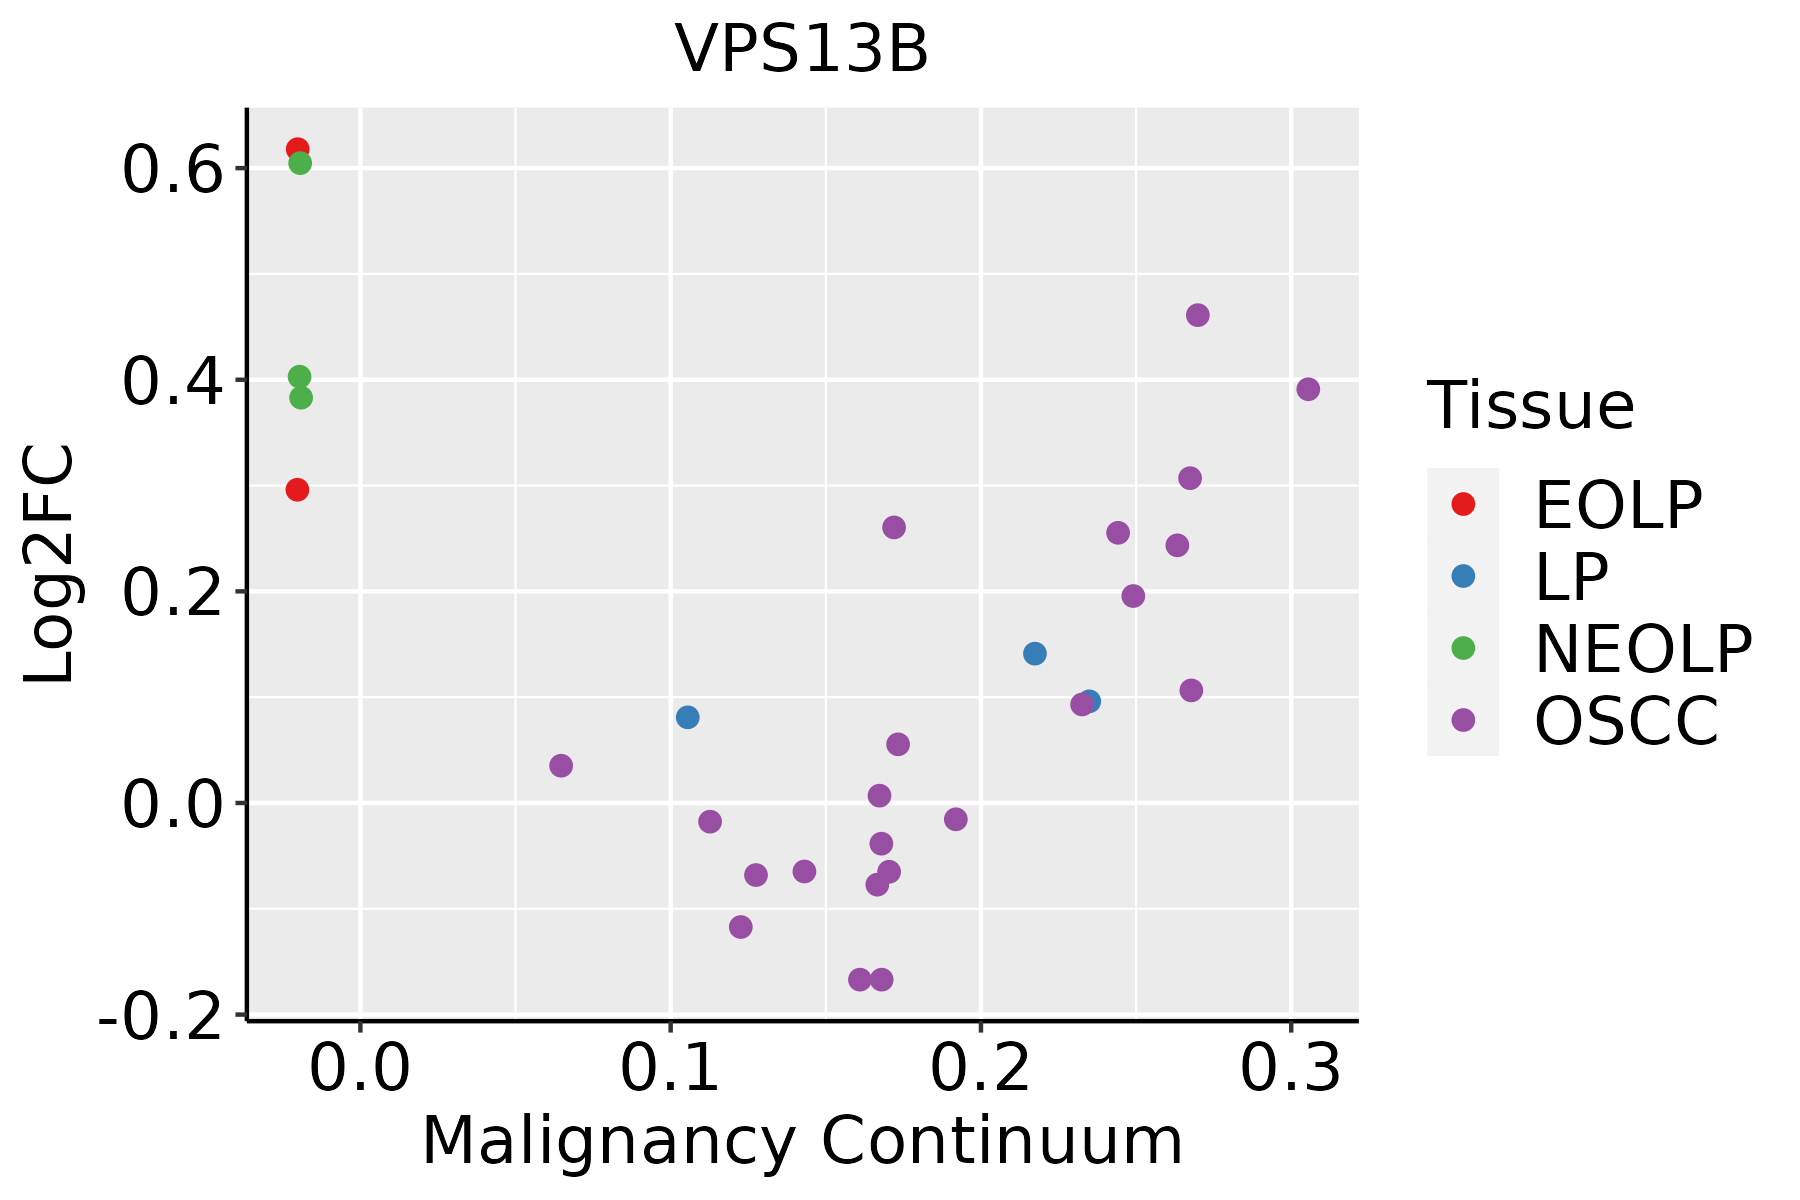 | EOLP: Erosive Oral lichen planus |
| LP: leukoplakia | ||
| NEOLP: Non-erosive oral lichen planus | ||
| OSCC: Oral squamous cell carcinoma | ||
| Prostate | 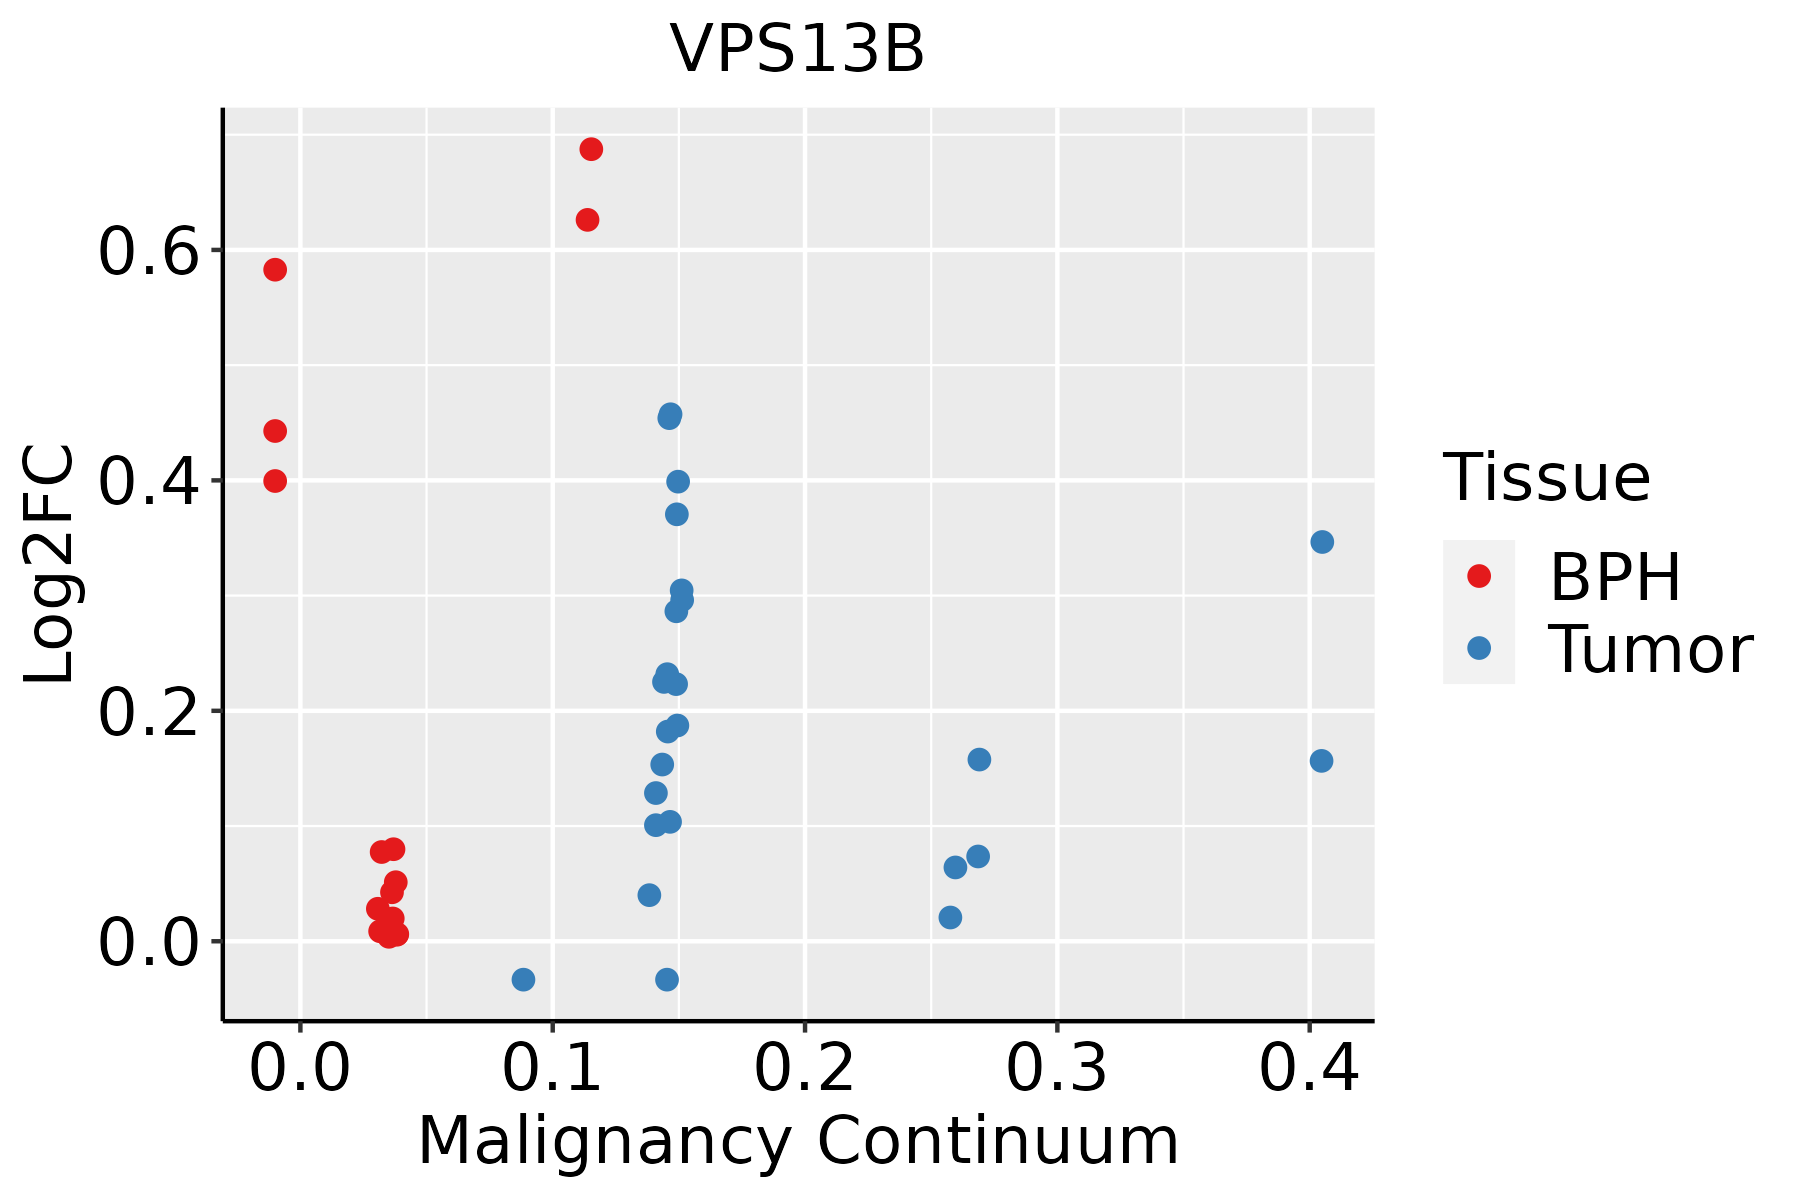 | BPH: Benign Prostatic Hyperplasia |
| Skin | 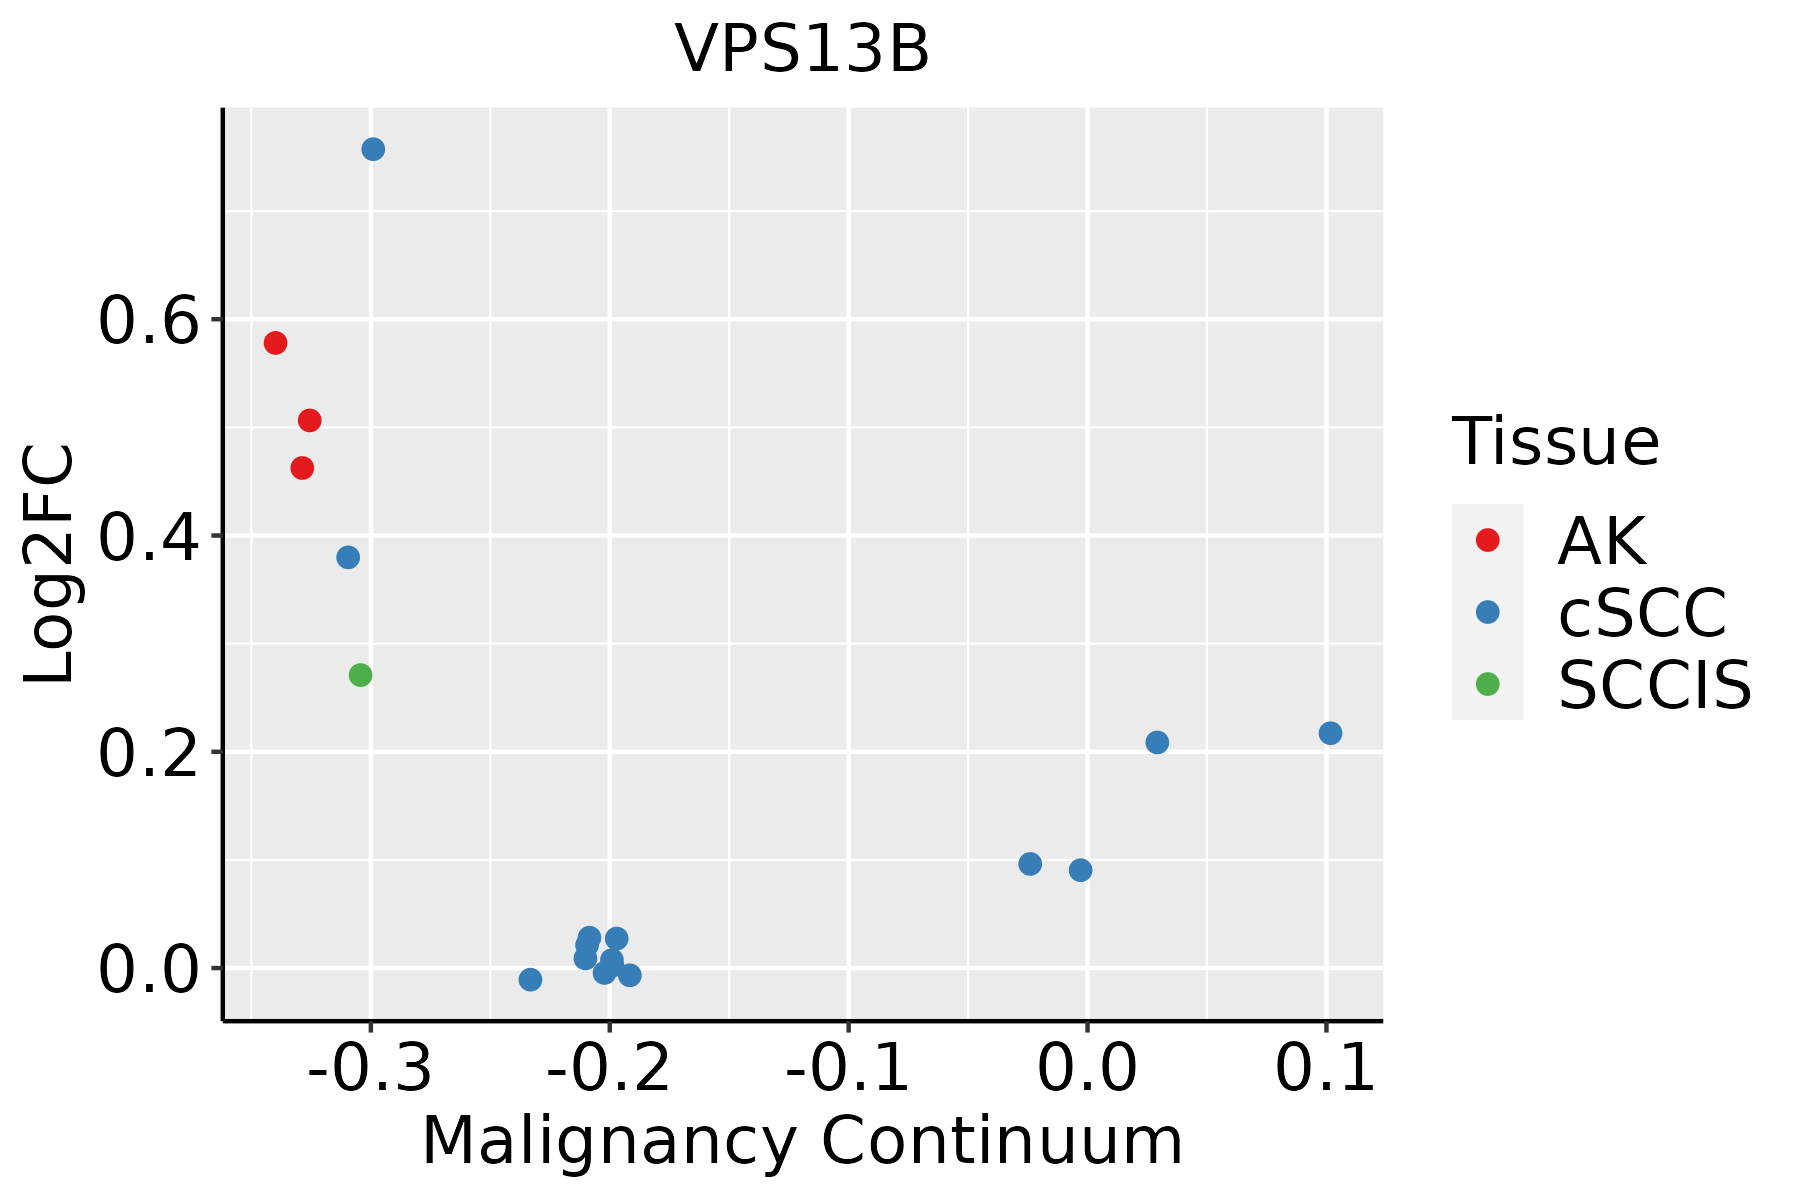 | AK: Actinic keratosis |
| cSCC: Cutaneous squamous cell carcinoma | ||
| SCCIS:squamous cell carcinoma in situ | ||
| Thyroid | 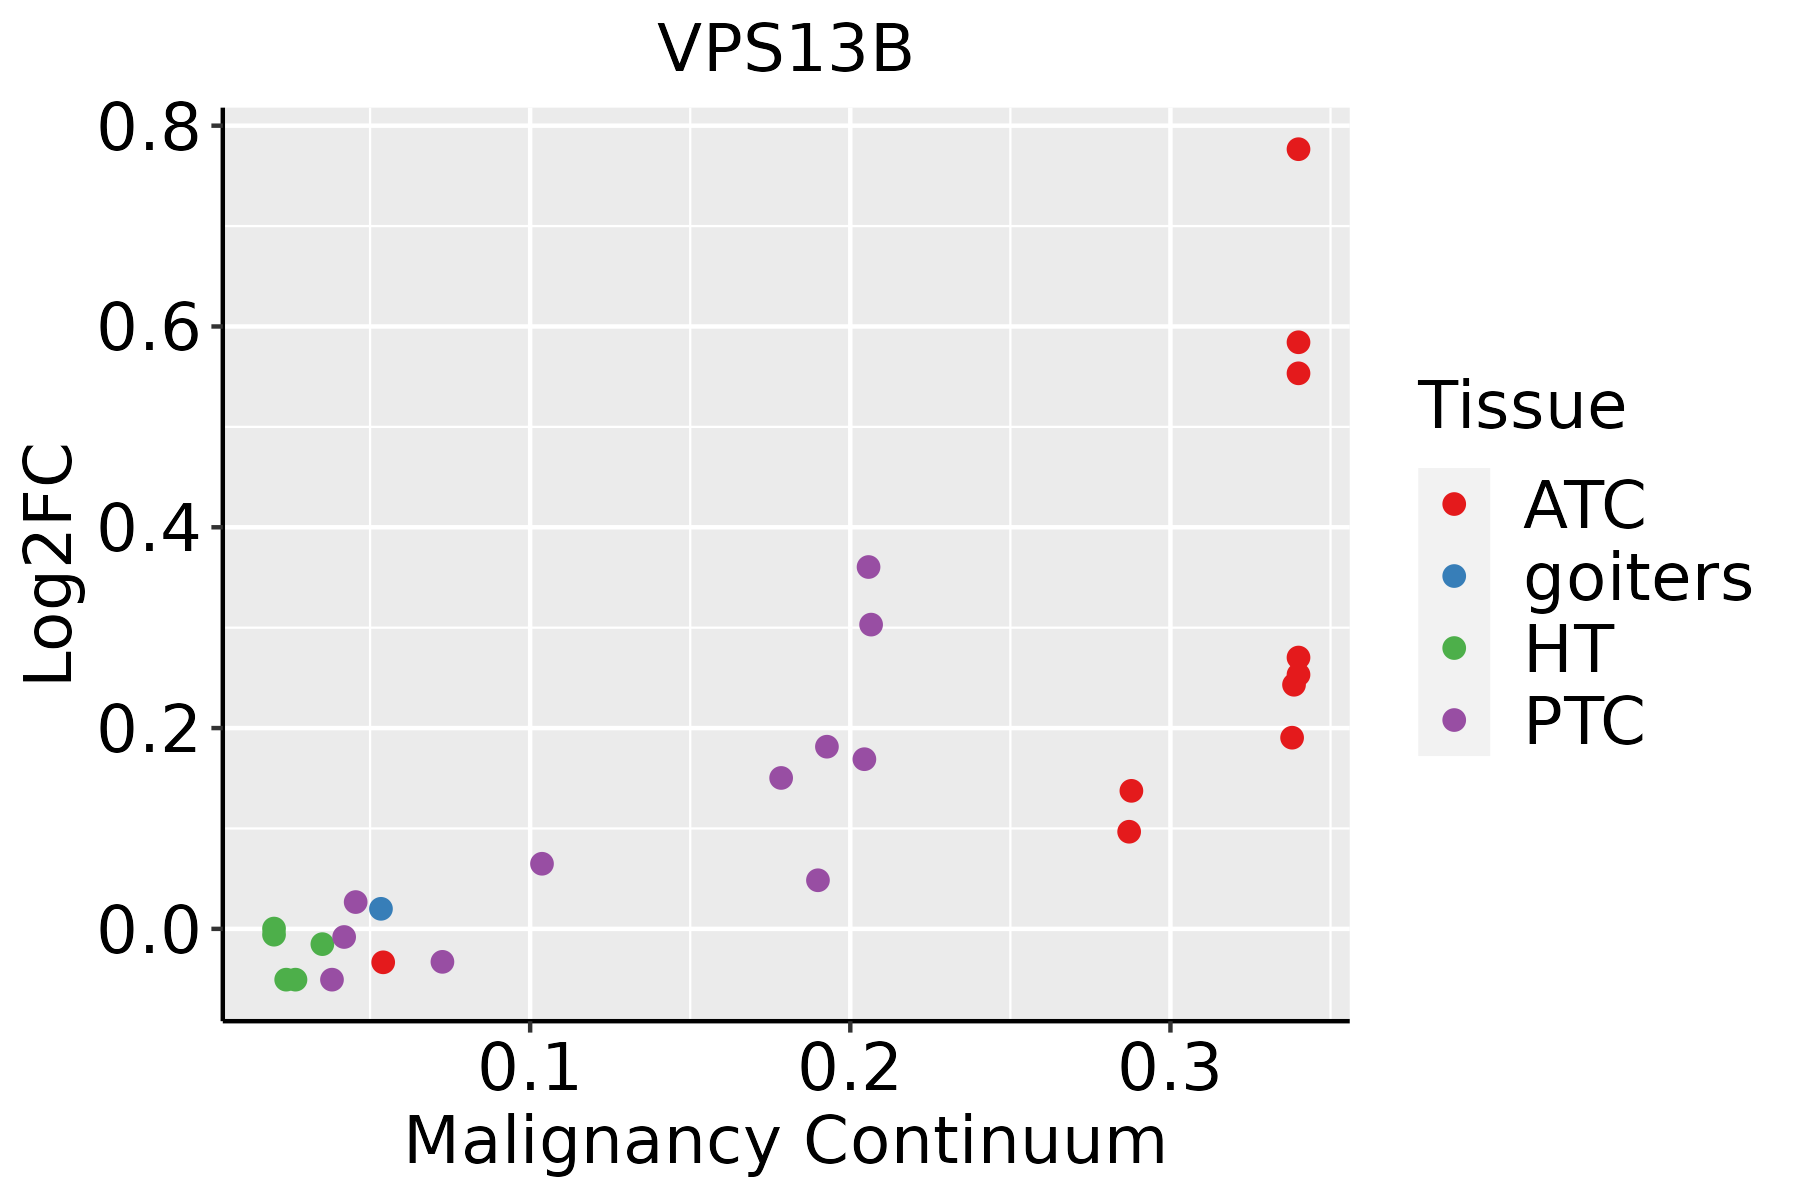 | ATC: Anaplastic thyroid cancer |
| HT: Hashimoto's thyroiditis | ||
| PTC: Papillary thyroid cancer |
| ∗log2FC in expression of this searched gene in stem-like cells from each diseased tissue sample relative to stem-like cells in normal samples in each tissue plotted against the malignancy continuum. Samples are colored based on if they are from different disease stage. |
Top |
Malignant transformation related pathway analysis |
| Find out the enriched GO biological processes and KEGG pathways involved in transition from healthy to precancer to cancer |
| Tissue | Disease Stage | Enriched GO biological Processes |
| Colorectum | AD |  |
| Colorectum | SER |  |
| Colorectum | MSS |  |
| Colorectum | MSI-H |  |
| Colorectum | FAP |  |
| ∗Top 15 enriched GO BP terms are showed in the bar plot of each disease state in each tissue. Each row represents a significant GO biological process which is colored according to the -log10(p.adjust). |
| Page: 1 2 3 4 5 6 7 8 9 |
| GO ID | Tissue | Disease Stage | Description | Gene Ratio | Bg Ratio | pvalue | p.adjust | Count |
| Page: 1 |
| Pathway ID | Tissue | Disease Stage | Description | Gene Ratio | Bg Ratio | pvalue | p.adjust | qvalue | Count |
| Page: 1 |
Top |
Cell-cell communication analysis |
| Identification of potential cell-cell interactions between two cell types and their ligand-receptor pairs for different disease states |
| Ligand | Receptor | LRpair | Pathway | Tissue | Disease Stage |
| Page: 1 |
Top |
Single-cell gene regulatory network inference analysis |
| Find out the significant the regulons (TFs) and the target genes of each regulon across cell types for different disease states |
| TF | Cell Type | Tissue | Disease Stage | Target Gene | RSS | Regulon Activity |
| ∗The dot plots of a searched regulon are shown for all cell subpopulations in each disease state of each tissue based on the regulon specific score inferred using pySCENIC and by calculating the average expression. |
| Page: 1 |
Top |
Somatic mutation of malignant transformation related genes |
| Annotation of somatic variants for genes involved in malignant transformation |
| Hugo Symbol | Variant Class | Variant Classification | dbSNP RS | HGVSc | HGVSp | HGVSp Short | SWISSPROT | BIOTYPE | SIFT | PolyPhen | Tumor Sample Barcode | Tissue | Histology | Sex | Age | Stage | Therapy Types | Drugs | Outcome |
| VPS13B | SNV | Missense_Mutation | novel | c.7161N>C | p.Gln2387His | p.Q2387H | Q7Z7G8 | protein_coding | tolerated(0.06) | possibly_damaging(0.594) | TCGA-5L-AAT1-01 | Breast | breast invasive carcinoma | Female | <65 | III/IV | Hormone Therapy | letrozol | SD |
| VPS13B | SNV | Missense_Mutation | c.2210N>C | p.Ile737Thr | p.I737T | Q7Z7G8 | protein_coding | deleterious(0) | benign(0.073) | TCGA-A2-A0YT-01 | Breast | breast invasive carcinoma | Female | <65 | III/IV | Hormone Therapy | arimidex | SD | |
| VPS13B | SNV | Missense_Mutation | rs141694201 | c.2518N>A | p.Val840Met | p.V840M | Q7Z7G8 | protein_coding | deleterious_low_confidence(0.01) | possibly_damaging(0.853) | TCGA-A8-A079-01 | Breast | breast invasive carcinoma | Female | >=65 | III/IV | Chemotherapy | 5-fluorouracil | SD |
| VPS13B | SNV | Missense_Mutation | c.2161C>A | p.Pro721Thr | p.P721T | Q7Z7G8 | protein_coding | deleterious(0.01) | possibly_damaging(0.573) | TCGA-A8-A09A-01 | Breast | breast invasive carcinoma | Female | <65 | I/II | Hormone Therapy | tamoxiphen | SD | |
| VPS13B | SNV | Missense_Mutation | c.8117N>T | p.Gly2706Val | p.G2706V | Q7Z7G8 | protein_coding | deleterious(0.02) | probably_damaging(1) | TCGA-A8-A09B-01 | Breast | breast invasive carcinoma | Female | <65 | III/IV | Chemotherapy | 5-fluorouracil | SD | |
| VPS13B | SNV | Missense_Mutation | c.4990N>G | p.Gln1664Glu | p.Q1664E | Q7Z7G8 | protein_coding | tolerated(0.11) | probably_damaging(0.952) | TCGA-AC-A23H-01 | Breast | breast invasive carcinoma | Female | >=65 | I/II | Unknown | Unknown | PD | |
| VPS13B | SNV | Missense_Mutation | c.7561N>C | p.Glu2521Gln | p.E2521Q | Q7Z7G8 | protein_coding | deleterious(0) | probably_damaging(0.994) | TCGA-AC-A23H-01 | Breast | breast invasive carcinoma | Female | >=65 | I/II | Unknown | Unknown | PD | |
| VPS13B | SNV | Missense_Mutation | rs369849286 | c.2667N>T | p.Glu889Asp | p.E889D | Q7Z7G8 | protein_coding | tolerated(0.16) | benign(0.017) | TCGA-AN-A046-01 | Breast | breast invasive carcinoma | Female | >=65 | I/II | Unknown | Unknown | SD |
| VPS13B | SNV | Missense_Mutation | c.4298N>T | p.Ser1433Phe | p.S1433F | Q7Z7G8 | protein_coding | tolerated(0.06) | possibly_damaging(0.726) | TCGA-AN-A046-01 | Breast | breast invasive carcinoma | Female | >=65 | I/II | Unknown | Unknown | SD | |
| VPS13B | SNV | Missense_Mutation | novel | c.10395N>A | p.His3465Gln | p.H3465Q | Q7Z7G8 | protein_coding | deleterious(0.02) | probably_damaging(0.991) | TCGA-AN-A046-01 | Breast | breast invasive carcinoma | Female | >=65 | I/II | Unknown | Unknown | SD |
| Page: 1 2 3 4 5 6 7 8 9 10 11 12 13 14 15 16 17 18 19 20 21 22 23 24 25 26 27 28 29 30 31 32 33 34 35 36 37 38 39 40 41 42 43 44 45 46 47 48 |
Top |
Related drugs of malignant transformation related genes |
| Identification of chemicals and drugs interact with genes involved in malignant transfromation |
| (DGIdb 4.0) |
| Entrez ID | Symbol | Category | Interaction Types | Drug Claim Name | Drug Name | PMIDs |
| Page: 1 |

Copyright 2023-Present -The University of Texas Health Science Center at Houston |