
|
|||||
|
 | |
| |
| |
| |
| |
| |
|
Gene: VOPP1 |
Gene summary for VOPP1 |
| Gene information | Species | Human | Gene symbol | VOPP1 | Gene ID | 81552 |
| Gene name | VOPP1 WW domain binding protein | |
| Gene Alias | ECOP | |
| Cytomap | 7p11.2 | |
| Gene Type | protein-coding | GO ID | GO:0005575 | UniProtAcc | Q96AW1 |
Top |
Malignant transformation analysis |
| Identification of the aberrant gene expression in precancerous and cancerous lesions by comparing the gene expression of stem-like cells in diseased tissues with normal stem cells |
| Entrez ID | Symbol | Replicates | Species | Organ | Tissue | Adj P-value | Log2FC | Malignancy |
| 81552 | VOPP1 | LZE2D | Human | Esophagus | HGIN | 3.07e-03 | 3.39e-01 | 0.0642 |
| 81552 | VOPP1 | LZE4T | Human | Esophagus | ESCC | 1.07e-06 | 1.73e-01 | 0.0811 |
| 81552 | VOPP1 | LZE5T | Human | Esophagus | ESCC | 7.87e-03 | 2.40e-01 | 0.0514 |
| 81552 | VOPP1 | LZE7T | Human | Esophagus | ESCC | 2.18e-05 | 2.44e-01 | 0.0667 |
| 81552 | VOPP1 | LZE20T | Human | Esophagus | ESCC | 2.61e-08 | 2.92e-01 | 0.0662 |
| 81552 | VOPP1 | LZE22T | Human | Esophagus | ESCC | 1.27e-04 | 4.75e-01 | 0.068 |
| 81552 | VOPP1 | LZE24T | Human | Esophagus | ESCC | 2.83e-19 | 4.61e-01 | 0.0596 |
| 81552 | VOPP1 | P1T-E | Human | Esophagus | ESCC | 1.54e-05 | 3.59e-01 | 0.0875 |
| 81552 | VOPP1 | P2T-E | Human | Esophagus | ESCC | 1.95e-53 | 9.41e-01 | 0.1177 |
| 81552 | VOPP1 | P4T-E | Human | Esophagus | ESCC | 9.19e-25 | 6.37e-01 | 0.1323 |
| 81552 | VOPP1 | P5T-E | Human | Esophagus | ESCC | 3.58e-14 | 2.51e-01 | 0.1327 |
| 81552 | VOPP1 | P8T-E | Human | Esophagus | ESCC | 1.98e-26 | 3.01e-01 | 0.0889 |
| 81552 | VOPP1 | P9T-E | Human | Esophagus | ESCC | 1.31e-13 | 3.45e-01 | 0.1131 |
| 81552 | VOPP1 | P10T-E | Human | Esophagus | ESCC | 8.88e-43 | 6.82e-01 | 0.116 |
| 81552 | VOPP1 | P11T-E | Human | Esophagus | ESCC | 1.66e-12 | 3.88e-01 | 0.1426 |
| 81552 | VOPP1 | P12T-E | Human | Esophagus | ESCC | 5.62e-34 | 6.66e-01 | 0.1122 |
| 81552 | VOPP1 | P15T-E | Human | Esophagus | ESCC | 8.11e-38 | 8.95e-01 | 0.1149 |
| 81552 | VOPP1 | P16T-E | Human | Esophagus | ESCC | 5.18e-16 | 2.77e-01 | 0.1153 |
| 81552 | VOPP1 | P17T-E | Human | Esophagus | ESCC | 3.00e-08 | 4.82e-01 | 0.1278 |
| 81552 | VOPP1 | P19T-E | Human | Esophagus | ESCC | 2.15e-08 | 7.28e-01 | 0.1662 |
| Page: 1 2 3 4 5 6 |
| Tissue | Expression Dynamics | Abbreviation |
| Esophagus |  | ESCC: Esophageal squamous cell carcinoma |
| HGIN: High-grade intraepithelial neoplasias | ||
| LGIN: Low-grade intraepithelial neoplasias | ||
| Liver |  | HCC: Hepatocellular carcinoma |
| NAFLD: Non-alcoholic fatty liver disease | ||
| Oral Cavity |  | EOLP: Erosive Oral lichen planus |
| LP: leukoplakia | ||
| NEOLP: Non-erosive oral lichen planus | ||
| OSCC: Oral squamous cell carcinoma | ||
| Skin |  | AK: Actinic keratosis |
| cSCC: Cutaneous squamous cell carcinoma | ||
| SCCIS:squamous cell carcinoma in situ | ||
| Thyroid | 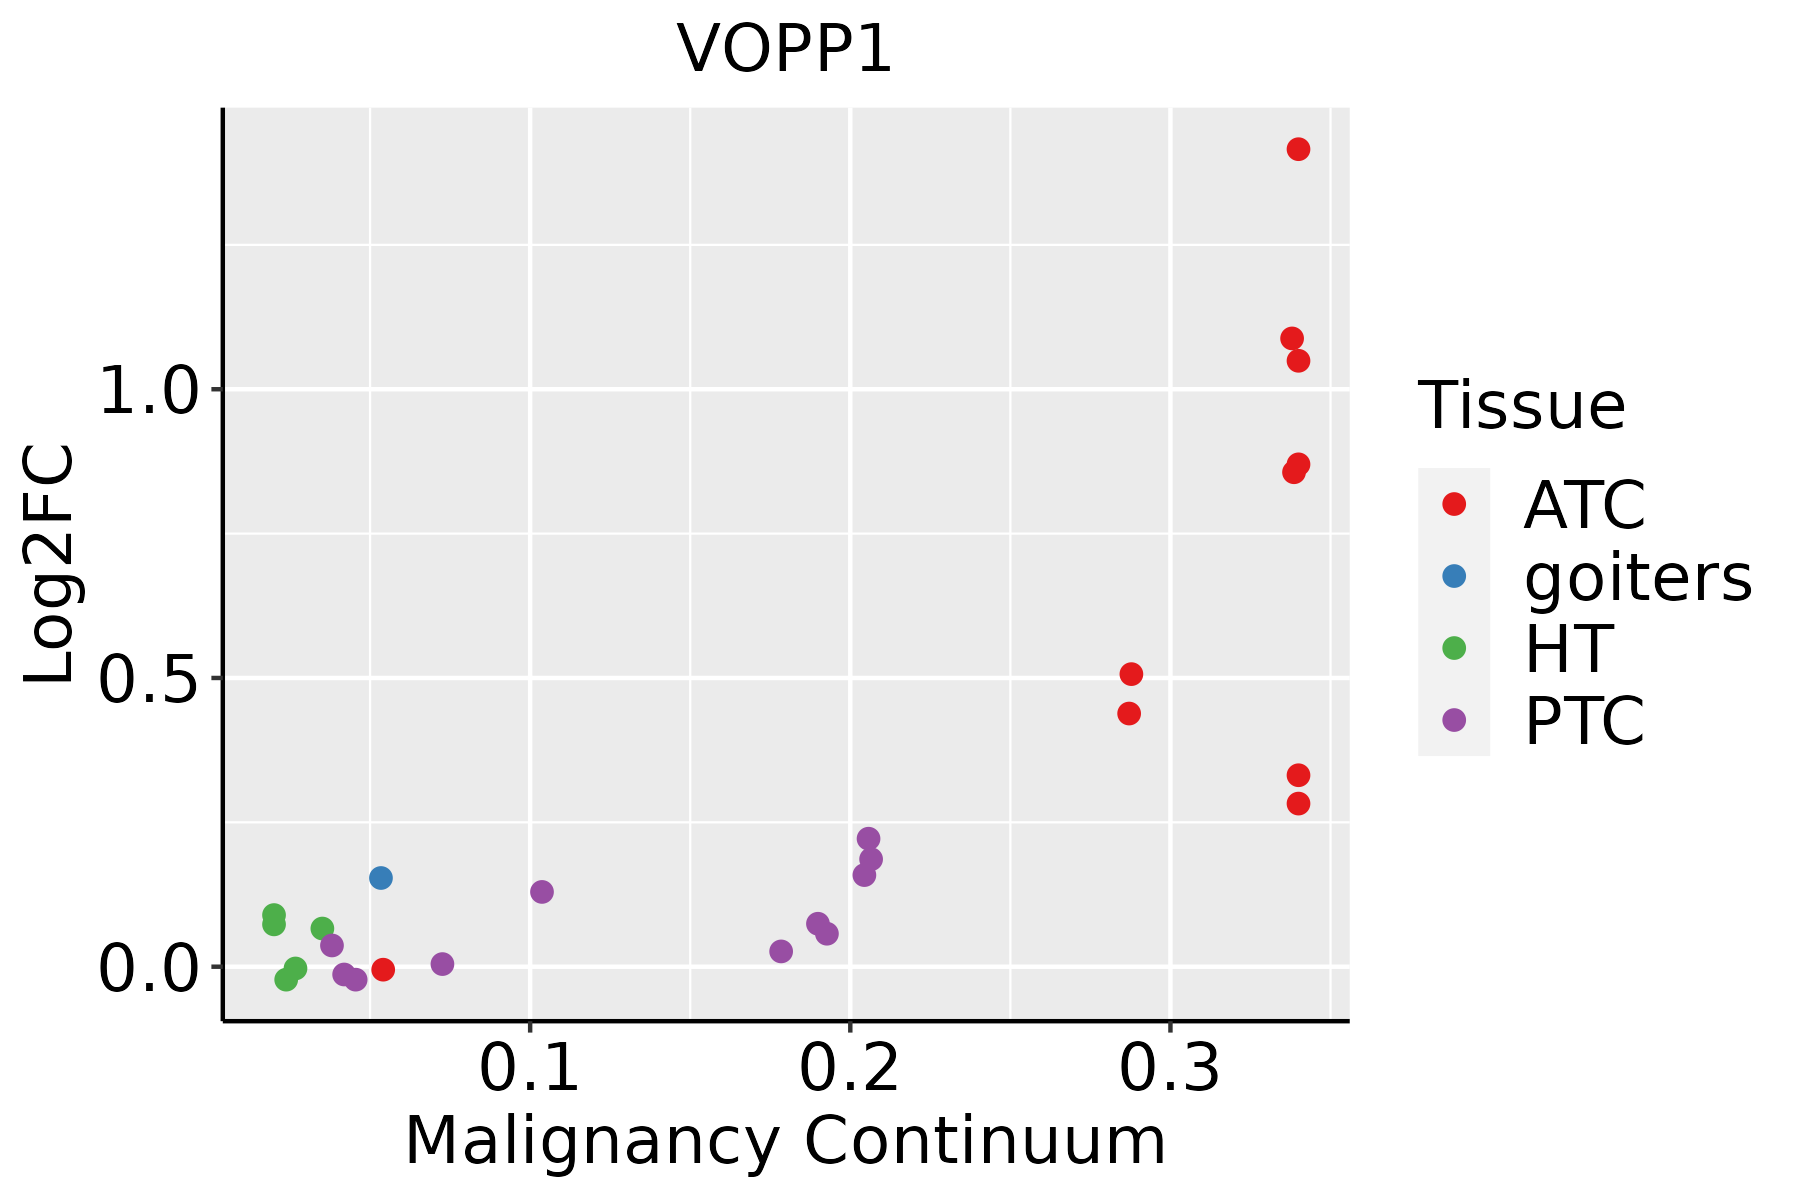 | ATC: Anaplastic thyroid cancer |
| HT: Hashimoto's thyroiditis | ||
| PTC: Papillary thyroid cancer |
| ∗log2FC in expression of this searched gene in stem-like cells from each diseased tissue sample relative to stem-like cells in normal samples in each tissue plotted against the malignancy continuum. Samples are colored based on if they are from different disease stage. |
Top |
Malignant transformation related pathway analysis |
| Find out the enriched GO biological processes and KEGG pathways involved in transition from healthy to precancer to cancer |
| Tissue | Disease Stage | Enriched GO biological Processes |
| Colorectum | AD |  |
| Colorectum | SER |  |
| Colorectum | MSS |  |
| Colorectum | MSI-H |  |
| Colorectum | FAP |  |
| ∗Top 15 enriched GO BP terms are showed in the bar plot of each disease state in each tissue. Each row represents a significant GO biological process which is colored according to the -log10(p.adjust). |
| Page: 1 2 3 4 5 6 7 8 9 |
| GO ID | Tissue | Disease Stage | Description | Gene Ratio | Bg Ratio | pvalue | p.adjust | Count |
| Page: 1 |
| Pathway ID | Tissue | Disease Stage | Description | Gene Ratio | Bg Ratio | pvalue | p.adjust | qvalue | Count |
| Page: 1 |
Top |
Cell-cell communication analysis |
| Identification of potential cell-cell interactions between two cell types and their ligand-receptor pairs for different disease states |
| Ligand | Receptor | LRpair | Pathway | Tissue | Disease Stage |
| Page: 1 |
Top |
Single-cell gene regulatory network inference analysis |
| Find out the significant the regulons (TFs) and the target genes of each regulon across cell types for different disease states |
| TF | Cell Type | Tissue | Disease Stage | Target Gene | RSS | Regulon Activity |
| ∗The dot plots of a searched regulon are shown for all cell subpopulations in each disease state of each tissue based on the regulon specific score inferred using pySCENIC and by calculating the average expression. |
| Page: 1 |
Top |
Somatic mutation of malignant transformation related genes |
| Annotation of somatic variants for genes involved in malignant transformation |
| Hugo Symbol | Variant Class | Variant Classification | dbSNP RS | HGVSc | HGVSp | HGVSp Short | SWISSPROT | BIOTYPE | SIFT | PolyPhen | Tumor Sample Barcode | Tissue | Histology | Sex | Age | Stage | Therapy Types | Drugs | Outcome |
| VOPP1 | SNV | Missense_Mutation | rs751325594 | c.257N>C | p.Tyr86Ser | p.Y86S | Q96AW1 | protein_coding | deleterious(0.02) | benign(0.224) | TCGA-JL-A3YW-01 | Breast | breast invasive carcinoma | Female | <65 | I/II | Unknown | Unknown | SD |
| VOPP1 | insertion | Nonsense_Mutation | novel | c.301_302insTCAGGTTGTAGGTCTTAAACATGCACAGCTTTTTGCCT | p.Thr101IlefsTer4 | p.T101Ifs*4 | Q96AW1 | protein_coding | TCGA-AN-A046-01 | Breast | breast invasive carcinoma | Female | >=65 | I/II | Unknown | Unknown | SD | ||
| VOPP1 | insertion | In_Frame_Ins | novel | c.211_212insCAACGGTGTGGCTGA | p.Val71delinsAlaThrValTrpLeuMet | p.V71delinsATVWLM | Q96AW1 | protein_coding | TCGA-B6-A0IA-01 | Breast | breast invasive carcinoma | Female | <65 | I/II | Unknown | Unknown | SD | ||
| VOPP1 | SNV | Missense_Mutation | rs778245022 | c.496G>A | p.Glu166Lys | p.E166K | Q96AW1 | protein_coding | deleterious_low_confidence(0) | probably_damaging(0.988) | TCGA-F5-6814-01 | Colorectum | rectum adenocarcinoma | Male | <65 | I/II | Unknown | Unknown | SD |
| VOPP1 | SNV | Missense_Mutation | c.88N>A | p.Glu30Lys | p.E30K | Q96AW1 | protein_coding | deleterious(0.02) | probably_damaging(0.988) | TCGA-AP-A059-01 | Endometrium | uterine corpus endometrioid carcinoma | Female | >=65 | I/II | Unknown | Unknown | SD | |
| VOPP1 | SNV | Missense_Mutation | rs778245022 | c.496N>A | p.Glu166Lys | p.E166K | Q96AW1 | protein_coding | deleterious_low_confidence(0) | probably_damaging(0.988) | TCGA-B5-A0JY-01 | Endometrium | uterine corpus endometrioid carcinoma | Female | <65 | III/IV | Chemotherapy | doxorubicin | SD |
| VOPP1 | SNV | Missense_Mutation | c.250C>T | p.Arg84Cys | p.R84C | Q96AW1 | protein_coding | deleterious(0.05) | probably_damaging(0.997) | TCGA-B5-A3FC-01 | Endometrium | uterine corpus endometrioid carcinoma | Female | <65 | I/II | Unknown | Unknown | SD | |
| VOPP1 | SNV | Missense_Mutation | c.88G>A | p.Glu30Lys | p.E30K | Q96AW1 | protein_coding | deleterious(0.02) | probably_damaging(0.988) | TCGA-B5-A3FC-01 | Endometrium | uterine corpus endometrioid carcinoma | Female | <65 | I/II | Unknown | Unknown | SD | |
| VOPP1 | SNV | Missense_Mutation | c.323N>A | p.Gly108Asp | p.G108D | Q96AW1 | protein_coding | deleterious_low_confidence(0.01) | benign(0) | TCGA-BG-A0VZ-01 | Endometrium | uterine corpus endometrioid carcinoma | Female | <65 | III/IV | Chemotherapy | cisplatin | CR | |
| VOPP1 | SNV | Missense_Mutation | c.263N>T | p.Pro88Leu | p.P88L | Q96AW1 | protein_coding | tolerated(0.06) | probably_damaging(0.947) | TCGA-D1-A167-01 | Endometrium | uterine corpus endometrioid carcinoma | Female | >=65 | I/II | Unknown | Unknown | SD |
| Page: 1 2 |
Top |
Related drugs of malignant transformation related genes |
| Identification of chemicals and drugs interact with genes involved in malignant transfromation |
| (DGIdb 4.0) |
| Entrez ID | Symbol | Category | Interaction Types | Drug Claim Name | Drug Name | PMIDs |
| Page: 1 |

Copyright 2023-Present -The University of Texas Health Science Center at Houston |