
|
|||||
|
 | |
| |
| |
| |
| |
| |
|
Gene: VMP1 |
Gene summary for VMP1 |
| Gene information | Species | Human | Gene symbol | VMP1 | Gene ID | 81671 |
| Gene name | vacuole membrane protein 1 | |
| Gene Alias | EPG3 | |
| Cytomap | 17q23.1 | |
| Gene Type | protein-coding | GO ID | GO:0000003 | UniProtAcc | Q96GC9 |
Top |
Malignant transformation analysis |
| Identification of the aberrant gene expression in precancerous and cancerous lesions by comparing the gene expression of stem-like cells in diseased tissues with normal stem cells |
| Entrez ID | Symbol | Replicates | Species | Organ | Tissue | Adj P-value | Log2FC | Malignancy |
| 81671 | VMP1 | GSM4909285 | Human | Breast | IDC | 3.71e-10 | -4.05e-01 | 0.21 |
| 81671 | VMP1 | GSM4909286 | Human | Breast | IDC | 1.56e-20 | -6.52e-01 | 0.1081 |
| 81671 | VMP1 | GSM4909288 | Human | Breast | IDC | 2.64e-04 | -3.60e-01 | 0.0988 |
| 81671 | VMP1 | GSM4909293 | Human | Breast | IDC | 1.68e-05 | 2.80e-01 | 0.1581 |
| 81671 | VMP1 | GSM4909294 | Human | Breast | IDC | 2.54e-10 | -4.75e-01 | 0.2022 |
| 81671 | VMP1 | GSM4909296 | Human | Breast | IDC | 3.23e-25 | -6.93e-01 | 0.1524 |
| 81671 | VMP1 | GSM4909297 | Human | Breast | IDC | 1.10e-17 | -4.75e-01 | 0.1517 |
| 81671 | VMP1 | GSM4909298 | Human | Breast | IDC | 3.31e-02 | -2.58e-01 | 0.1551 |
| 81671 | VMP1 | GSM4909301 | Human | Breast | IDC | 6.97e-10 | 3.20e-01 | 0.1577 |
| 81671 | VMP1 | GSM4909308 | Human | Breast | IDC | 3.23e-07 | 3.65e-01 | 0.158 |
| 81671 | VMP1 | GSM4909311 | Human | Breast | IDC | 1.08e-37 | -6.70e-01 | 0.1534 |
| 81671 | VMP1 | GSM4909313 | Human | Breast | IDC | 9.54e-06 | 2.77e-01 | 0.0391 |
| 81671 | VMP1 | GSM4909315 | Human | Breast | IDC | 4.29e-08 | -5.08e-01 | 0.21 |
| 81671 | VMP1 | GSM4909316 | Human | Breast | IDC | 1.72e-11 | -7.75e-01 | 0.21 |
| 81671 | VMP1 | GSM4909318 | Human | Breast | IDC | 2.51e-07 | -7.51e-01 | 0.2031 |
| 81671 | VMP1 | GSM4909319 | Human | Breast | IDC | 7.97e-44 | -4.46e-01 | 0.1563 |
| 81671 | VMP1 | GSM4909320 | Human | Breast | IDC | 1.80e-04 | -2.46e-01 | 0.1575 |
| 81671 | VMP1 | GSM4909321 | Human | Breast | IDC | 4.07e-07 | -6.56e-02 | 0.1559 |
| 81671 | VMP1 | ctrl6 | Human | Breast | Precancer | 2.62e-10 | 5.60e-01 | -0.0061 |
| 81671 | VMP1 | brca1 | Human | Breast | Precancer | 1.34e-09 | -4.06e-01 | -0.0338 |
| Page: 1 2 3 4 5 6 7 8 9 10 11 12 13 14 15 16 |
| Tissue | Expression Dynamics | Abbreviation |
| Breast |  | IDC: Invasive ductal carcinoma |
| DCIS: Ductal carcinoma in situ | ||
| Precancer(BRCA1-mut): Precancerous lesion from BRCA1 mutation carriers | ||
| Cervix |  | CC: Cervix cancer |
| HSIL_HPV: HPV-infected high-grade squamous intraepithelial lesions | ||
| N_HPV: HPV-infected normal cervix | ||
| Colorectum (GSE201348) |  | FAP: Familial adenomatous polyposis |
| CRC: Colorectal cancer | ||
| Colorectum (HTA11) |  | AD: Adenomas |
| SER: Sessile serrated lesions | ||
| MSI-H: Microsatellite-high colorectal cancer | ||
| MSS: Microsatellite stable colorectal cancer | ||
| Esophagus | 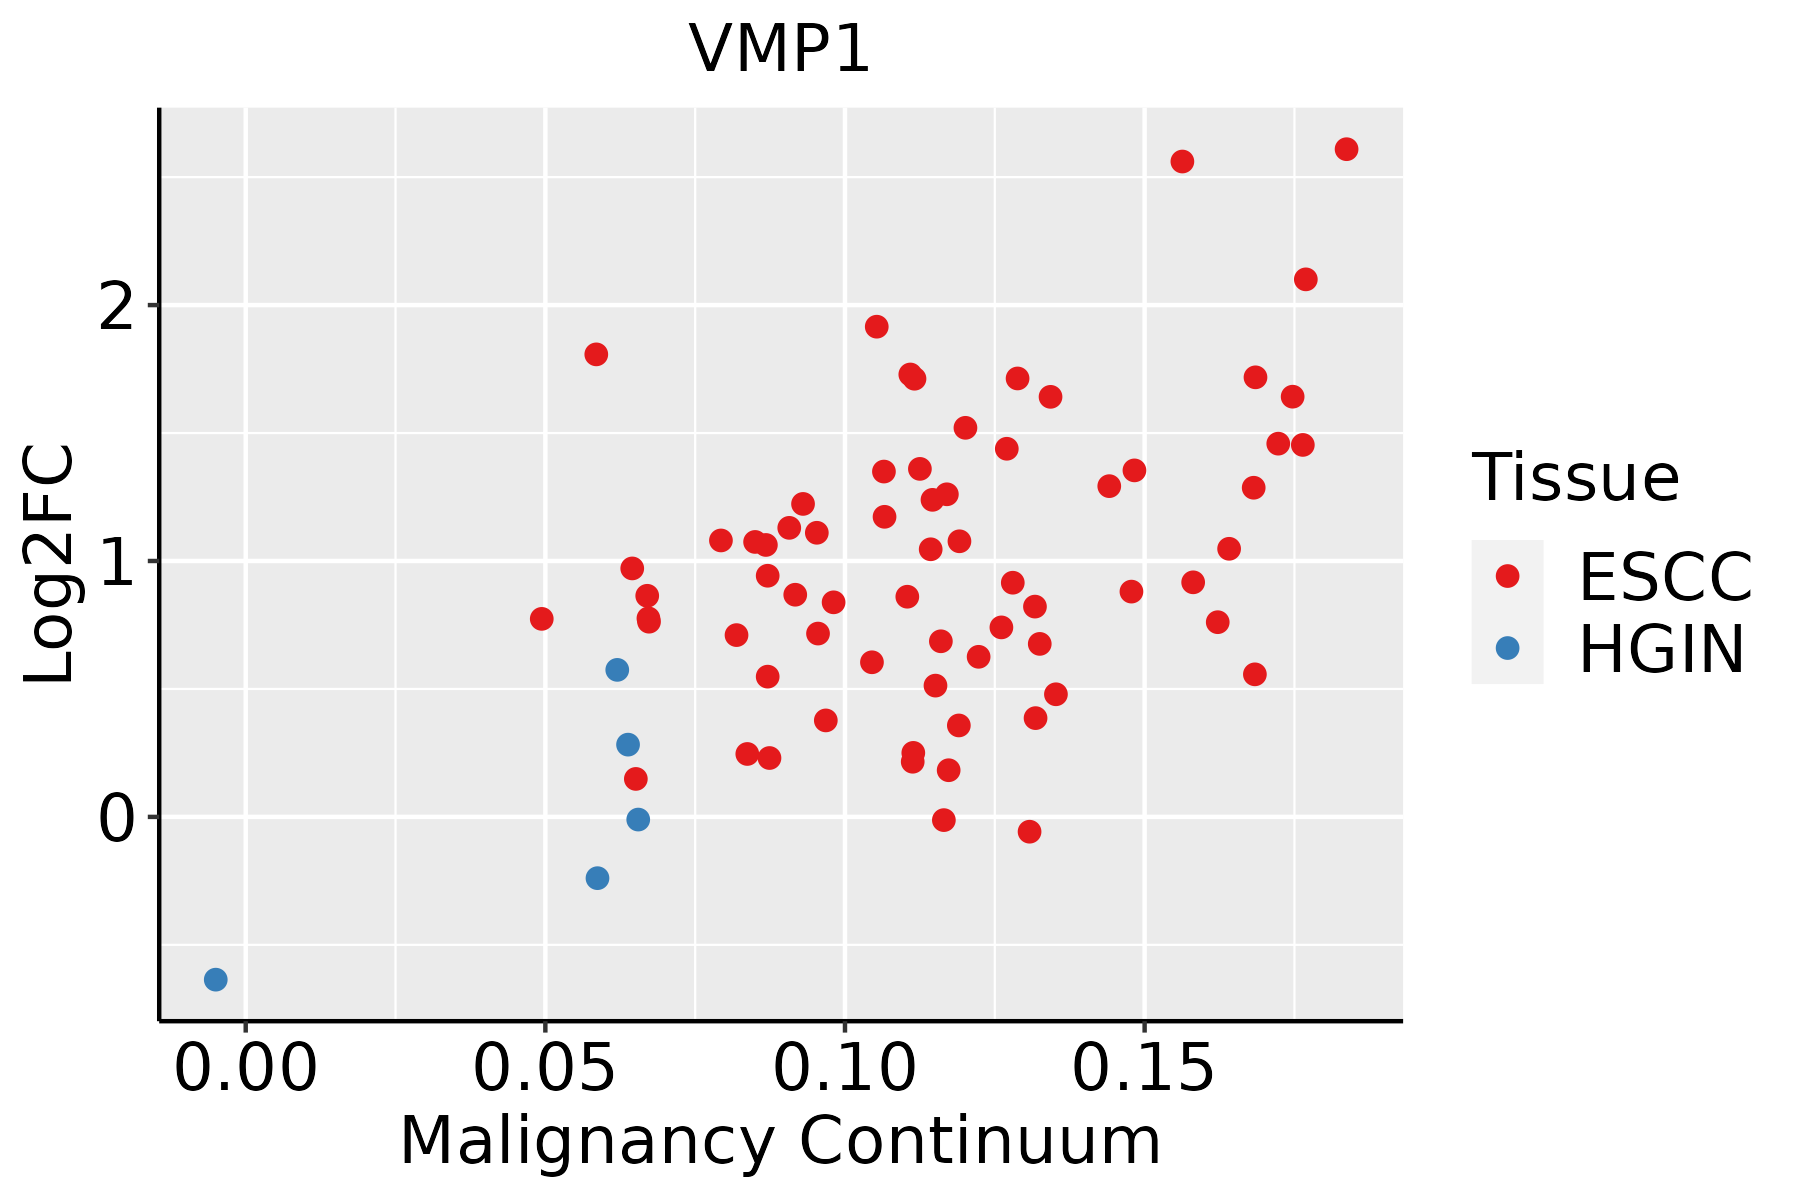 | ESCC: Esophageal squamous cell carcinoma |
| HGIN: High-grade intraepithelial neoplasias | ||
| LGIN: Low-grade intraepithelial neoplasias | ||
| GC |  | CAG: Chronic atrophic gastritis |
| CAG with IM: Chronic atrophic gastritis with intestinal metaplasia | ||
| CSG: Chronic superficial gastritis | ||
| GC: Gastric cancer | ||
| SIM: Severe intestinal metaplasia | ||
| WIM: Wild intestinal metaplasia | ||
| Liver | 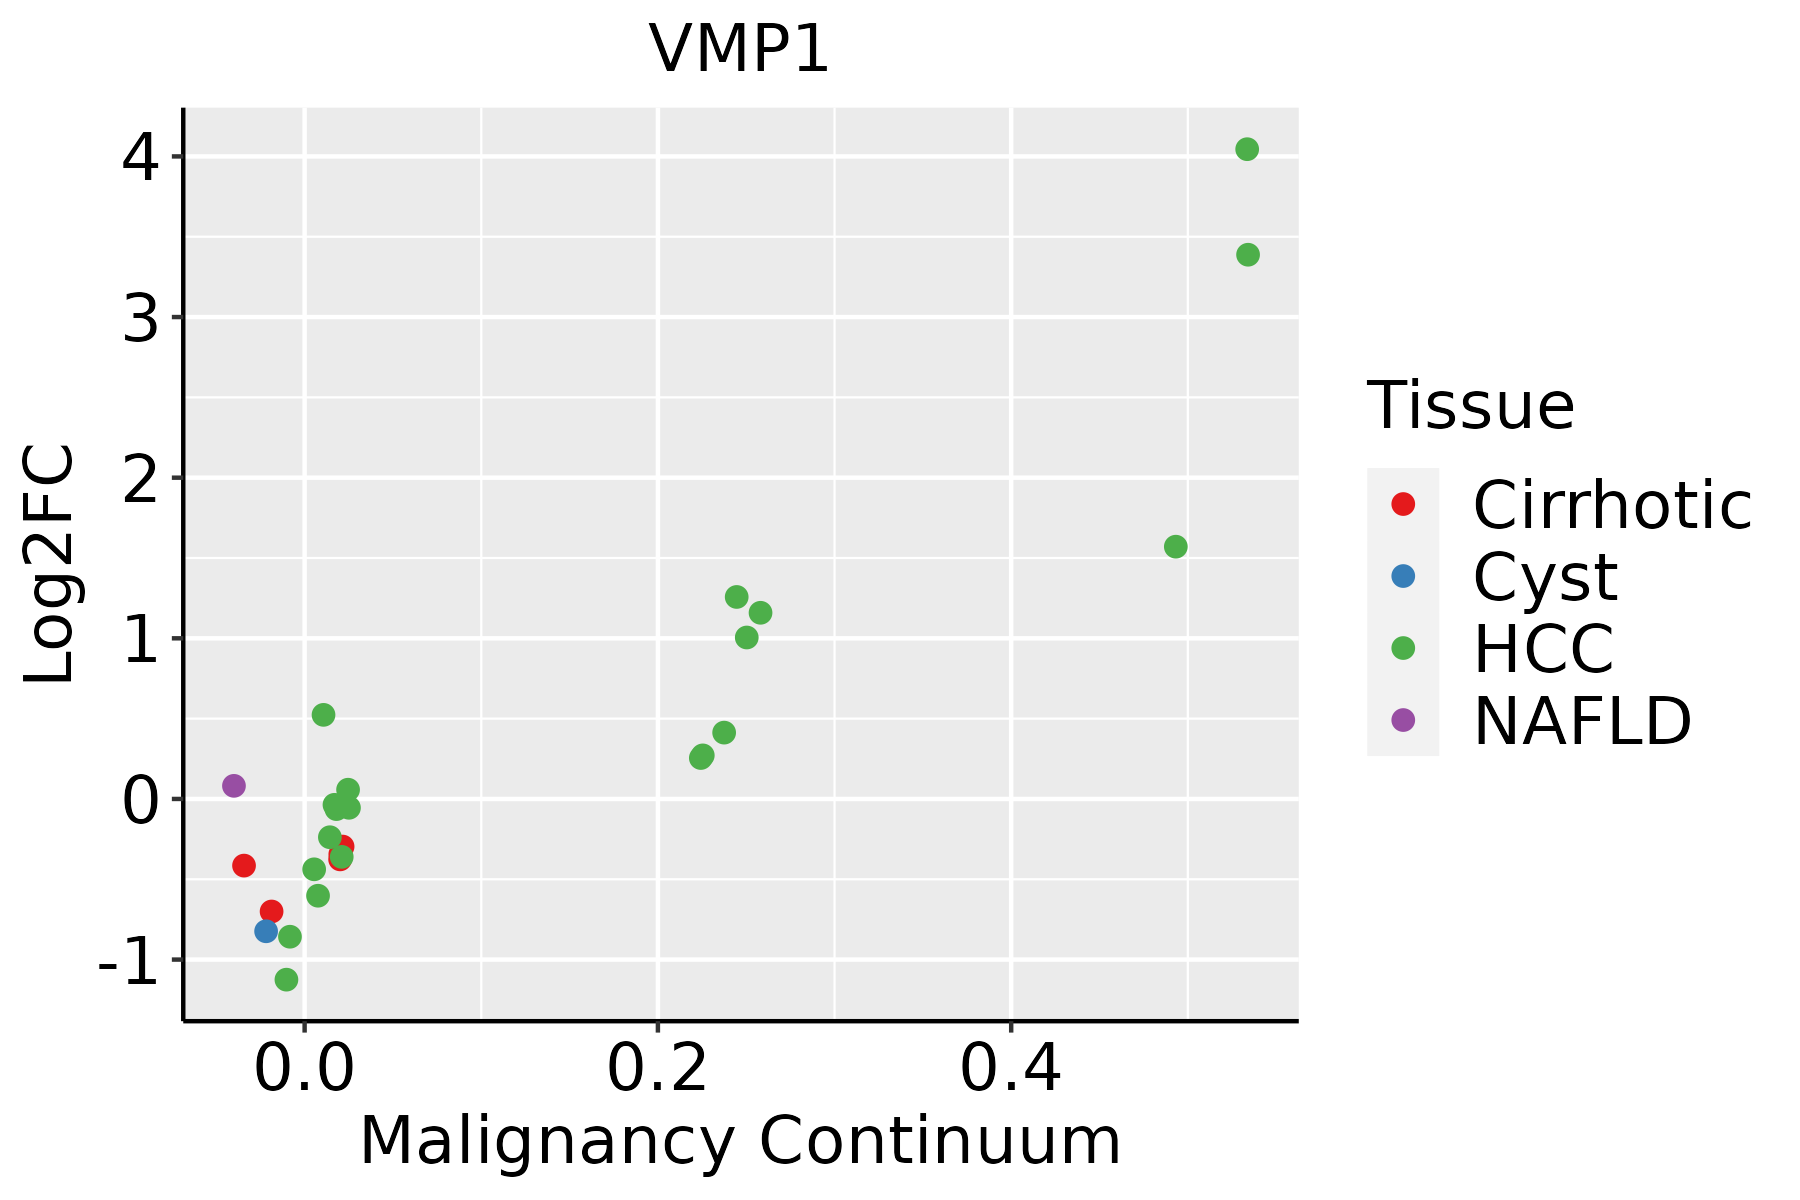 | HCC: Hepatocellular carcinoma |
| NAFLD: Non-alcoholic fatty liver disease | ||
| Lung |  | AAH: Atypical adenomatous hyperplasia |
| AIS: Adenocarcinoma in situ | ||
| IAC: Invasive lung adenocarcinoma | ||
| MIA: Minimally invasive adenocarcinoma | ||
| Oral Cavity | 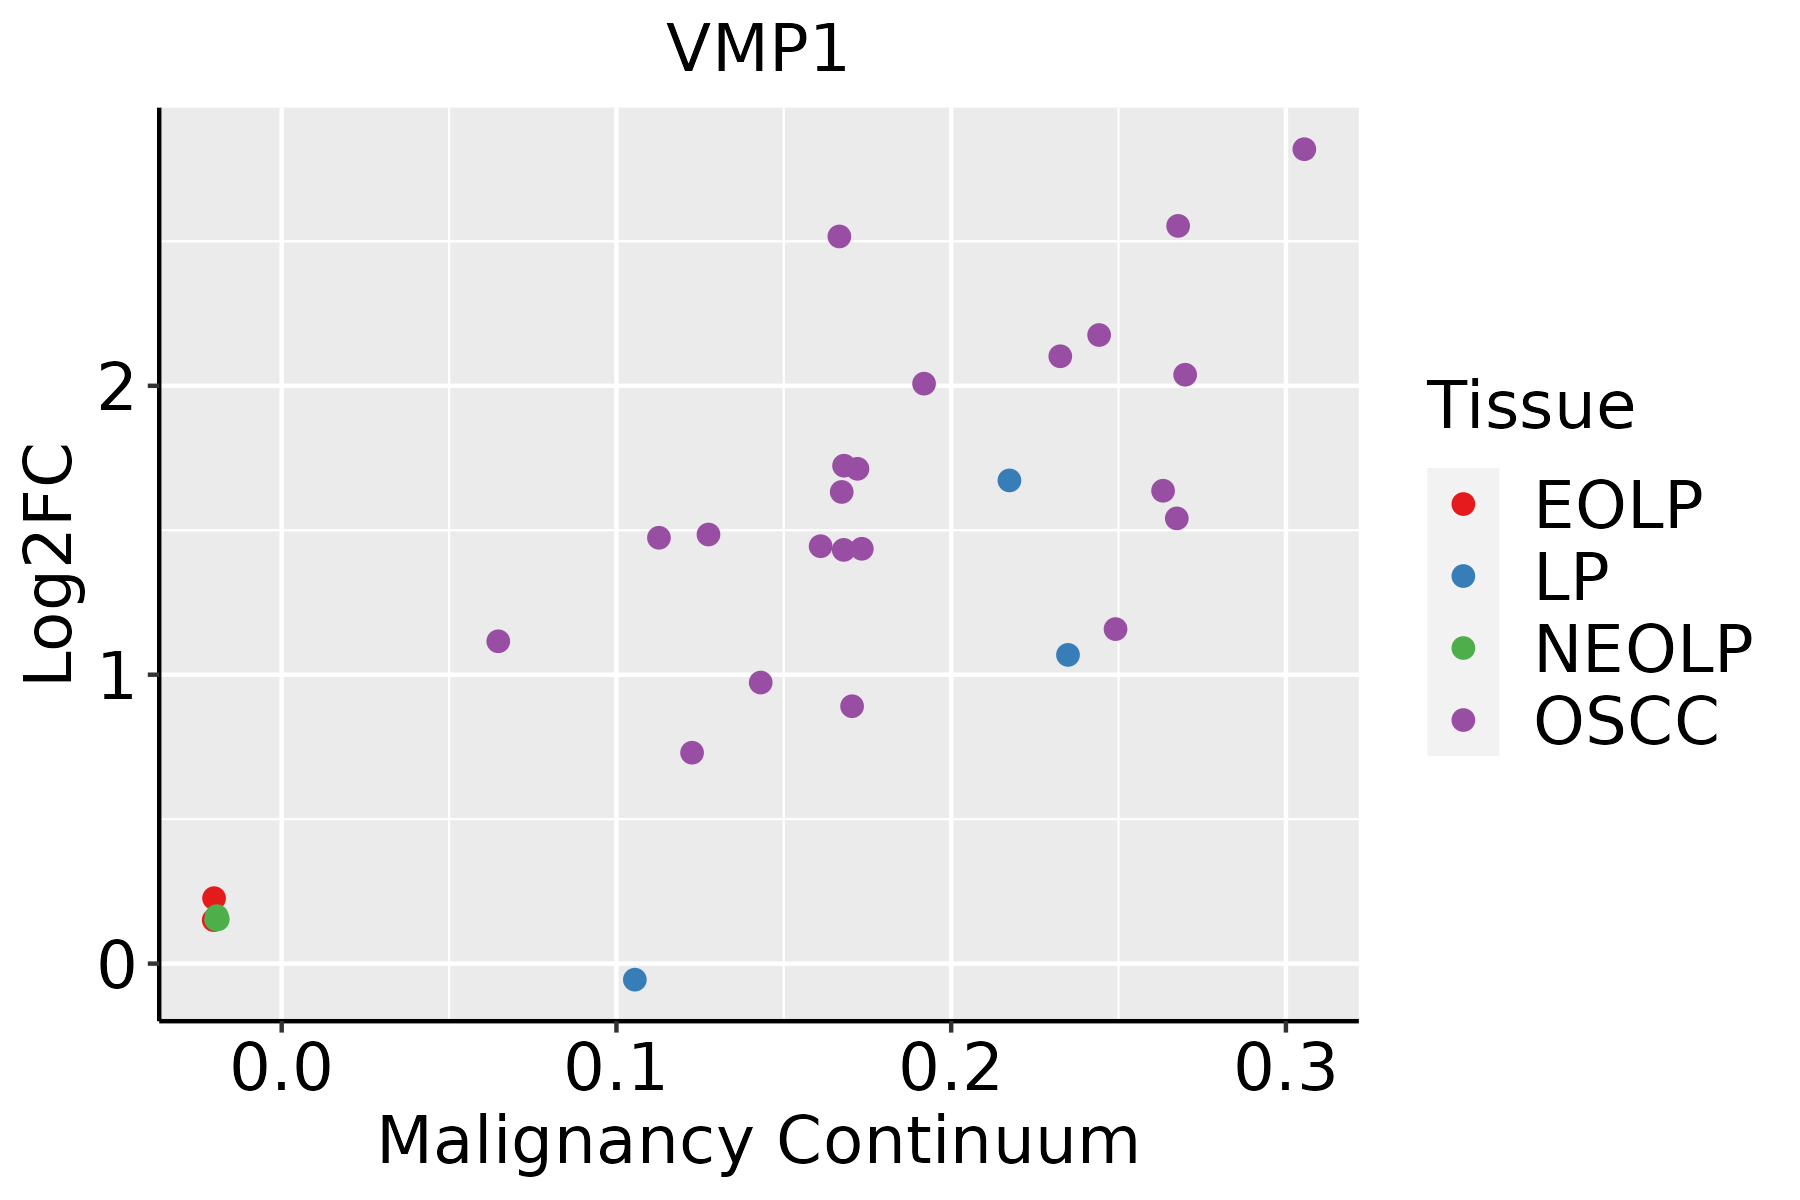 | EOLP: Erosive Oral lichen planus |
| LP: leukoplakia | ||
| NEOLP: Non-erosive oral lichen planus | ||
| OSCC: Oral squamous cell carcinoma | ||
| Prostate | 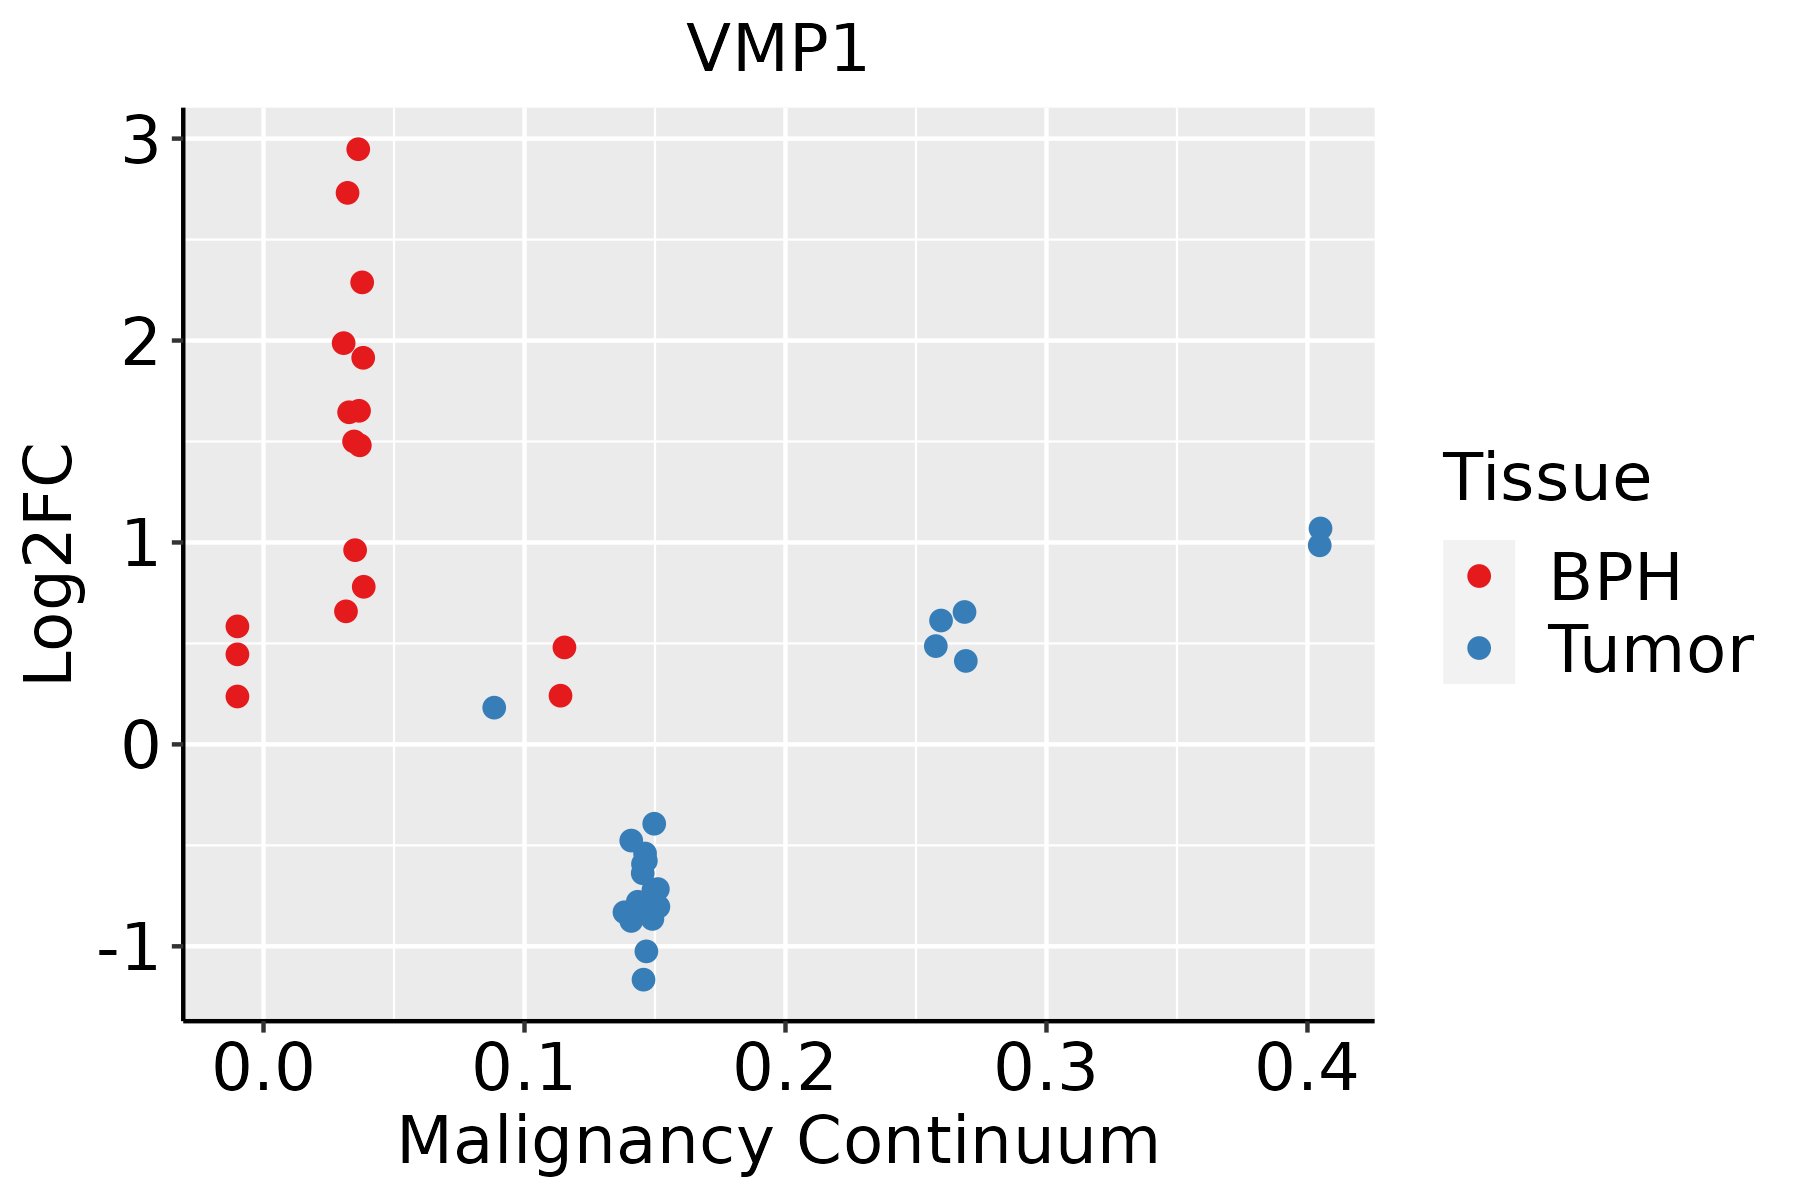 | BPH: Benign Prostatic Hyperplasia |
| Skin | 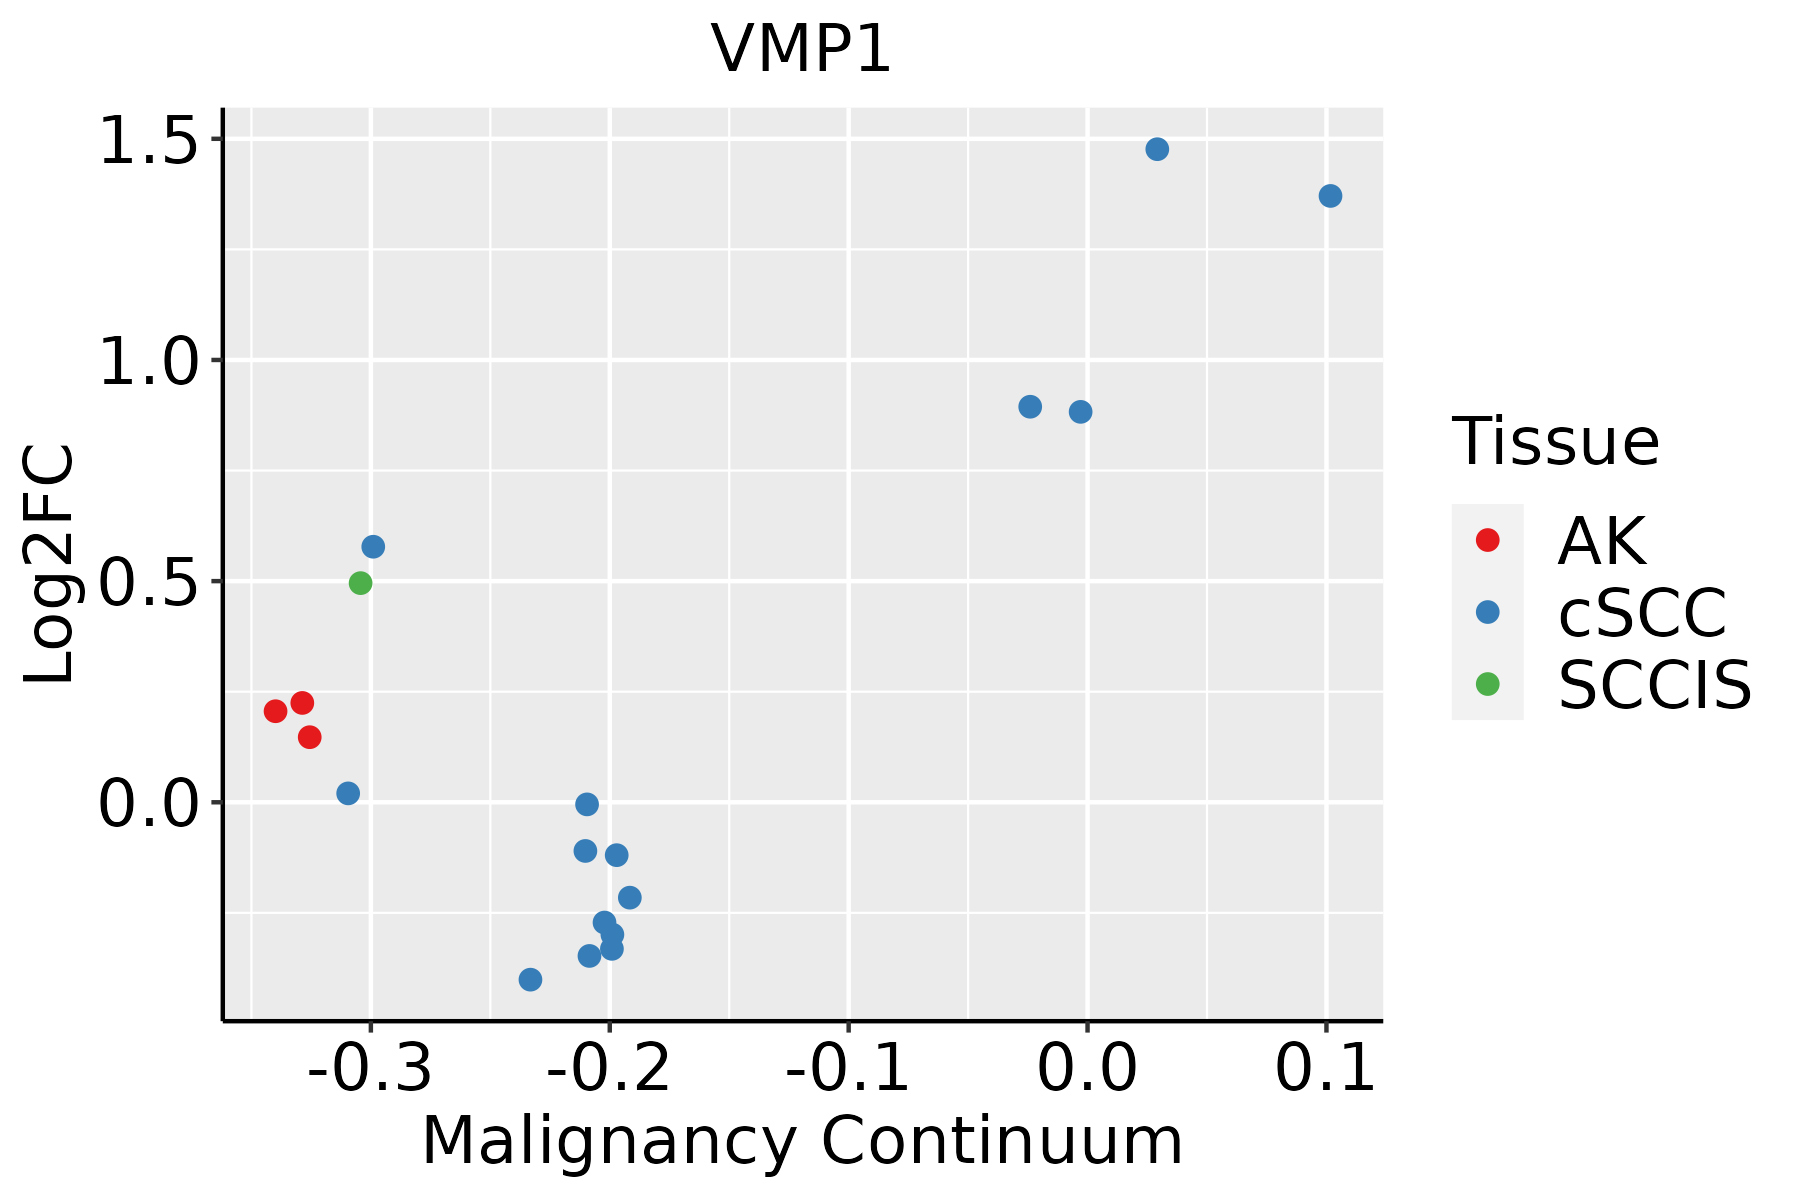 | AK: Actinic keratosis |
| cSCC: Cutaneous squamous cell carcinoma | ||
| SCCIS:squamous cell carcinoma in situ | ||
| Thyroid |  | ATC: Anaplastic thyroid cancer |
| HT: Hashimoto's thyroiditis | ||
| PTC: Papillary thyroid cancer |
| ∗log2FC in expression of this searched gene in stem-like cells from each diseased tissue sample relative to stem-like cells in normal samples in each tissue plotted against the malignancy continuum. Samples are colored based on if they are from different disease stage. |
Top |
Malignant transformation related pathway analysis |
| Find out the enriched GO biological processes and KEGG pathways involved in transition from healthy to precancer to cancer |
| Tissue | Disease Stage | Enriched GO biological Processes |
| Colorectum | AD |  |
| Colorectum | SER |  |
| Colorectum | MSS |  |
| Colorectum | MSI-H |  |
| Colorectum | FAP |  |
| ∗Top 15 enriched GO BP terms are showed in the bar plot of each disease state in each tissue. Each row represents a significant GO biological process which is colored according to the -log10(p.adjust). |
| Page: 1 2 3 4 5 6 7 8 9 |
| GO ID | Tissue | Disease Stage | Description | Gene Ratio | Bg Ratio | pvalue | p.adjust | Count |
| GO:00075653 | Breast | Precancer | female pregnancy | 29/1080 | 193/18723 | 2.07e-06 | 7.31e-05 | 29 |
| GO:00447063 | Breast | Precancer | multi-multicellular organism process | 31/1080 | 220/18723 | 3.73e-06 | 1.19e-04 | 31 |
| GO:00075663 | Breast | Precancer | embryo implantation | 11/1080 | 53/18723 | 1.82e-04 | 2.95e-03 | 11 |
| GO:00224119 | Breast | Precancer | cellular component disassembly | 44/1080 | 443/18723 | 3.17e-04 | 4.51e-03 | 44 |
| GO:00324116 | Breast | Precancer | positive regulation of transporter activity | 16/1080 | 120/18723 | 1.46e-03 | 1.51e-02 | 16 |
| GO:00347673 | Breast | Precancer | positive regulation of ion transmembrane transport | 19/1080 | 167/18723 | 3.60e-03 | 2.98e-02 | 19 |
| GO:00324143 | Breast | Precancer | positive regulation of ion transmembrane transporter activity | 14/1080 | 109/18723 | 3.97e-03 | 3.15e-02 | 14 |
| GO:00109596 | Breast | Precancer | regulation of metal ion transport | 37/1080 | 406/18723 | 4.07e-03 | 3.22e-02 | 37 |
| GO:00228985 | Breast | Precancer | regulation of transmembrane transporter activity | 27/1080 | 278/18723 | 5.72e-03 | 4.11e-02 | 27 |
| GO:1901021 | Breast | Precancer | positive regulation of calcium ion transmembrane transporter activity | 7/1080 | 39/18723 | 6.32e-03 | 4.43e-02 | 7 |
| GO:1901019 | Breast | Precancer | regulation of calcium ion transmembrane transporter activity | 12/1080 | 93/18723 | 7.09e-03 | 4.78e-02 | 12 |
| GO:000756511 | Breast | IDC | female pregnancy | 39/1434 | 193/18723 | 1.81e-08 | 1.27e-06 | 39 |
| GO:00447061 | Breast | IDC | multi-multicellular organism process | 41/1434 | 220/18723 | 8.58e-08 | 5.19e-06 | 41 |
| GO:000756611 | Breast | IDC | embryo implantation | 14/1434 | 53/18723 | 3.14e-05 | 7.32e-04 | 14 |
| GO:001095913 | Breast | IDC | regulation of metal ion transport | 52/1434 | 406/18723 | 1.76e-04 | 2.97e-03 | 52 |
| GO:003241111 | Breast | IDC | positive regulation of transporter activity | 20/1434 | 120/18723 | 7.64e-04 | 9.27e-03 | 20 |
| GO:00432703 | Breast | IDC | positive regulation of ion transport | 36/1434 | 275/18723 | 1.11e-03 | 1.22e-02 | 36 |
| GO:002289812 | Breast | IDC | regulation of transmembrane transporter activity | 36/1434 | 278/18723 | 1.35e-03 | 1.40e-02 | 36 |
| GO:003241411 | Breast | IDC | positive regulation of ion transmembrane transporter activity | 18/1434 | 109/18723 | 1.53e-03 | 1.53e-02 | 18 |
| GO:003476711 | Breast | IDC | positive regulation of ion transmembrane transport | 24/1434 | 167/18723 | 2.07e-03 | 1.95e-02 | 24 |
| Page: 1 2 3 4 5 6 7 8 9 10 11 12 13 14 15 16 |
| Pathway ID | Tissue | Disease Stage | Description | Gene Ratio | Bg Ratio | pvalue | p.adjust | qvalue | Count |
| hsa04140 | Colorectum | AD | Autophagy - animal | 49/2092 | 141/8465 | 4.58e-03 | 2.20e-02 | 1.40e-02 | 49 |
| hsa041401 | Colorectum | AD | Autophagy - animal | 49/2092 | 141/8465 | 4.58e-03 | 2.20e-02 | 1.40e-02 | 49 |
| hsa041402 | Colorectum | SER | Autophagy - animal | 39/1580 | 141/8465 | 5.43e-03 | 3.28e-02 | 2.38e-02 | 39 |
| hsa041403 | Colorectum | SER | Autophagy - animal | 39/1580 | 141/8465 | 5.43e-03 | 3.28e-02 | 2.38e-02 | 39 |
| hsa041404 | Colorectum | MSS | Autophagy - animal | 45/1875 | 141/8465 | 4.42e-03 | 1.90e-02 | 1.16e-02 | 45 |
| hsa041405 | Colorectum | MSS | Autophagy - animal | 45/1875 | 141/8465 | 4.42e-03 | 1.90e-02 | 1.16e-02 | 45 |
| hsa0414010 | Esophagus | ESCC | Autophagy - animal | 101/4205 | 141/8465 | 7.60e-08 | 6.21e-07 | 3.18e-07 | 101 |
| hsa0414015 | Esophagus | ESCC | Autophagy - animal | 101/4205 | 141/8465 | 7.60e-08 | 6.21e-07 | 3.18e-07 | 101 |
| hsa041406 | Liver | Cirrhotic | Autophagy - animal | 65/2530 | 141/8465 | 3.10e-05 | 2.47e-04 | 1.52e-04 | 65 |
| hsa0414011 | Liver | Cirrhotic | Autophagy - animal | 65/2530 | 141/8465 | 3.10e-05 | 2.47e-04 | 1.52e-04 | 65 |
| hsa0414021 | Liver | HCC | Autophagy - animal | 99/4020 | 141/8465 | 3.08e-08 | 4.70e-07 | 2.61e-07 | 99 |
| hsa0414031 | Liver | HCC | Autophagy - animal | 99/4020 | 141/8465 | 3.08e-08 | 4.70e-07 | 2.61e-07 | 99 |
| hsa041407 | Lung | IAC | Autophagy - animal | 28/1053 | 141/8465 | 7.64e-03 | 3.03e-02 | 2.01e-02 | 28 |
| hsa0414012 | Lung | IAC | Autophagy - animal | 28/1053 | 141/8465 | 7.64e-03 | 3.03e-02 | 2.01e-02 | 28 |
| hsa041409 | Oral cavity | OSCC | Autophagy - animal | 94/3704 | 141/8465 | 2.73e-08 | 2.38e-07 | 1.21e-07 | 94 |
| hsa0414014 | Oral cavity | OSCC | Autophagy - animal | 94/3704 | 141/8465 | 2.73e-08 | 2.38e-07 | 1.21e-07 | 94 |
| hsa0414024 | Oral cavity | LP | Autophagy - animal | 55/2418 | 141/8465 | 4.54e-03 | 1.87e-02 | 1.20e-02 | 55 |
| hsa0414034 | Oral cavity | LP | Autophagy - animal | 55/2418 | 141/8465 | 4.54e-03 | 1.87e-02 | 1.20e-02 | 55 |
| hsa0414041 | Oral cavity | EOLP | Autophagy - animal | 39/1218 | 141/8465 | 2.68e-05 | 1.38e-04 | 8.12e-05 | 39 |
| hsa0414051 | Oral cavity | EOLP | Autophagy - animal | 39/1218 | 141/8465 | 2.68e-05 | 1.38e-04 | 8.12e-05 | 39 |
| Page: 1 2 |
Top |
Cell-cell communication analysis |
| Identification of potential cell-cell interactions between two cell types and their ligand-receptor pairs for different disease states |
| Ligand | Receptor | LRpair | Pathway | Tissue | Disease Stage |
| Page: 1 |
Top |
Single-cell gene regulatory network inference analysis |
| Find out the significant the regulons (TFs) and the target genes of each regulon across cell types for different disease states |
| TF | Cell Type | Tissue | Disease Stage | Target Gene | RSS | Regulon Activity |
| ∗The dot plots of a searched regulon are shown for all cell subpopulations in each disease state of each tissue based on the regulon specific score inferred using pySCENIC and by calculating the average expression. |
| Page: 1 |
Top |
Somatic mutation of malignant transformation related genes |
| Annotation of somatic variants for genes involved in malignant transformation |
| Hugo Symbol | Variant Class | Variant Classification | dbSNP RS | HGVSc | HGVSp | HGVSp Short | SWISSPROT | BIOTYPE | SIFT | PolyPhen | Tumor Sample Barcode | Tissue | Histology | Sex | Age | Stage | Therapy Types | Drugs | Outcome |
| VMP1 | SNV | Missense_Mutation | c.1181N>A | p.Arg394Gln | p.R394Q | Q96GC9 | protein_coding | deleterious(0) | benign(0.288) | TCGA-AC-A23H-01 | Breast | breast invasive carcinoma | Female | >=65 | I/II | Unknown | Unknown | PD | |
| VMP1 | insertion | Frame_Shift_Ins | novel | c.577_578insCAGGGGGT | p.Met193ThrfsTer62 | p.M193Tfs*62 | Q96GC9 | protein_coding | TCGA-AR-A0U0-01 | Breast | breast invasive carcinoma | Female | >=65 | I/II | Unknown | Unknown | SD | ||
| VMP1 | deletion | Frame_Shift_Del | novel | c.248delT | p.Leu83TyrfsTer8 | p.L83Yfs*8 | Q96GC9 | protein_coding | TCGA-EW-A2FV-01 | Breast | breast invasive carcinoma | Female | <65 | III/IV | Chemotherapy | docetaxel | SD | ||
| VMP1 | SNV | Missense_Mutation | c.669G>C | p.Glu223Asp | p.E223D | Q96GC9 | protein_coding | tolerated(0.69) | benign(0.012) | TCGA-EK-A3GK-01 | Cervix | cervical & endocervical cancer | Female | <65 | I/II | Unknown | Unknown | SD | |
| VMP1 | SNV | Missense_Mutation | c.1048N>T | p.His350Tyr | p.H350Y | Q96GC9 | protein_coding | deleterious(0) | probably_damaging(0.982) | TCGA-FU-A40J-01 | Cervix | cervical & endocervical cancer | Female | <65 | III/IV | Chemotherapy | carboplatin | CR | |
| VMP1 | SNV | Missense_Mutation | novel | c.814G>C | p.Asp272His | p.D272H | Q96GC9 | protein_coding | deleterious(0) | probably_damaging(0.994) | TCGA-JX-A3Q0-01 | Cervix | cervical & endocervical cancer | Female | <65 | III/IV | Unknown | Unknown | SD |
| VMP1 | SNV | Missense_Mutation | c.1036N>T | p.Arg346Trp | p.R346W | Q96GC9 | protein_coding | deleterious(0) | possibly_damaging(0.828) | TCGA-AA-3864-01 | Colorectum | colon adenocarcinoma | Male | >=65 | I/II | Unknown | Unknown | SD | |
| VMP1 | SNV | Missense_Mutation | c.601G>A | p.Gly201Arg | p.G201R | Q96GC9 | protein_coding | deleterious(0) | probably_damaging(1) | TCGA-AA-3877-01 | Colorectum | colon adenocarcinoma | Female | >=65 | I/II | Unknown | Unknown | SD | |
| VMP1 | SNV | Missense_Mutation | novel | c.131N>G | p.Ile44Ser | p.I44S | Q96GC9 | protein_coding | deleterious(0) | possibly_damaging(0.767) | TCGA-AA-3984-01 | Colorectum | colon adenocarcinoma | Female | <65 | I/II | Unknown | Unknown | SD |
| VMP1 | SNV | Missense_Mutation | c.926N>C | p.Ile309Thr | p.I309T | Q96GC9 | protein_coding | deleterious(0) | probably_damaging(0.978) | TCGA-AD-6895-01 | Colorectum | colon adenocarcinoma | Male | >=65 | III/IV | Unknown | Unknown | SD |
| Page: 1 2 3 4 5 |
Top |
Related drugs of malignant transformation related genes |
| Identification of chemicals and drugs interact with genes involved in malignant transfromation |
| (DGIdb 4.0) |
| Entrez ID | Symbol | Category | Interaction Types | Drug Claim Name | Drug Name | PMIDs |
| Page: 1 |

Copyright 2023-Present -The University of Texas Health Science Center at Houston |