
|
|||||
|
 | |
| |
| |
| |
| |
| |
|
Gene: VMA21 |
Gene summary for VMA21 |
| Gene information | Species | Human | Gene symbol | VMA21 | Gene ID | 203547 |
| Gene name | vacuolar ATPase assembly factor VMA21 | |
| Gene Alias | MEAX | |
| Cytomap | Xq28 | |
| Gene Type | protein-coding | GO ID | GO:0008150 | UniProtAcc | Q3ZAQ7 |
Top |
Malignant transformation analysis |
| Identification of the aberrant gene expression in precancerous and cancerous lesions by comparing the gene expression of stem-like cells in diseased tissues with normal stem cells |
| Entrez ID | Symbol | Replicates | Species | Organ | Tissue | Adj P-value | Log2FC | Malignancy |
| 203547 | VMA21 | LZE2T | Human | Esophagus | ESCC | 4.16e-04 | 7.92e-01 | 0.082 |
| 203547 | VMA21 | LZE4T | Human | Esophagus | ESCC | 8.61e-18 | 6.36e-01 | 0.0811 |
| 203547 | VMA21 | LZE7T | Human | Esophagus | ESCC | 2.11e-13 | 1.08e+00 | 0.0667 |
| 203547 | VMA21 | LZE8T | Human | Esophagus | ESCC | 8.77e-04 | 1.32e-01 | 0.067 |
| 203547 | VMA21 | LZE20T | Human | Esophagus | ESCC | 2.25e-03 | 2.31e-01 | 0.0662 |
| 203547 | VMA21 | LZE24T | Human | Esophagus | ESCC | 2.30e-22 | 6.40e-01 | 0.0596 |
| 203547 | VMA21 | LZE6T | Human | Esophagus | ESCC | 3.45e-09 | 7.14e-01 | 0.0845 |
| 203547 | VMA21 | P1T-E | Human | Esophagus | ESCC | 2.72e-08 | 6.36e-01 | 0.0875 |
| 203547 | VMA21 | P2T-E | Human | Esophagus | ESCC | 5.03e-29 | 6.69e-01 | 0.1177 |
| 203547 | VMA21 | P4T-E | Human | Esophagus | ESCC | 4.81e-30 | 7.40e-01 | 0.1323 |
| 203547 | VMA21 | P5T-E | Human | Esophagus | ESCC | 3.01e-47 | 9.52e-01 | 0.1327 |
| 203547 | VMA21 | P8T-E | Human | Esophagus | ESCC | 1.06e-17 | 4.39e-01 | 0.0889 |
| 203547 | VMA21 | P9T-E | Human | Esophagus | ESCC | 3.81e-31 | 8.30e-01 | 0.1131 |
| 203547 | VMA21 | P10T-E | Human | Esophagus | ESCC | 3.13e-72 | 1.26e+00 | 0.116 |
| 203547 | VMA21 | P11T-E | Human | Esophagus | ESCC | 2.58e-12 | 4.95e-01 | 0.1426 |
| 203547 | VMA21 | P12T-E | Human | Esophagus | ESCC | 3.84e-37 | 7.91e-01 | 0.1122 |
| 203547 | VMA21 | P15T-E | Human | Esophagus | ESCC | 9.74e-41 | 9.24e-01 | 0.1149 |
| 203547 | VMA21 | P16T-E | Human | Esophagus | ESCC | 3.22e-15 | 2.28e-01 | 0.1153 |
| 203547 | VMA21 | P17T-E | Human | Esophagus | ESCC | 4.78e-06 | 5.08e-01 | 0.1278 |
| 203547 | VMA21 | P19T-E | Human | Esophagus | ESCC | 3.73e-11 | 1.35e+00 | 0.1662 |
| Page: 1 2 3 4 5 6 |
| Tissue | Expression Dynamics | Abbreviation |
| Esophagus |  | ESCC: Esophageal squamous cell carcinoma |
| HGIN: High-grade intraepithelial neoplasias | ||
| LGIN: Low-grade intraepithelial neoplasias | ||
| Liver | 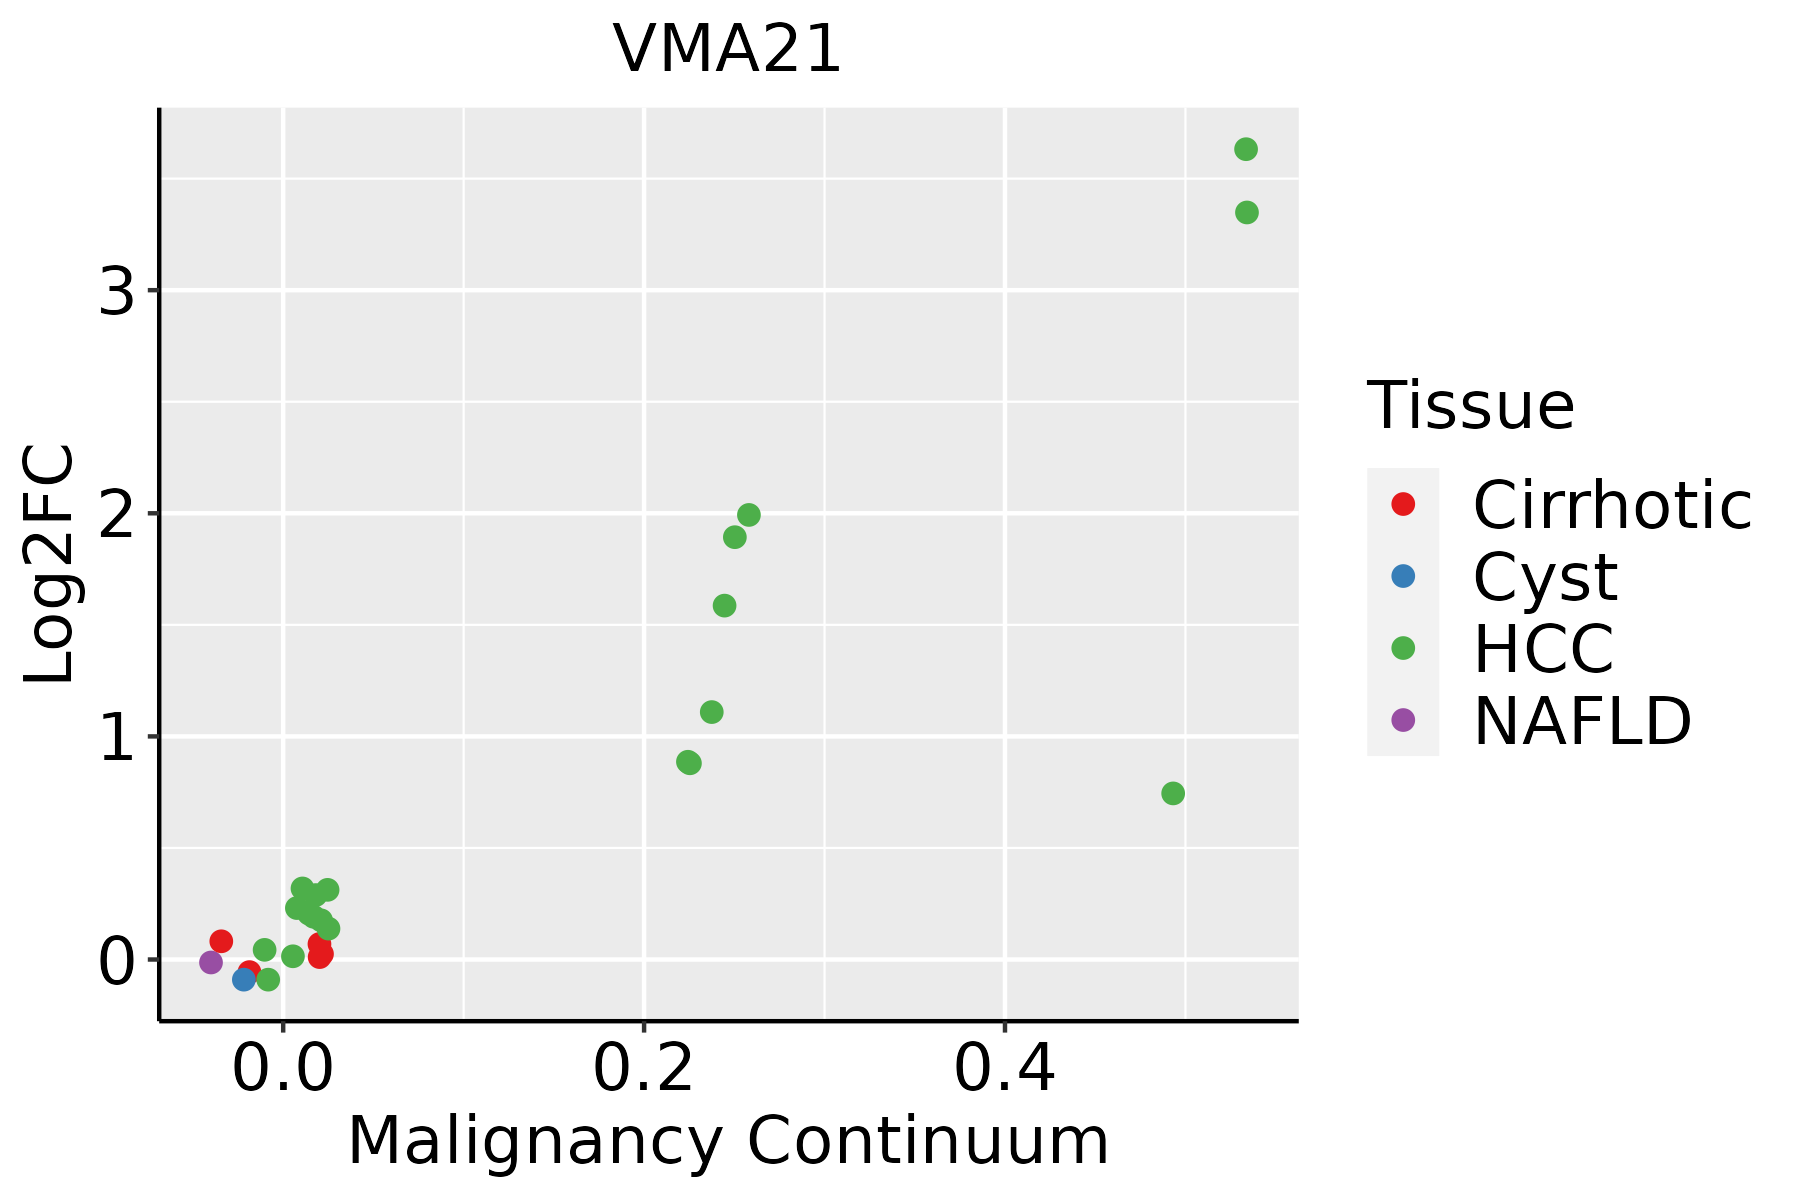 | HCC: Hepatocellular carcinoma |
| NAFLD: Non-alcoholic fatty liver disease | ||
| Oral Cavity |  | EOLP: Erosive Oral lichen planus |
| LP: leukoplakia | ||
| NEOLP: Non-erosive oral lichen planus | ||
| OSCC: Oral squamous cell carcinoma | ||
| Skin | 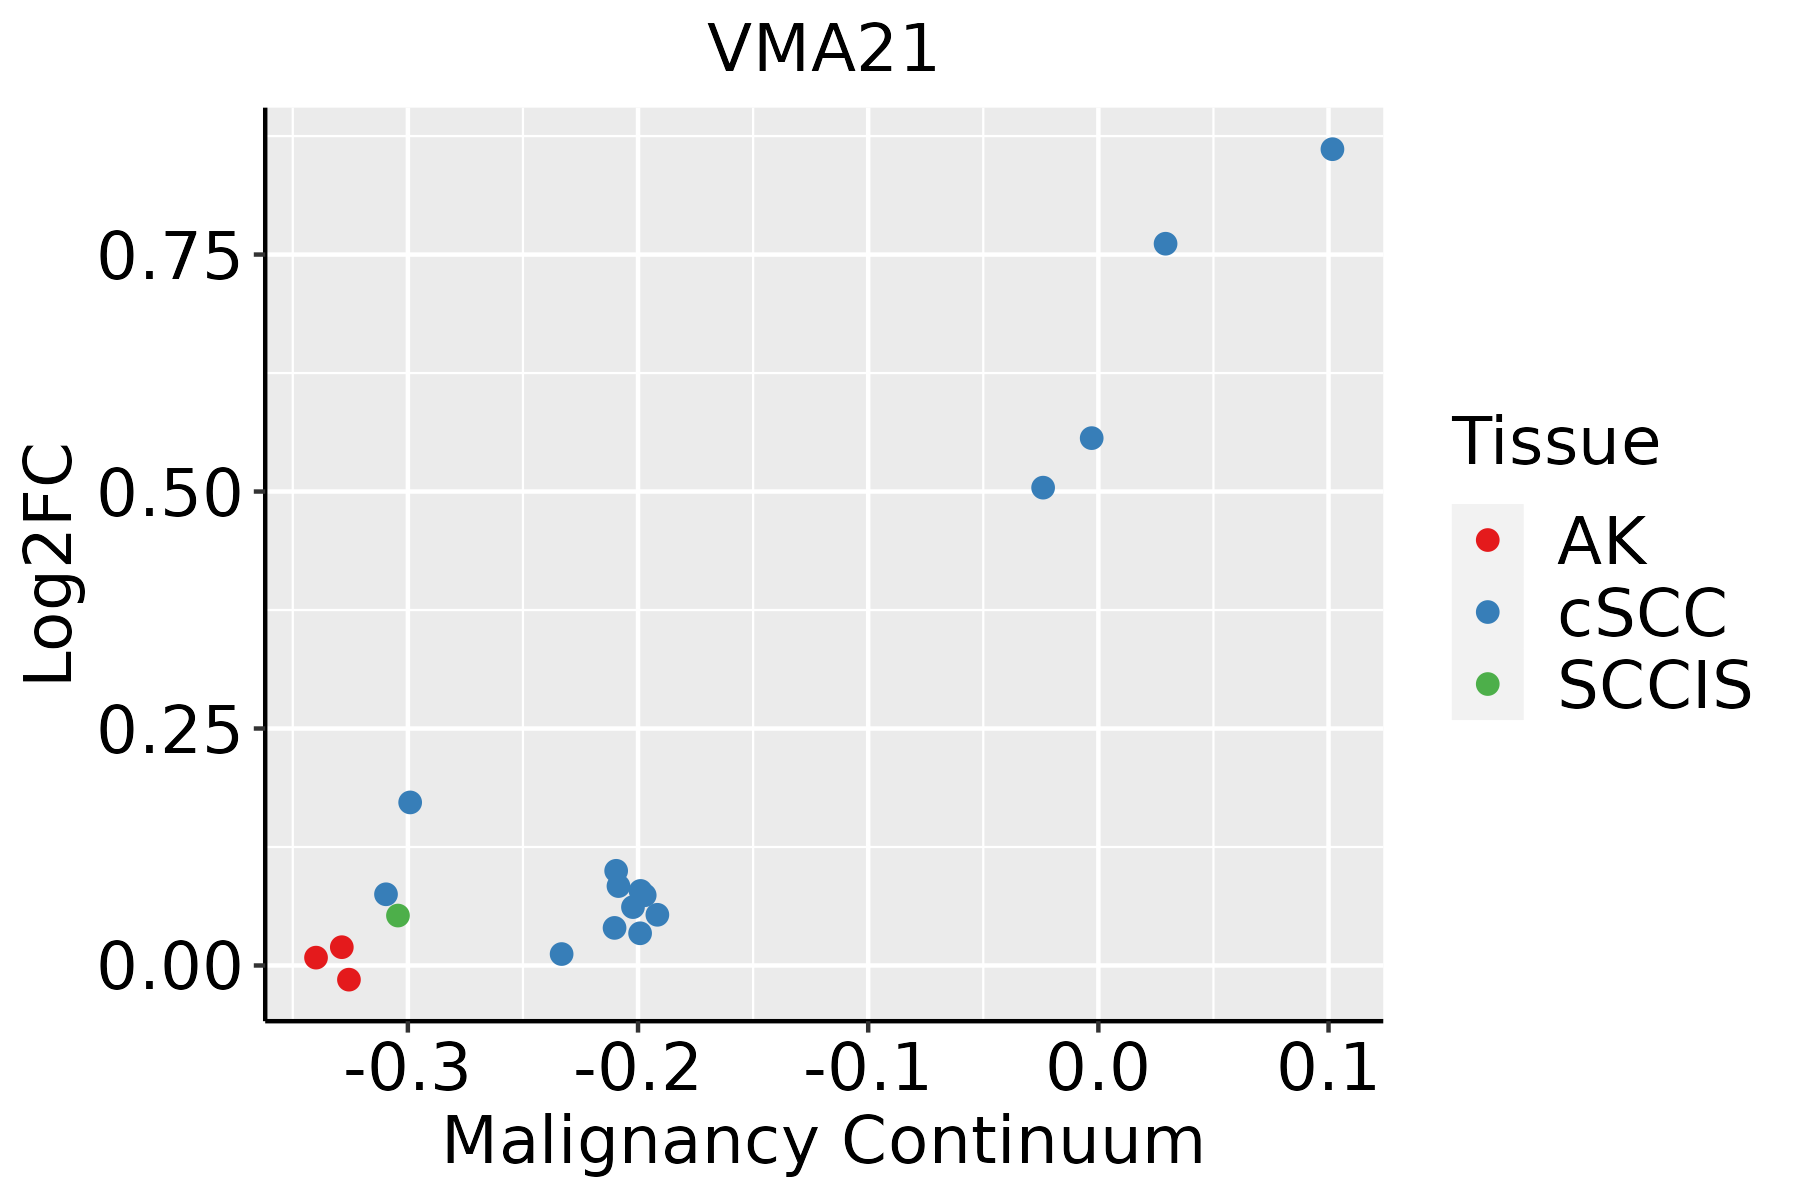 | AK: Actinic keratosis |
| cSCC: Cutaneous squamous cell carcinoma | ||
| SCCIS:squamous cell carcinoma in situ | ||
| Thyroid | 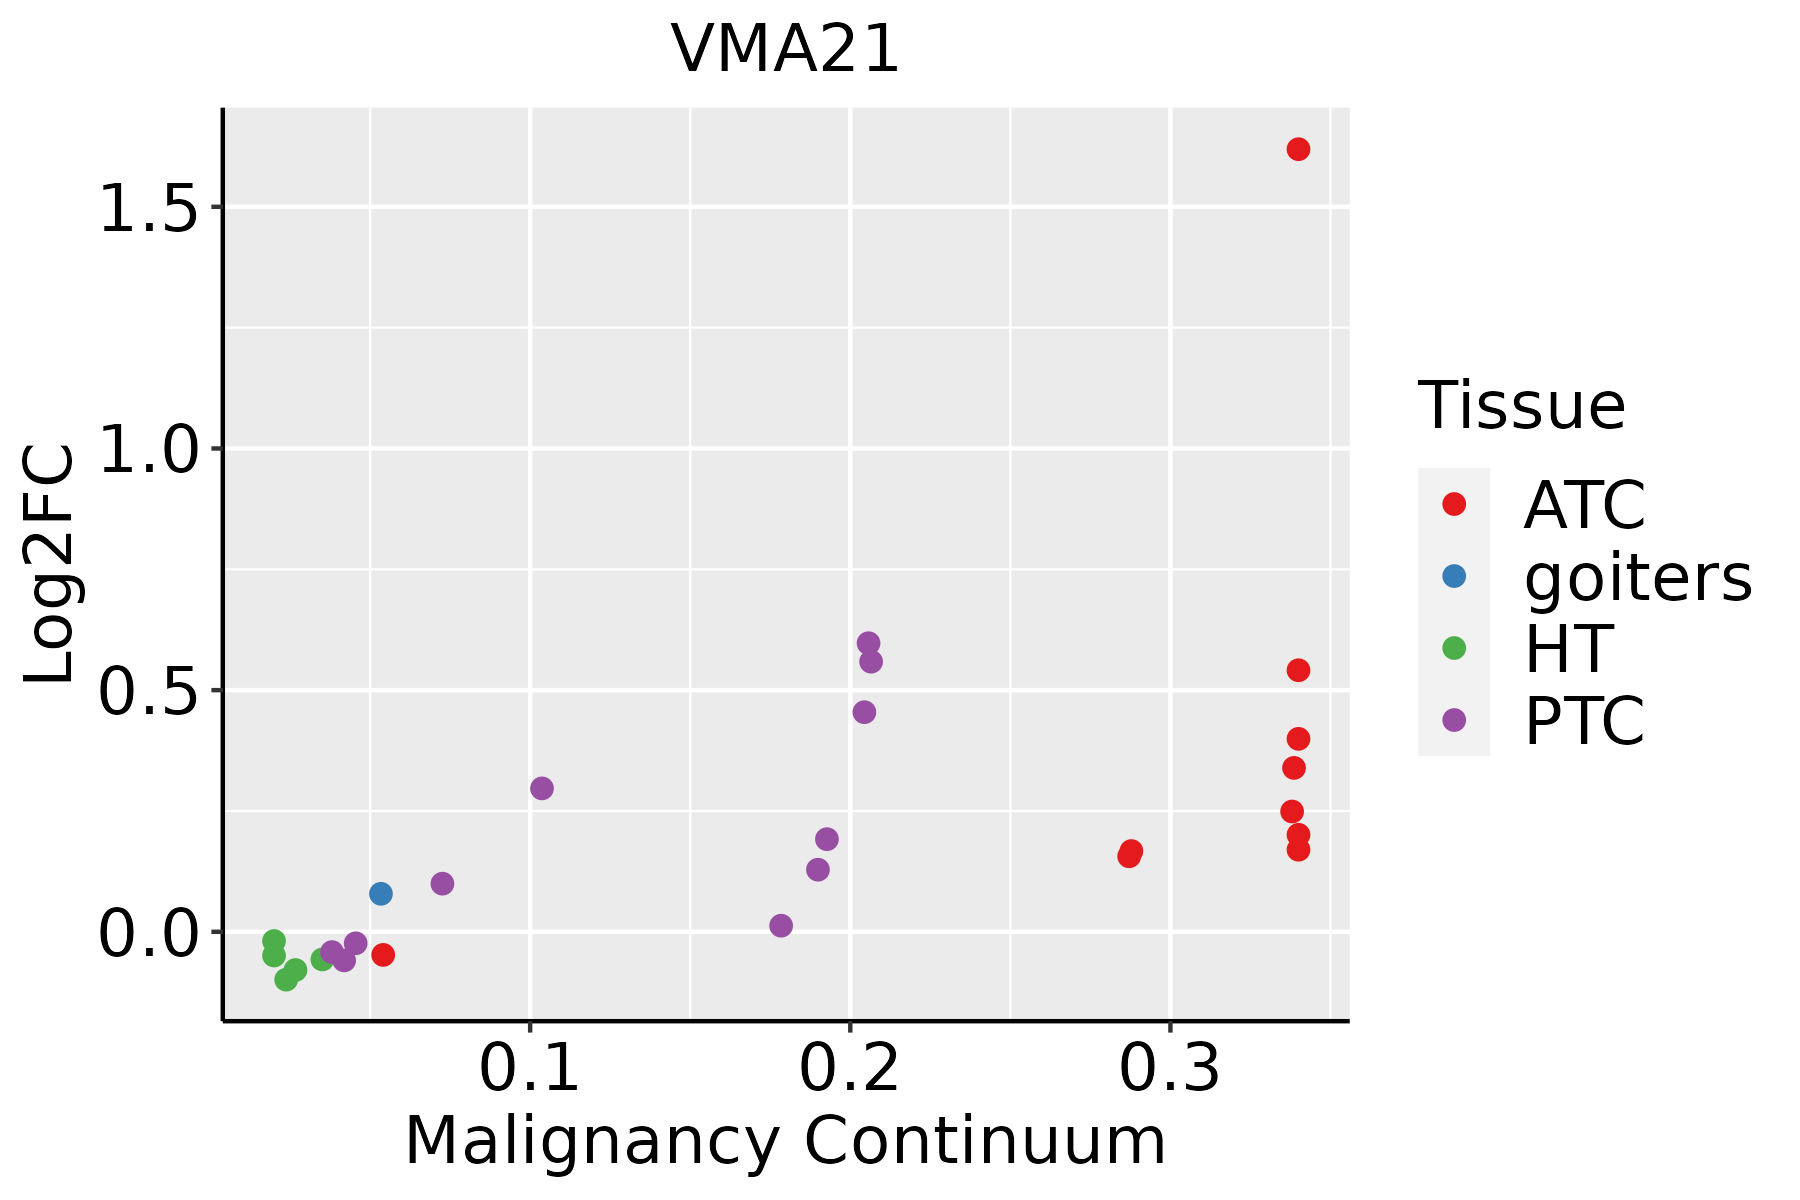 | ATC: Anaplastic thyroid cancer |
| HT: Hashimoto's thyroiditis | ||
| PTC: Papillary thyroid cancer |
| ∗log2FC in expression of this searched gene in stem-like cells from each diseased tissue sample relative to stem-like cells in normal samples in each tissue plotted against the malignancy continuum. Samples are colored based on if they are from different disease stage. |
Top |
Malignant transformation related pathway analysis |
| Find out the enriched GO biological processes and KEGG pathways involved in transition from healthy to precancer to cancer |
| Tissue | Disease Stage | Enriched GO biological Processes |
| Colorectum | AD |  |
| Colorectum | SER |  |
| Colorectum | MSS |  |
| Colorectum | MSI-H |  |
| Colorectum | FAP |  |
| ∗Top 15 enriched GO BP terms are showed in the bar plot of each disease state in each tissue. Each row represents a significant GO biological process which is colored according to the -log10(p.adjust). |
| Page: 1 2 3 4 5 6 7 8 9 |
| GO ID | Tissue | Disease Stage | Description | Gene Ratio | Bg Ratio | pvalue | p.adjust | Count |
| GO:00434627 | Esophagus | ESCC | regulation of ATPase activity | 30/8552 | 46/18723 | 5.91e-03 | 2.18e-02 | 30 |
| GO:00700711 | Esophagus | ESCC | proton-transporting two-sector ATPase complex assembly | 12/8552 | 15/18723 | 7.31e-03 | 2.63e-02 | 12 |
| GO:00434623 | Liver | Cirrhotic | regulation of ATPase activity | 21/4634 | 46/18723 | 1.61e-03 | 1.04e-02 | 21 |
| GO:0070071 | Liver | HCC | proton-transporting two-sector ATPase complex assembly | 12/7958 | 15/18723 | 3.56e-03 | 1.59e-02 | 12 |
| GO:004346211 | Liver | HCC | regulation of ATPase activity | 29/7958 | 46/18723 | 3.95e-03 | 1.74e-02 | 29 |
| GO:00434626 | Oral cavity | OSCC | regulation of ATPase activity | 27/7305 | 46/18723 | 5.33e-03 | 2.07e-02 | 27 |
| GO:00434628 | Skin | cSCC | regulation of ATPase activity | 22/4864 | 46/18723 | 1.16e-03 | 7.61e-03 | 22 |
| GO:00700712 | Thyroid | PTC | proton-transporting two-sector ATPase complex assembly | 11/5968 | 15/18723 | 1.19e-03 | 6.84e-03 | 11 |
| GO:00434629 | Thyroid | PTC | regulation of ATPase activity | 23/5968 | 46/18723 | 7.89e-03 | 3.33e-02 | 23 |
| GO:007007111 | Thyroid | ATC | proton-transporting two-sector ATPase complex assembly | 11/6293 | 15/18723 | 1.94e-03 | 9.41e-03 | 11 |
| Page: 1 |
| Pathway ID | Tissue | Disease Stage | Description | Gene Ratio | Bg Ratio | pvalue | p.adjust | qvalue | Count |
| Page: 1 |
Top |
Cell-cell communication analysis |
| Identification of potential cell-cell interactions between two cell types and their ligand-receptor pairs for different disease states |
| Ligand | Receptor | LRpair | Pathway | Tissue | Disease Stage |
| Page: 1 |
Top |
Single-cell gene regulatory network inference analysis |
| Find out the significant the regulons (TFs) and the target genes of each regulon across cell types for different disease states |
| TF | Cell Type | Tissue | Disease Stage | Target Gene | RSS | Regulon Activity |
| ∗The dot plots of a searched regulon are shown for all cell subpopulations in each disease state of each tissue based on the regulon specific score inferred using pySCENIC and by calculating the average expression. |
| Page: 1 |
Top |
Somatic mutation of malignant transformation related genes |
| Annotation of somatic variants for genes involved in malignant transformation |
| Hugo Symbol | Variant Class | Variant Classification | dbSNP RS | HGVSc | HGVSp | HGVSp Short | SWISSPROT | BIOTYPE | SIFT | PolyPhen | Tumor Sample Barcode | Tissue | Histology | Sex | Age | Stage | Therapy Types | Drugs | Outcome |
| VMA21 | SNV | Missense_Mutation | c.202G>A | p.Ala68Thr | p.A68T | Q3ZAQ7 | protein_coding | deleterious(0) | probably_damaging(0.994) | TCGA-A5-A0G9-01 | Endometrium | uterine corpus endometrioid carcinoma | Female | >=65 | I/II | Unknown | Unknown | SD | |
| VMA21 | SNV | Missense_Mutation | c.121N>A | p.Pro41Thr | p.P41T | Q3ZAQ7 | protein_coding | deleterious(0) | probably_damaging(0.998) | TCGA-AP-A056-01 | Endometrium | uterine corpus endometrioid carcinoma | Female | <65 | I/II | Unknown | Unknown | SD | |
| VMA21 | SNV | Missense_Mutation | c.287G>A | p.Arg96His | p.R96H | Q3ZAQ7 | protein_coding | deleterious(0.04) | possibly_damaging(0.511) | TCGA-B5-A3FA-01 | Endometrium | uterine corpus endometrioid carcinoma | Female | >=65 | I/II | Unknown | Unknown | SD | |
| VMA21 | SNV | Missense_Mutation | novel | c.264N>T | p.Trp88Cys | p.W88C | Q3ZAQ7 | protein_coding | deleterious(0) | probably_damaging(0.998) | TCGA-BK-A6W3-01 | Endometrium | uterine corpus endometrioid carcinoma | Female | <65 | I/II | Unknown | Unknown | SD |
| VMA21 | SNV | Missense_Mutation | novel | c.128G>A | p.Gly43Glu | p.G43E | Q3ZAQ7 | protein_coding | deleterious(0.01) | probably_damaging(0.999) | TCGA-BS-A0V4-01 | Endometrium | uterine corpus endometrioid carcinoma | Female | <65 | I/II | Unknown | Unknown | SD |
| VMA21 | SNV | Missense_Mutation | rs376099956 | c.226G>A | p.Val76Ile | p.V76I | Q3ZAQ7 | protein_coding | tolerated(0.08) | probably_damaging(0.984) | TCGA-EO-A22U-01 | Endometrium | uterine corpus endometrioid carcinoma | Female | >=65 | I/II | Unknown | Unknown | SD |
| VMA21 | SNV | Missense_Mutation | rs140025330 | c.166N>A | p.Ala56Thr | p.A56T | Q3ZAQ7 | protein_coding | tolerated(0.42) | benign(0) | TCGA-SJ-A6ZI-01 | Endometrium | uterine corpus endometrioid carcinoma | Female | <65 | I/II | Unknown | Unknown | SD |
| VMA21 | SNV | Missense_Mutation | c.65N>T | p.Ser22Leu | p.S22L | Q3ZAQ7 | protein_coding | deleterious(0) | probably_damaging(0.95) | TCGA-55-6982-01 | Lung | lung adenocarcinoma | Female | >=65 | I/II | Chemotherapy | gemzar | PD | |
| VMA21 | SNV | Missense_Mutation | c.285G>T | p.Trp95Cys | p.W95C | Q3ZAQ7 | protein_coding | deleterious(0.01) | possibly_damaging(0.669) | TCGA-55-6987-01 | Lung | lung adenocarcinoma | Male | >=65 | I/II | Unknown | Unknown | SD | |
| VMA21 | SNV | Missense_Mutation | c.65N>T | p.Ser22Leu | p.S22L | Q3ZAQ7 | protein_coding | deleterious(0) | probably_damaging(0.95) | TCGA-97-7938-01 | Lung | lung adenocarcinoma | Female | >=65 | I/II | Unknown | Unknown | SD |
| Page: 1 2 |
Top |
Related drugs of malignant transformation related genes |
| Identification of chemicals and drugs interact with genes involved in malignant transfromation |
| (DGIdb 4.0) |
| Entrez ID | Symbol | Category | Interaction Types | Drug Claim Name | Drug Name | PMIDs |
| Page: 1 |

Copyright 2023-Present -The University of Texas Health Science Center at Houston |