| Tissue | Expression Dynamics | Abbreviation |
| Cervix | 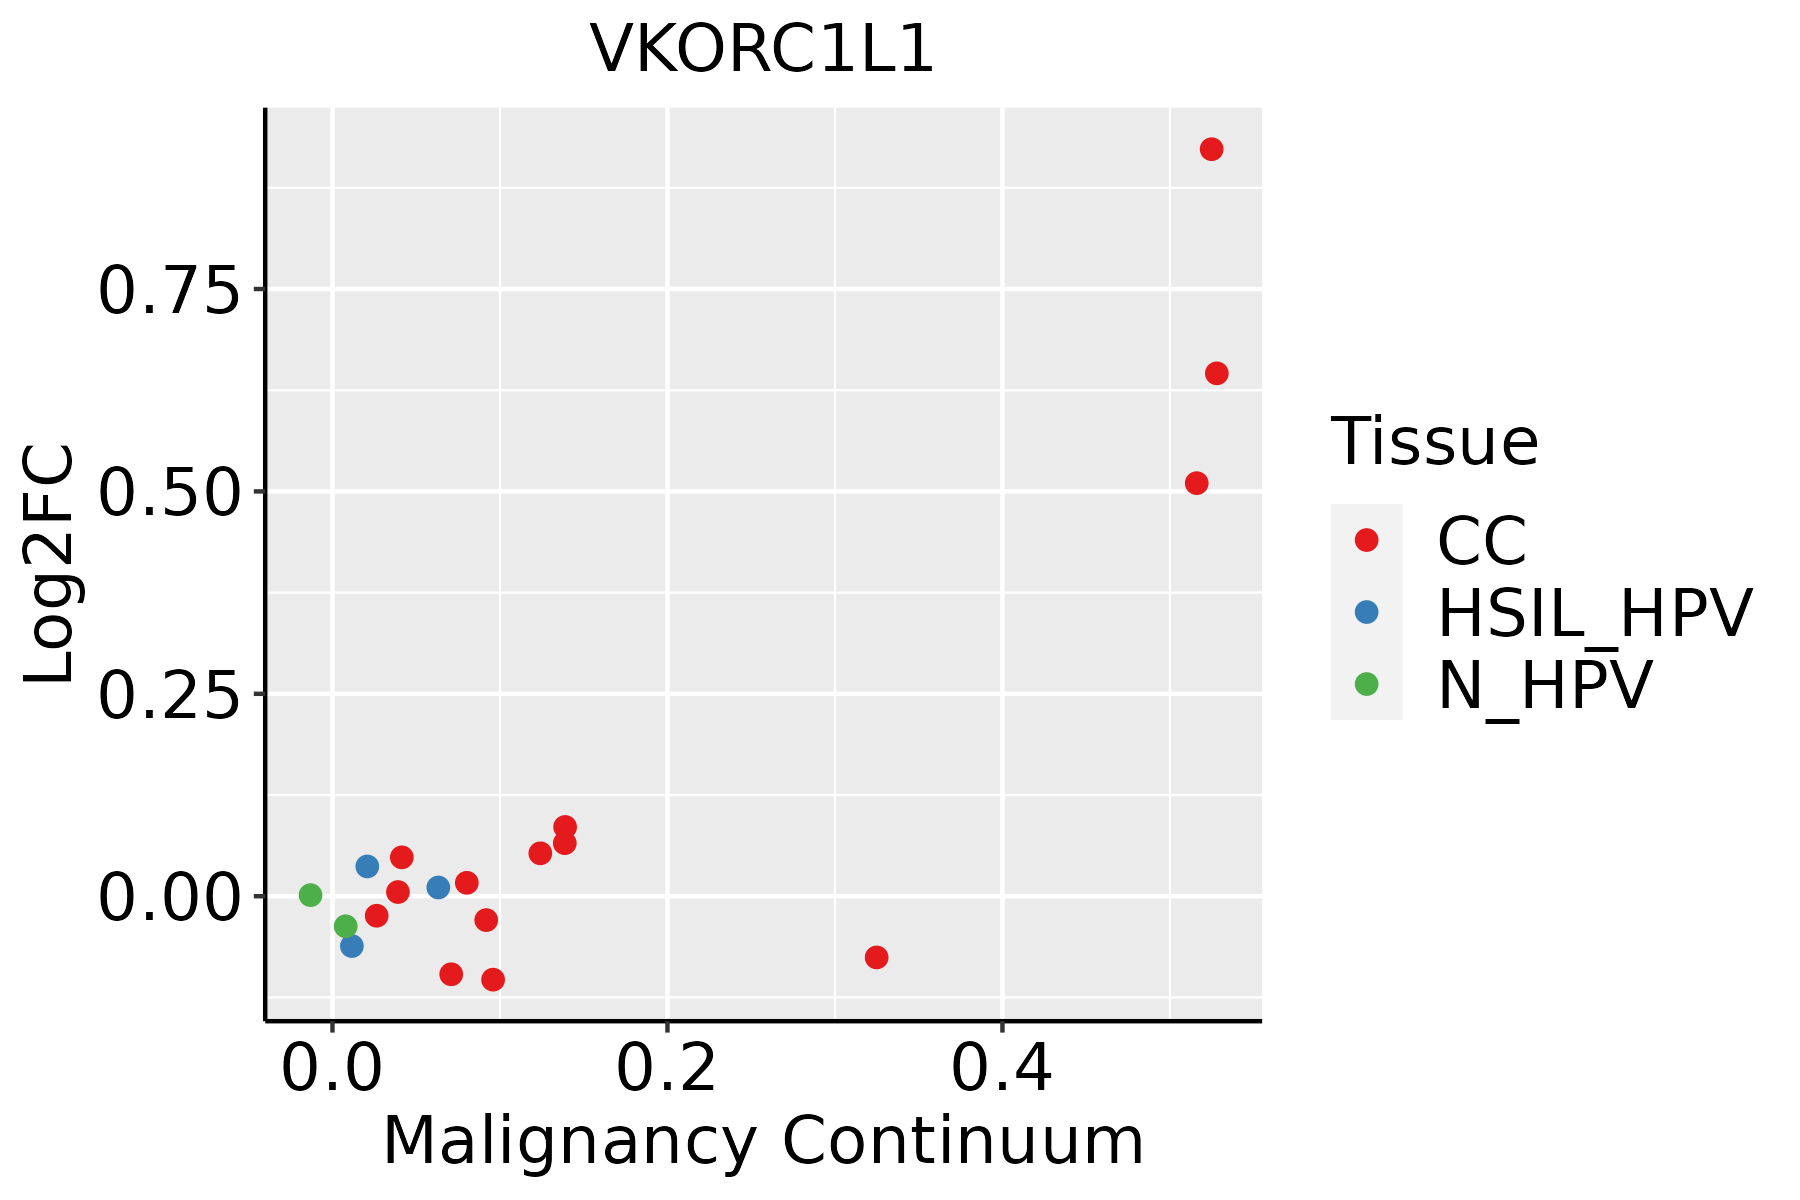 | CC: Cervix cancer |
| HSIL_HPV: HPV-infected high-grade squamous intraepithelial lesions |
| N_HPV: HPV-infected normal cervix |
| Esophagus | 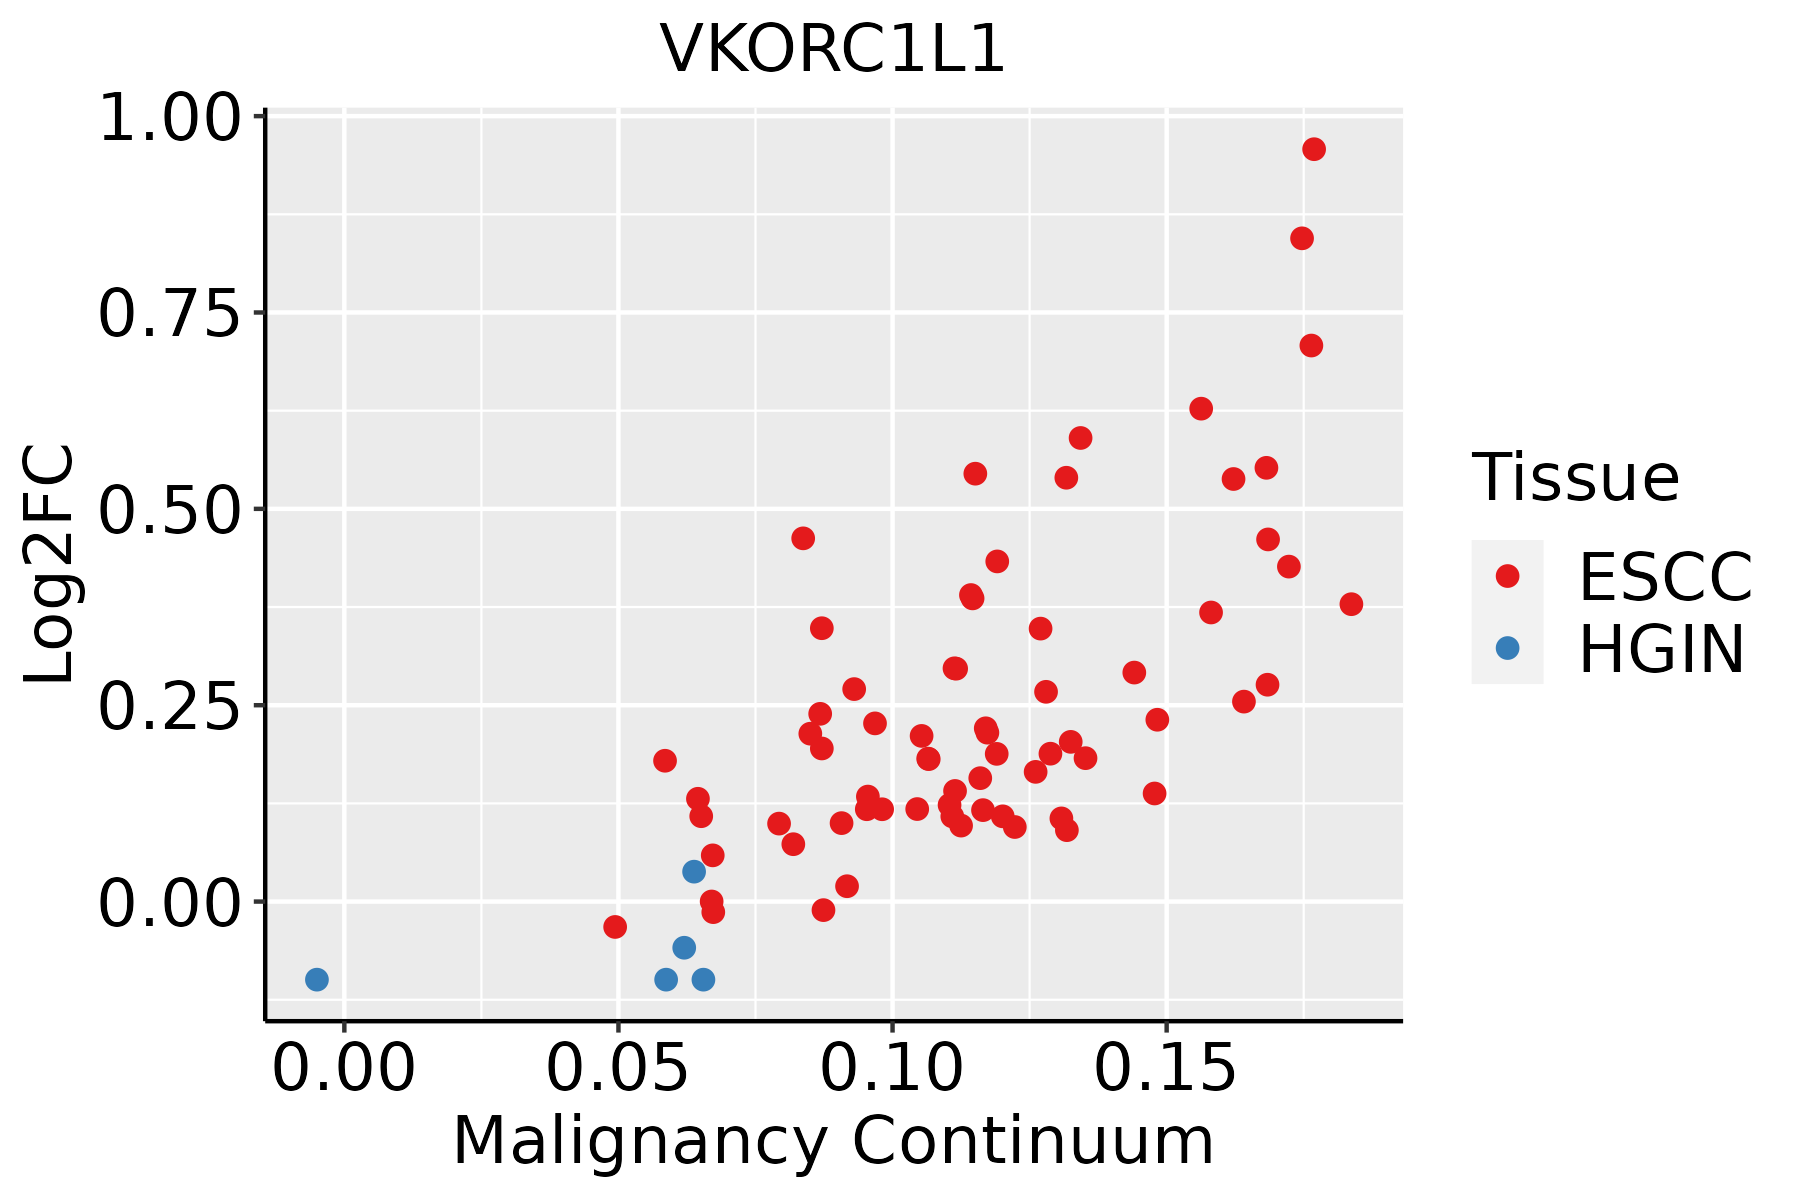 | ESCC: Esophageal squamous cell carcinoma |
| HGIN: High-grade intraepithelial neoplasias |
| LGIN: Low-grade intraepithelial neoplasias |
| Liver | 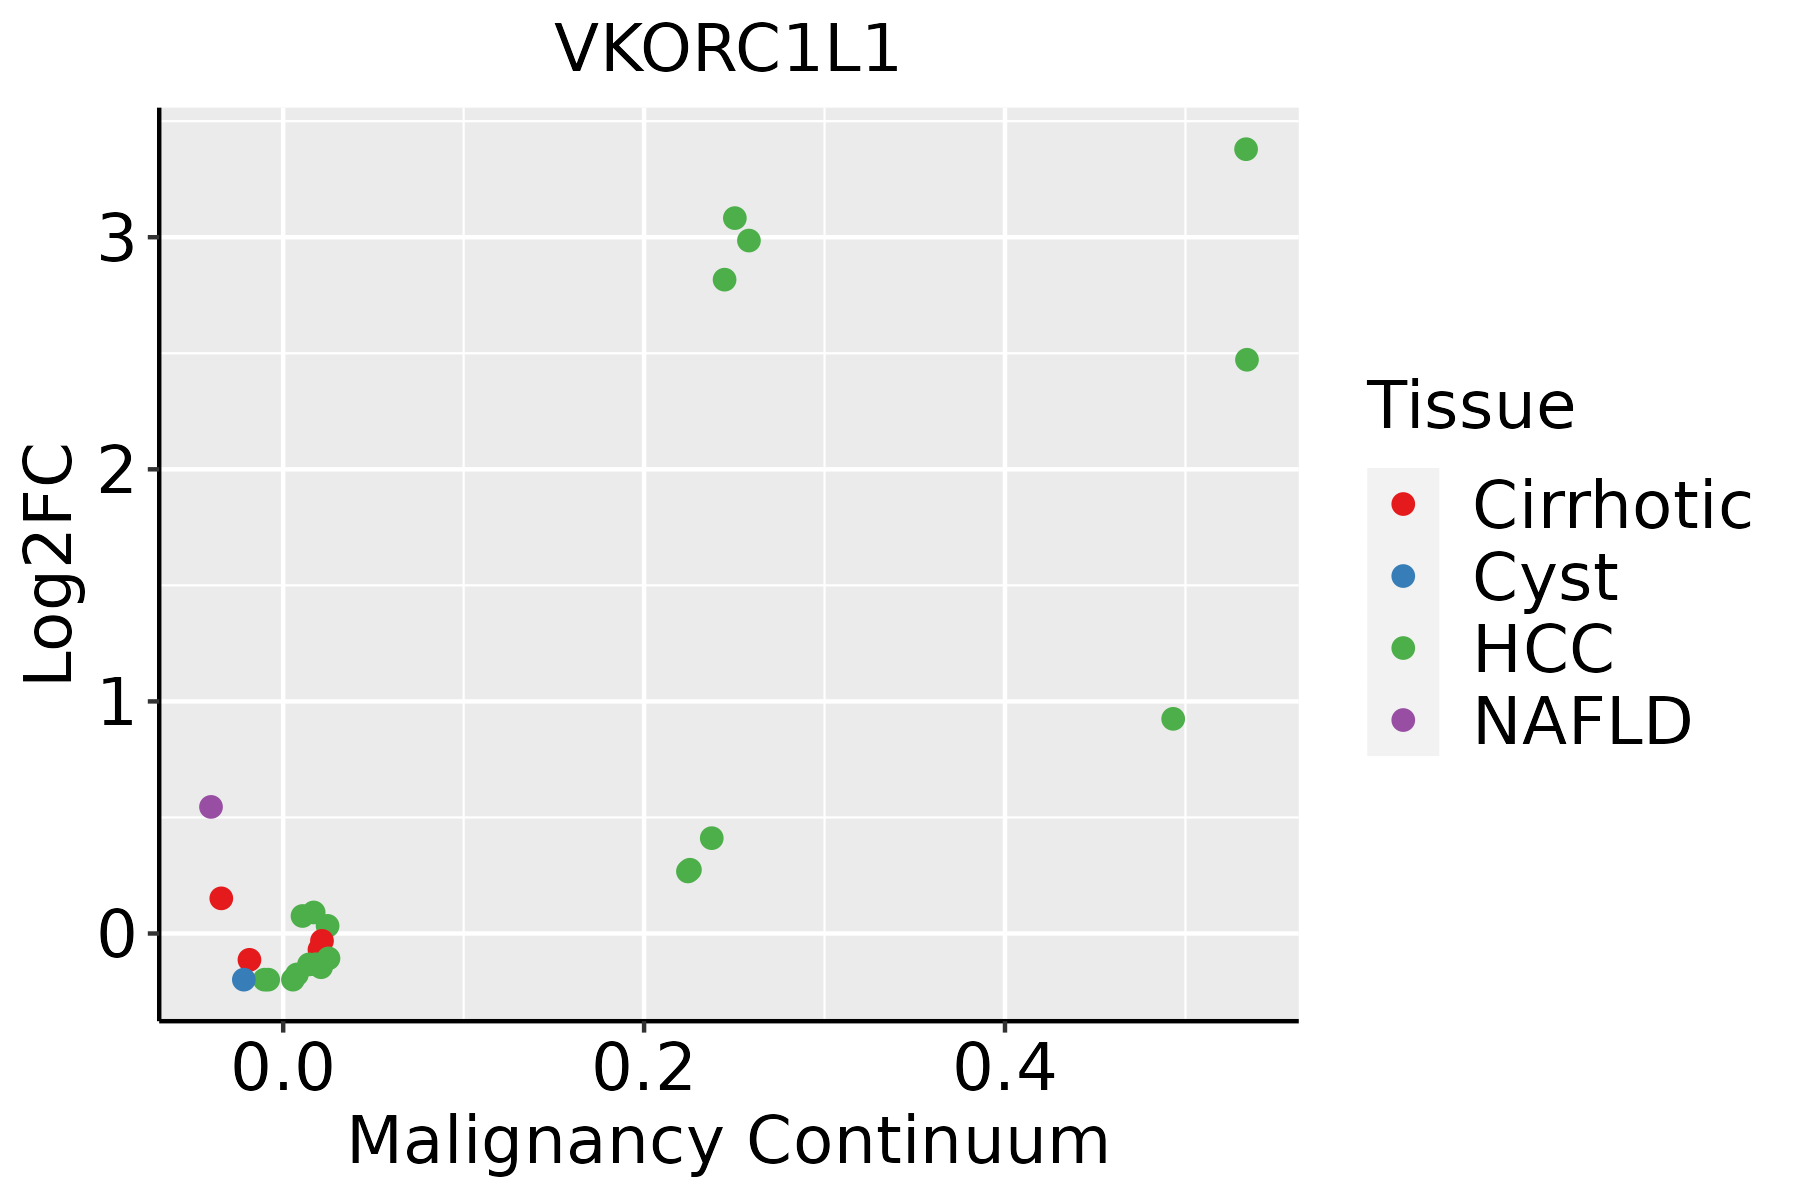 | HCC: Hepatocellular carcinoma |
| NAFLD: Non-alcoholic fatty liver disease |
| Lung | 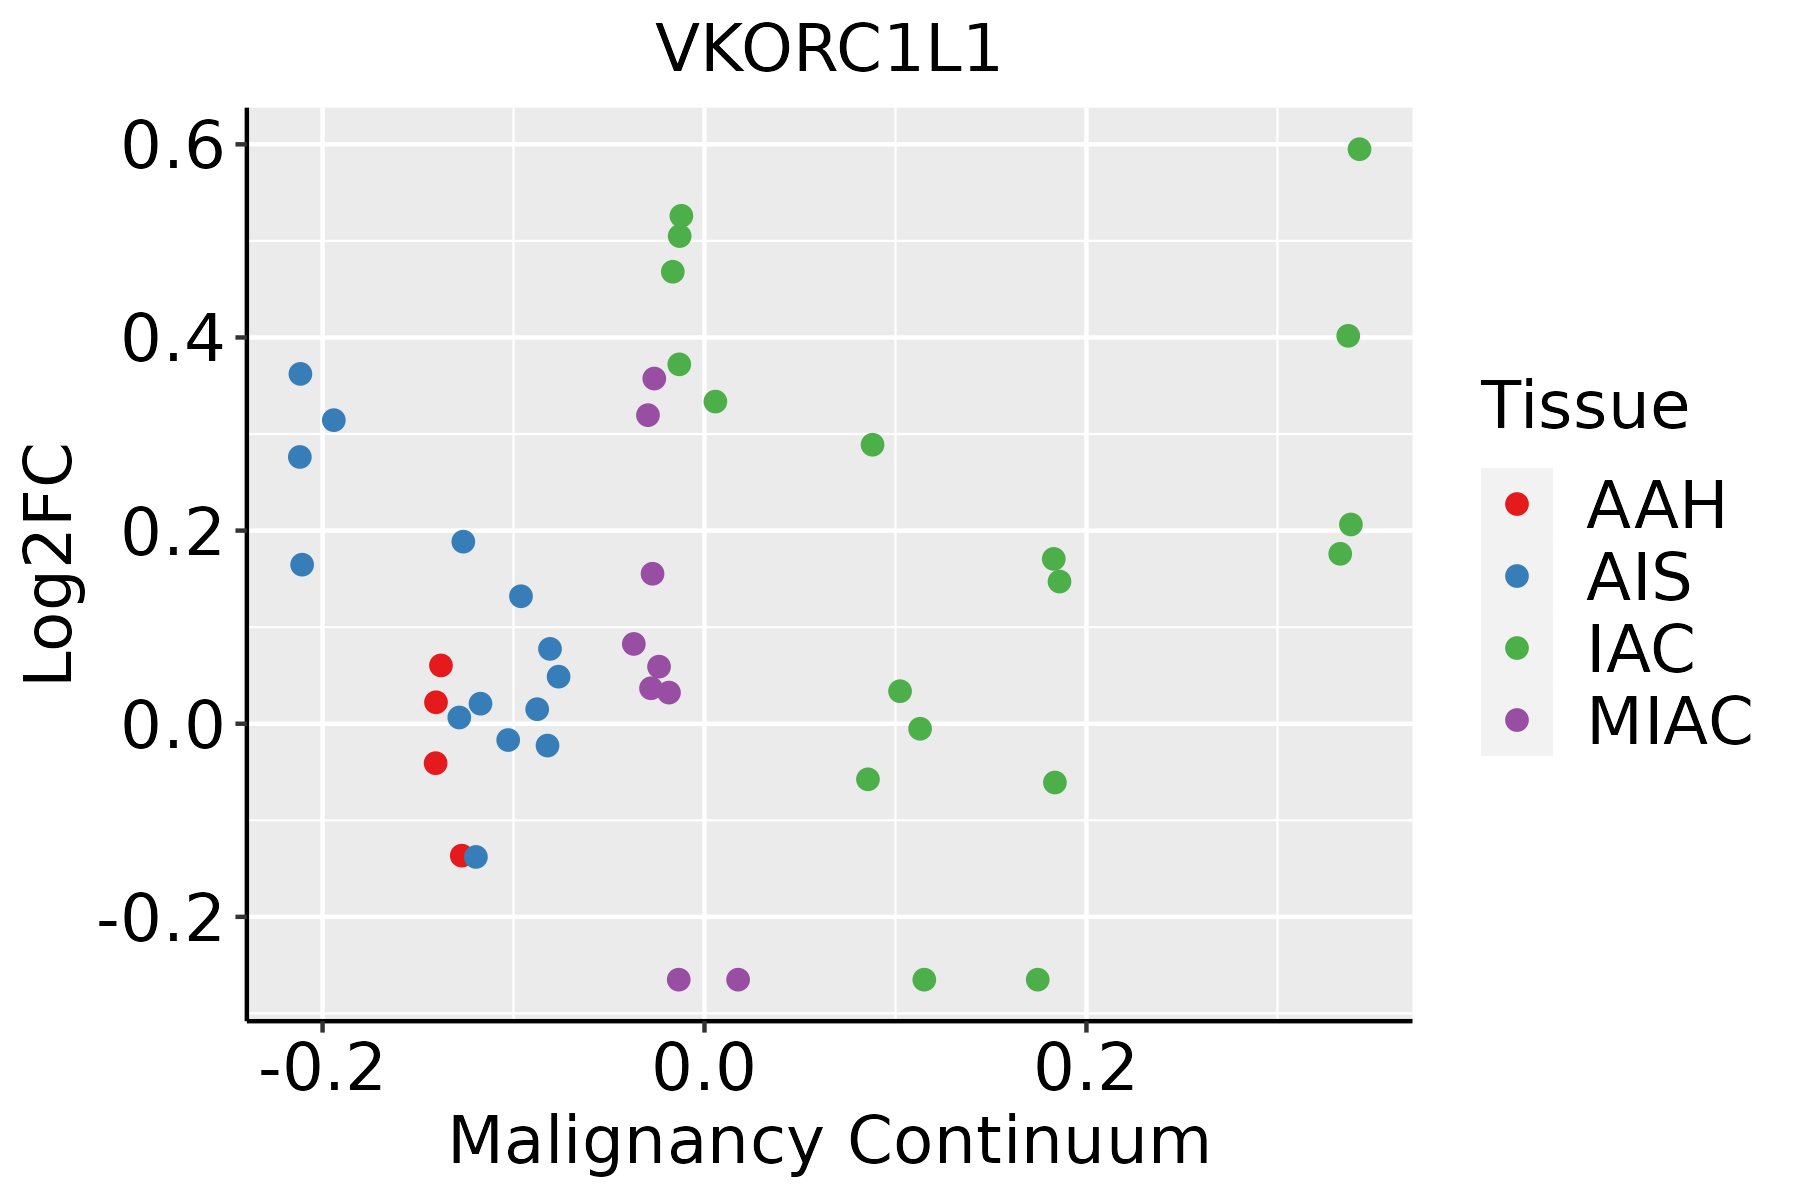 | AAH: Atypical adenomatous hyperplasia |
| AIS: Adenocarcinoma in situ |
| IAC: Invasive lung adenocarcinoma |
| MIA: Minimally invasive adenocarcinoma |
| Oral Cavity |  | EOLP: Erosive Oral lichen planus |
| LP: leukoplakia |
| NEOLP: Non-erosive oral lichen planus |
| OSCC: Oral squamous cell carcinoma |
| Thyroid |  | ATC: Anaplastic thyroid cancer |
| HT: Hashimoto's thyroiditis |
| PTC: Papillary thyroid cancer |
| GO ID | Tissue | Disease Stage | Description | Gene Ratio | Bg Ratio | pvalue | p.adjust | Count |
| GO:000697910 | Cervix | CC | response to oxidative stress | 102/2311 | 446/18723 | 2.99e-10 | 4.36e-08 | 102 |
| GO:006219710 | Cervix | CC | cellular response to chemical stress | 76/2311 | 337/18723 | 1.01e-07 | 5.25e-06 | 76 |
| GO:003459910 | Cervix | CC | cellular response to oxidative stress | 63/2311 | 288/18723 | 3.58e-06 | 9.50e-05 | 63 |
| GO:0006979111 | Esophagus | ESCC | response to oxidative stress | 303/8552 | 446/18723 | 7.15e-22 | 1.30e-19 | 303 |
| GO:0062197111 | Esophagus | ESCC | cellular response to chemical stress | 234/8552 | 337/18723 | 5.37e-19 | 5.97e-17 | 234 |
| GO:0034599111 | Esophagus | ESCC | cellular response to oxidative stress | 197/8552 | 288/18723 | 3.76e-15 | 2.15e-13 | 197 |
| GO:190166112 | Esophagus | ESCC | quinone metabolic process | 34/8552 | 40/18723 | 3.00e-07 | 4.27e-06 | 34 |
| GO:00067661 | Esophagus | ESCC | vitamin metabolic process | 67/8552 | 106/18723 | 2.03e-04 | 1.28e-03 | 67 |
| GO:00421805 | Esophagus | ESCC | cellular ketone metabolic process | 120/8552 | 211/18723 | 6.70e-04 | 3.55e-03 | 120 |
| GO:00069797 | Liver | NAFLD | response to oxidative stress | 78/1882 | 446/18723 | 7.85e-07 | 4.29e-05 | 78 |
| GO:00621977 | Liver | NAFLD | cellular response to chemical stress | 54/1882 | 337/18723 | 3.83e-04 | 5.73e-03 | 54 |
| GO:00345997 | Liver | NAFLD | cellular response to oxidative stress | 46/1882 | 288/18723 | 1.07e-03 | 1.25e-02 | 46 |
| GO:00421803 | Liver | NAFLD | cellular ketone metabolic process | 35/1882 | 211/18723 | 2.09e-03 | 2.06e-02 | 35 |
| GO:000697912 | Liver | Cirrhotic | response to oxidative stress | 196/4634 | 446/18723 | 2.80e-19 | 5.86e-17 | 196 |
| GO:006219712 | Liver | Cirrhotic | cellular response to chemical stress | 147/4634 | 337/18723 | 1.84e-14 | 1.72e-12 | 147 |
| GO:003459912 | Liver | Cirrhotic | cellular response to oxidative stress | 127/4634 | 288/18723 | 4.29e-13 | 3.32e-11 | 127 |
| GO:004218011 | Liver | Cirrhotic | cellular ketone metabolic process | 80/4634 | 211/18723 | 1.40e-05 | 1.95e-04 | 80 |
| GO:19016612 | Liver | Cirrhotic | quinone metabolic process | 18/4634 | 40/18723 | 4.11e-03 | 2.20e-02 | 18 |
| GO:000697922 | Liver | HCC | response to oxidative stress | 281/7958 | 446/18723 | 9.75e-19 | 1.24e-16 | 281 |
| GO:006219722 | Liver | HCC | cellular response to chemical stress | 216/7958 | 337/18723 | 6.86e-16 | 5.44e-14 | 216 |
| Pathway ID | Tissue | Disease Stage | Description | Gene Ratio | Bg Ratio | pvalue | p.adjust | qvalue | Count |
| hsa012405 | Esophagus | ESCC | Biosynthesis of cofactors | 97/4205 | 153/8465 | 3.88e-04 | 1.35e-03 | 6.94e-04 | 97 |
| hsa0124012 | Esophagus | ESCC | Biosynthesis of cofactors | 97/4205 | 153/8465 | 3.88e-04 | 1.35e-03 | 6.94e-04 | 97 |
| hsa01240 | Liver | Cirrhotic | Biosynthesis of cofactors | 66/2530 | 153/8465 | 3.11e-04 | 1.99e-03 | 1.23e-03 | 66 |
| hsa012401 | Liver | Cirrhotic | Biosynthesis of cofactors | 66/2530 | 153/8465 | 3.11e-04 | 1.99e-03 | 1.23e-03 | 66 |
| hsa012402 | Liver | HCC | Biosynthesis of cofactors | 103/4020 | 153/8465 | 4.67e-07 | 5.05e-06 | 2.81e-06 | 103 |
| hsa012403 | Liver | HCC | Biosynthesis of cofactors | 103/4020 | 153/8465 | 4.67e-07 | 5.05e-06 | 2.81e-06 | 103 |
| hsa012404 | Oral cavity | OSCC | Biosynthesis of cofactors | 88/3704 | 153/8465 | 3.84e-04 | 1.20e-03 | 6.12e-04 | 88 |
| hsa00130 | Oral cavity | OSCC | Ubiquinone and other terpenoid-quinone biosynthesis | 9/3704 | 11/8465 | 1.19e-02 | 2.62e-02 | 1.33e-02 | 9 |
| hsa0124011 | Oral cavity | OSCC | Biosynthesis of cofactors | 88/3704 | 153/8465 | 3.84e-04 | 1.20e-03 | 6.12e-04 | 88 |
| hsa001301 | Oral cavity | OSCC | Ubiquinone and other terpenoid-quinone biosynthesis | 9/3704 | 11/8465 | 1.19e-02 | 2.62e-02 | 1.33e-02 | 9 |
| hsa001302 | Oral cavity | LP | Ubiquinone and other terpenoid-quinone biosynthesis | 8/2418 | 11/8465 | 3.03e-03 | 1.29e-02 | 8.35e-03 | 8 |
| hsa0124021 | Oral cavity | LP | Biosynthesis of cofactors | 57/2418 | 153/8465 | 1.17e-02 | 3.91e-02 | 2.52e-02 | 57 |
| hsa001303 | Oral cavity | LP | Ubiquinone and other terpenoid-quinone biosynthesis | 8/2418 | 11/8465 | 3.03e-03 | 1.29e-02 | 8.35e-03 | 8 |
| hsa0124031 | Oral cavity | LP | Biosynthesis of cofactors | 57/2418 | 153/8465 | 1.17e-02 | 3.91e-02 | 2.52e-02 | 57 |
| Hugo Symbol | Variant Class | Variant Classification | dbSNP RS | HGVSc | HGVSp | HGVSp Short | SWISSPROT | BIOTYPE | SIFT | PolyPhen | Tumor Sample Barcode | Tissue | Histology | Sex | Age | Stage | Therapy Types | Drugs | Outcome |
| VKORC1L1 | SNV | Missense_Mutation | novel | c.127N>A | p.Asp43Asn | p.D43N | Q8N0U8 | protein_coding | tolerated(0.07) | probably_damaging(0.918) | TCGA-C5-A2LV-01 | Cervix | cervical & endocervical cancer | Female | <65 | I/II | Unknown | Unknown | SD |
| VKORC1L1 | SNV | Missense_Mutation | | c.319N>T | p.Arg107Cys | p.R107C | Q8N0U8 | protein_coding | deleterious_low_confidence(0.01) | benign(0) | TCGA-JW-A5VI-01 | Cervix | cervical & endocervical cancer | Female | <65 | I/II | Chemotherapy | topotecan | PD |
| VKORC1L1 | SNV | Missense_Mutation | | c.395N>T | p.Ala132Val | p.A132V | Q8N0U8 | protein_coding | deleterious_low_confidence(0) | benign(0.06) | TCGA-AZ-4313-01 | Colorectum | colon adenocarcinoma | Female | <65 | I/II | Unknown | Unknown | SD |
| VKORC1L1 | SNV | Missense_Mutation | | c.281N>A | p.Ser94Tyr | p.S94Y | Q8N0U8 | protein_coding | deleterious_low_confidence(0) | benign(0.022) | TCGA-AP-A059-01 | Endometrium | uterine corpus endometrioid carcinoma | Female | >=65 | I/II | Unknown | Unknown | SD |
| VKORC1L1 | SNV | Missense_Mutation | | c.365C>T | p.Thr122Met | p.T122M | Q8N0U8 | protein_coding | tolerated_low_confidence(0.07) | probably_damaging(0.974) | TCGA-AX-A0J0-01 | Endometrium | uterine corpus endometrioid carcinoma | Female | <65 | I/II | Unknown | Unknown | SD |
| VKORC1L1 | SNV | Missense_Mutation | novel | c.209N>A | p.Arg70His | p.R70H | Q8N0U8 | protein_coding | tolerated_low_confidence(0.14) | probably_damaging(0.916) | TCGA-AX-A1CE-01 | Endometrium | uterine corpus endometrioid carcinoma | Female | <65 | I/II | Unspecific | Paclitaxel | SD |
| VKORC1L1 | SNV | Missense_Mutation | | c.304C>A | p.Leu102Met | p.L102M | Q8N0U8 | protein_coding | deleterious_low_confidence(0.02) | probably_damaging(0.96) | TCGA-B5-A11E-01 | Endometrium | uterine corpus endometrioid carcinoma | Female | <65 | I/II | Unknown | Unknown | SD |
| VKORC1L1 | SNV | Missense_Mutation | novel | c.355N>A | p.Gln119Lys | p.Q119K | Q8N0U8 | protein_coding | tolerated_low_confidence(0.79) | probably_damaging(0.98) | TCGA-BS-A0UF-01 | Endometrium | uterine corpus endometrioid carcinoma | Female | >=65 | I/II | Unknown | Unknown | SD |
| VKORC1L1 | SNV | Missense_Mutation | novel | c.164N>T | p.Trp55Leu | p.W55L | Q8N0U8 | protein_coding | tolerated(0.67) | benign(0.355) | TCGA-DD-AAE2-01 | Liver | liver hepatocellular carcinoma | Male | <65 | I/II | Unknown | Unknown | SD |
| VKORC1L1 | SNV | Missense_Mutation | novel | c.10N>T | p.Pro4Ser | p.P4S | Q8N0U8 | protein_coding | deleterious_low_confidence(0.01) | benign(0.033) | TCGA-56-8305-01 | Lung | lung squamous cell carcinoma | Male | >=65 | I/II | Unknown | Unknown | SD |


