
|
|||||
|
 | |
| |
| |
| |
| |
| |
|
Gene: VKORC1 |
Gene summary for VKORC1 |
| Gene information | Species | Human | Gene symbol | VKORC1 | Gene ID | 79001 |
| Gene name | vitamin K epoxide reductase complex subunit 1 | |
| Gene Alias | EDTP308 | |
| Cytomap | 16p11.2 | |
| Gene Type | protein-coding | GO ID | GO:0001501 | UniProtAcc | Q9BQB6 |
Top |
Malignant transformation analysis |
| Identification of the aberrant gene expression in precancerous and cancerous lesions by comparing the gene expression of stem-like cells in diseased tissues with normal stem cells |
| Entrez ID | Symbol | Replicates | Species | Organ | Tissue | Adj P-value | Log2FC | Malignancy |
| 79001 | VKORC1 | GSM4909281 | Human | Breast | IDC | 4.21e-04 | 3.15e-01 | 0.21 |
| 79001 | VKORC1 | GSM4909296 | Human | Breast | IDC | 2.79e-05 | -2.32e-03 | 0.1524 |
| 79001 | VKORC1 | GSM4909297 | Human | Breast | IDC | 1.51e-08 | -1.28e-01 | 0.1517 |
| 79001 | VKORC1 | GSM4909304 | Human | Breast | IDC | 6.41e-07 | 3.26e-01 | 0.1636 |
| 79001 | VKORC1 | GSM4909308 | Human | Breast | IDC | 6.16e-08 | 3.65e-01 | 0.158 |
| 79001 | VKORC1 | GSM4909311 | Human | Breast | IDC | 3.92e-25 | -1.32e-01 | 0.1534 |
| 79001 | VKORC1 | GSM4909312 | Human | Breast | IDC | 4.71e-09 | 9.17e-02 | 0.1552 |
| 79001 | VKORC1 | GSM4909315 | Human | Breast | IDC | 3.72e-02 | 2.52e-01 | 0.21 |
| 79001 | VKORC1 | GSM4909319 | Human | Breast | IDC | 1.03e-35 | -1.84e-02 | 0.1563 |
| 79001 | VKORC1 | GSM4909320 | Human | Breast | IDC | 2.50e-05 | 1.40e-01 | 0.1575 |
| 79001 | VKORC1 | GSM4909321 | Human | Breast | IDC | 4.55e-10 | 8.83e-02 | 0.1559 |
| 79001 | VKORC1 | ctrl6 | Human | Breast | Precancer | 1.01e-09 | 5.49e-01 | -0.0061 |
| 79001 | VKORC1 | brca2 | Human | Breast | Precancer | 1.43e-03 | 7.04e-02 | -0.024 |
| 79001 | VKORC1 | brca10 | Human | Breast | Precancer | 6.01e-10 | 4.45e-01 | -0.0029 |
| 79001 | VKORC1 | NCCBC14 | Human | Breast | DCIS | 3.24e-05 | -1.47e-01 | 0.2021 |
| 79001 | VKORC1 | NCCBC5 | Human | Breast | DCIS | 9.46e-10 | -1.08e-01 | 0.2046 |
| 79001 | VKORC1 | P1 | Human | Breast | IDC | 7.38e-12 | -2.42e-01 | 0.1527 |
| 79001 | VKORC1 | DCIS2 | Human | Breast | DCIS | 5.28e-58 | 1.46e-01 | 0.0085 |
| 79001 | VKORC1 | HTA11_3410_2000001011 | Human | Colorectum | AD | 6.00e-08 | 1.79e-01 | 0.0155 |
| 79001 | VKORC1 | HTA11_2487_2000001011 | Human | Colorectum | SER | 1.03e-09 | 2.58e-01 | -0.1808 |
| Page: 1 2 3 4 5 6 7 8 9 10 |
| Tissue | Expression Dynamics | Abbreviation |
| Breast | 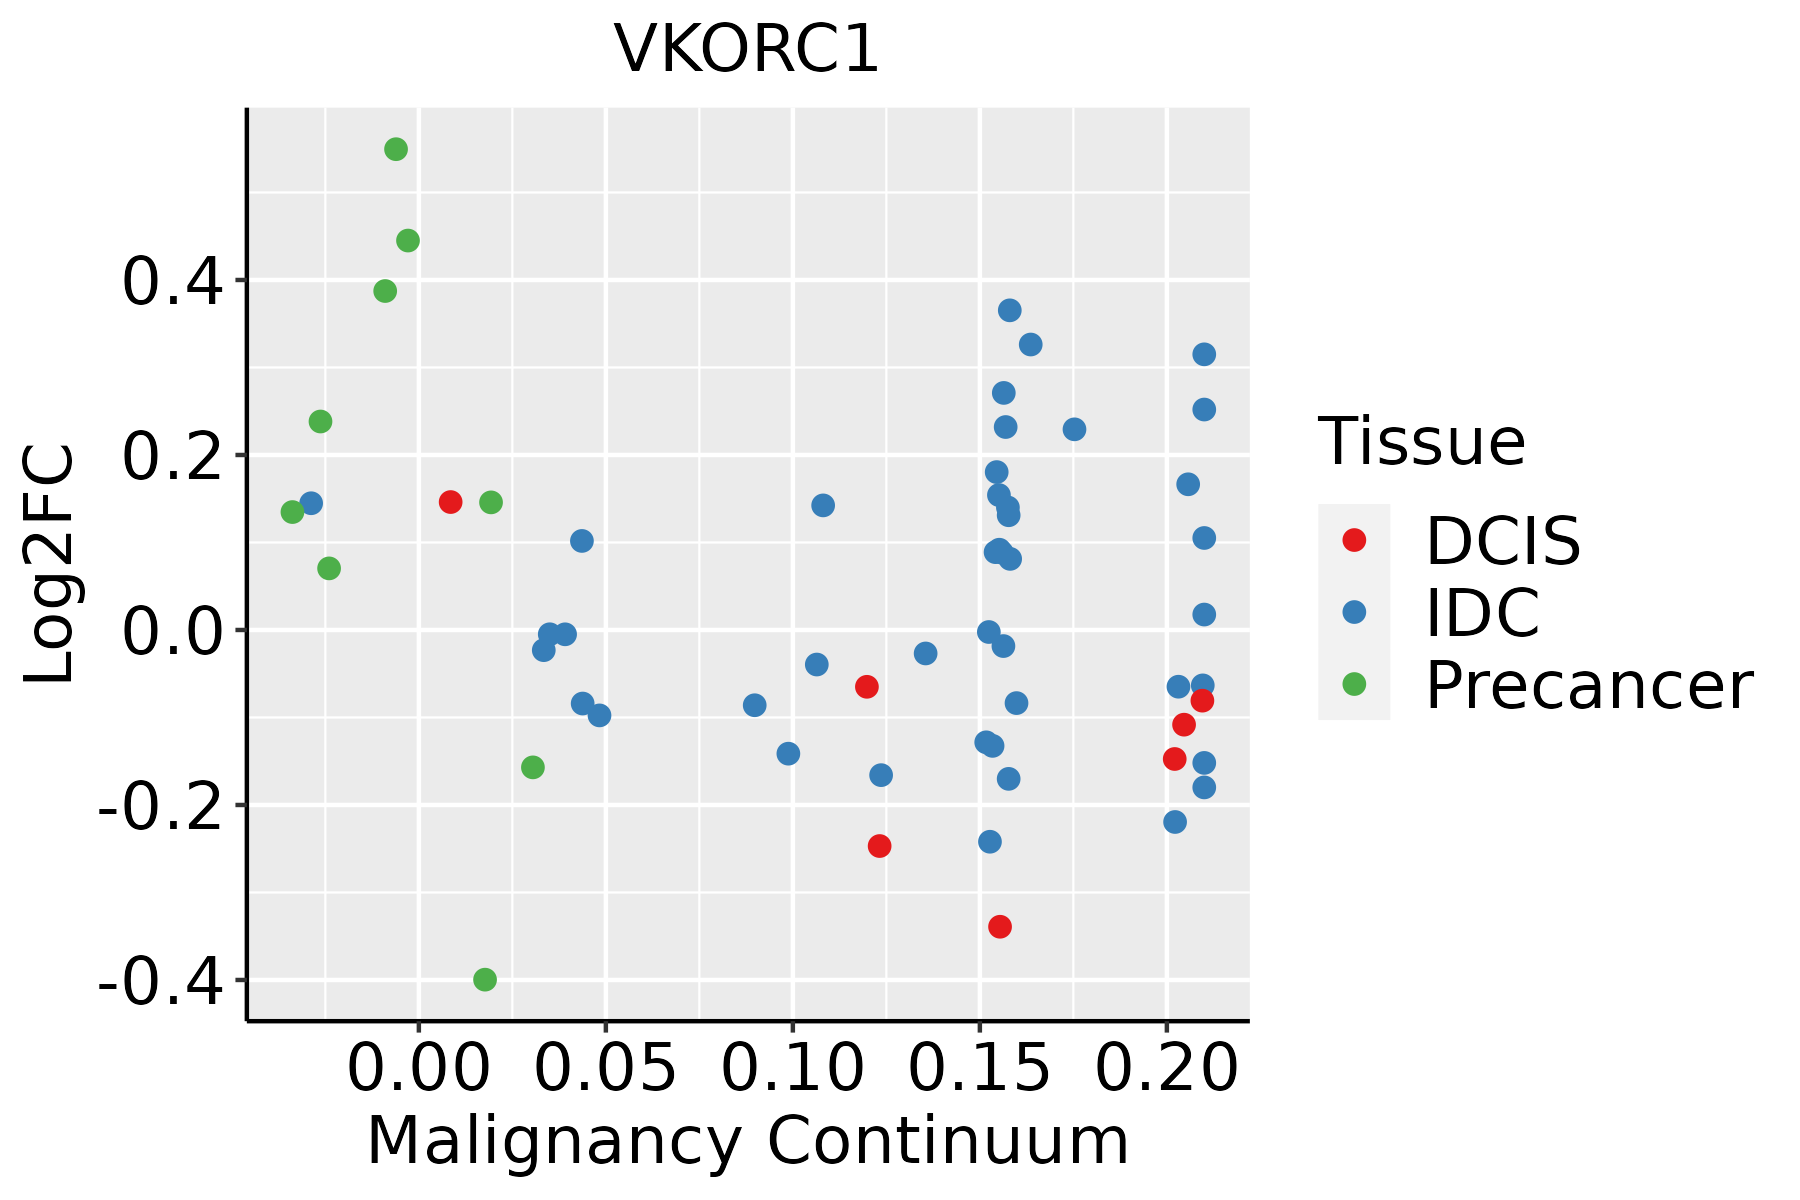 | IDC: Invasive ductal carcinoma |
| DCIS: Ductal carcinoma in situ | ||
| Precancer(BRCA1-mut): Precancerous lesion from BRCA1 mutation carriers | ||
| Colorectum (GSE201348) |  | FAP: Familial adenomatous polyposis |
| CRC: Colorectal cancer | ||
| Colorectum (HTA11) | 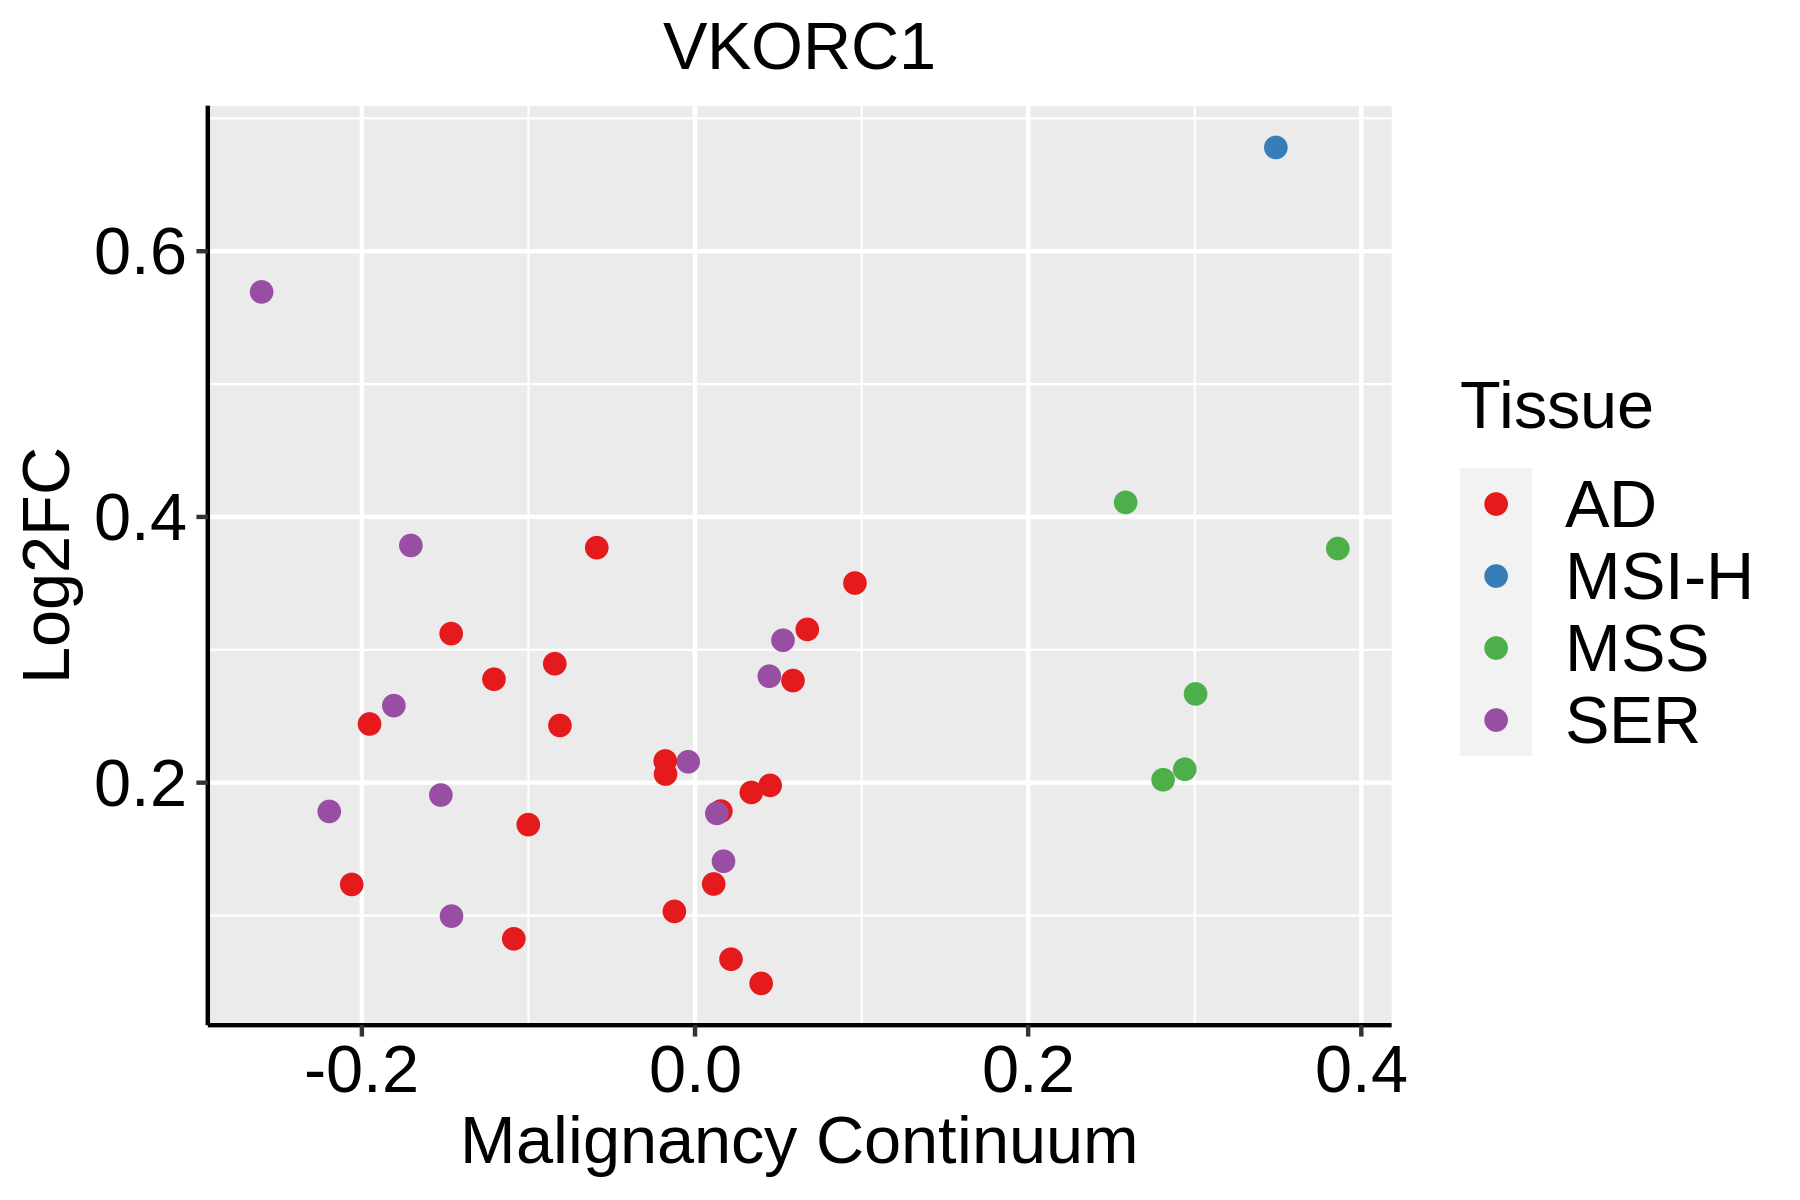 | AD: Adenomas |
| SER: Sessile serrated lesions | ||
| MSI-H: Microsatellite-high colorectal cancer | ||
| MSS: Microsatellite stable colorectal cancer | ||
| Endometrium | 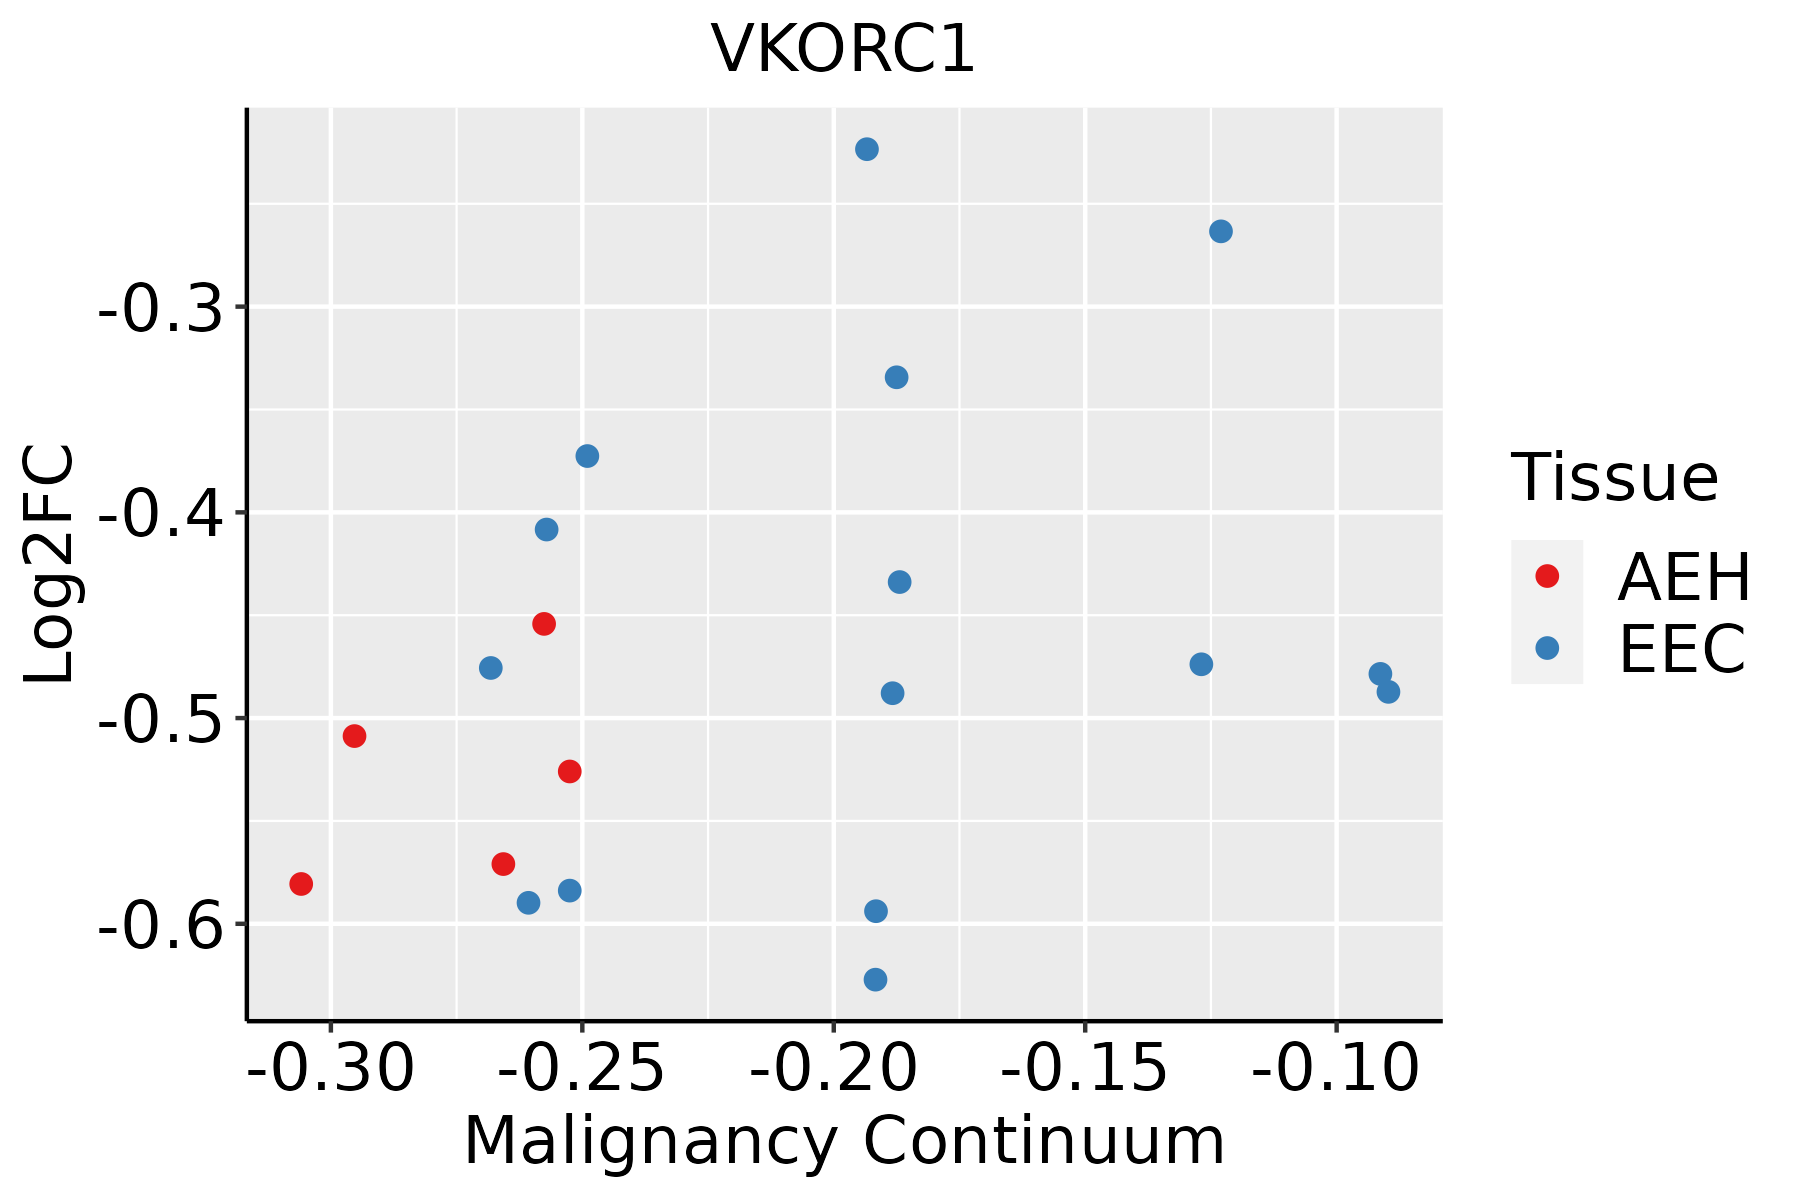 | AEH: Atypical endometrial hyperplasia |
| EEC: Endometrioid Cancer | ||
| Esophagus | 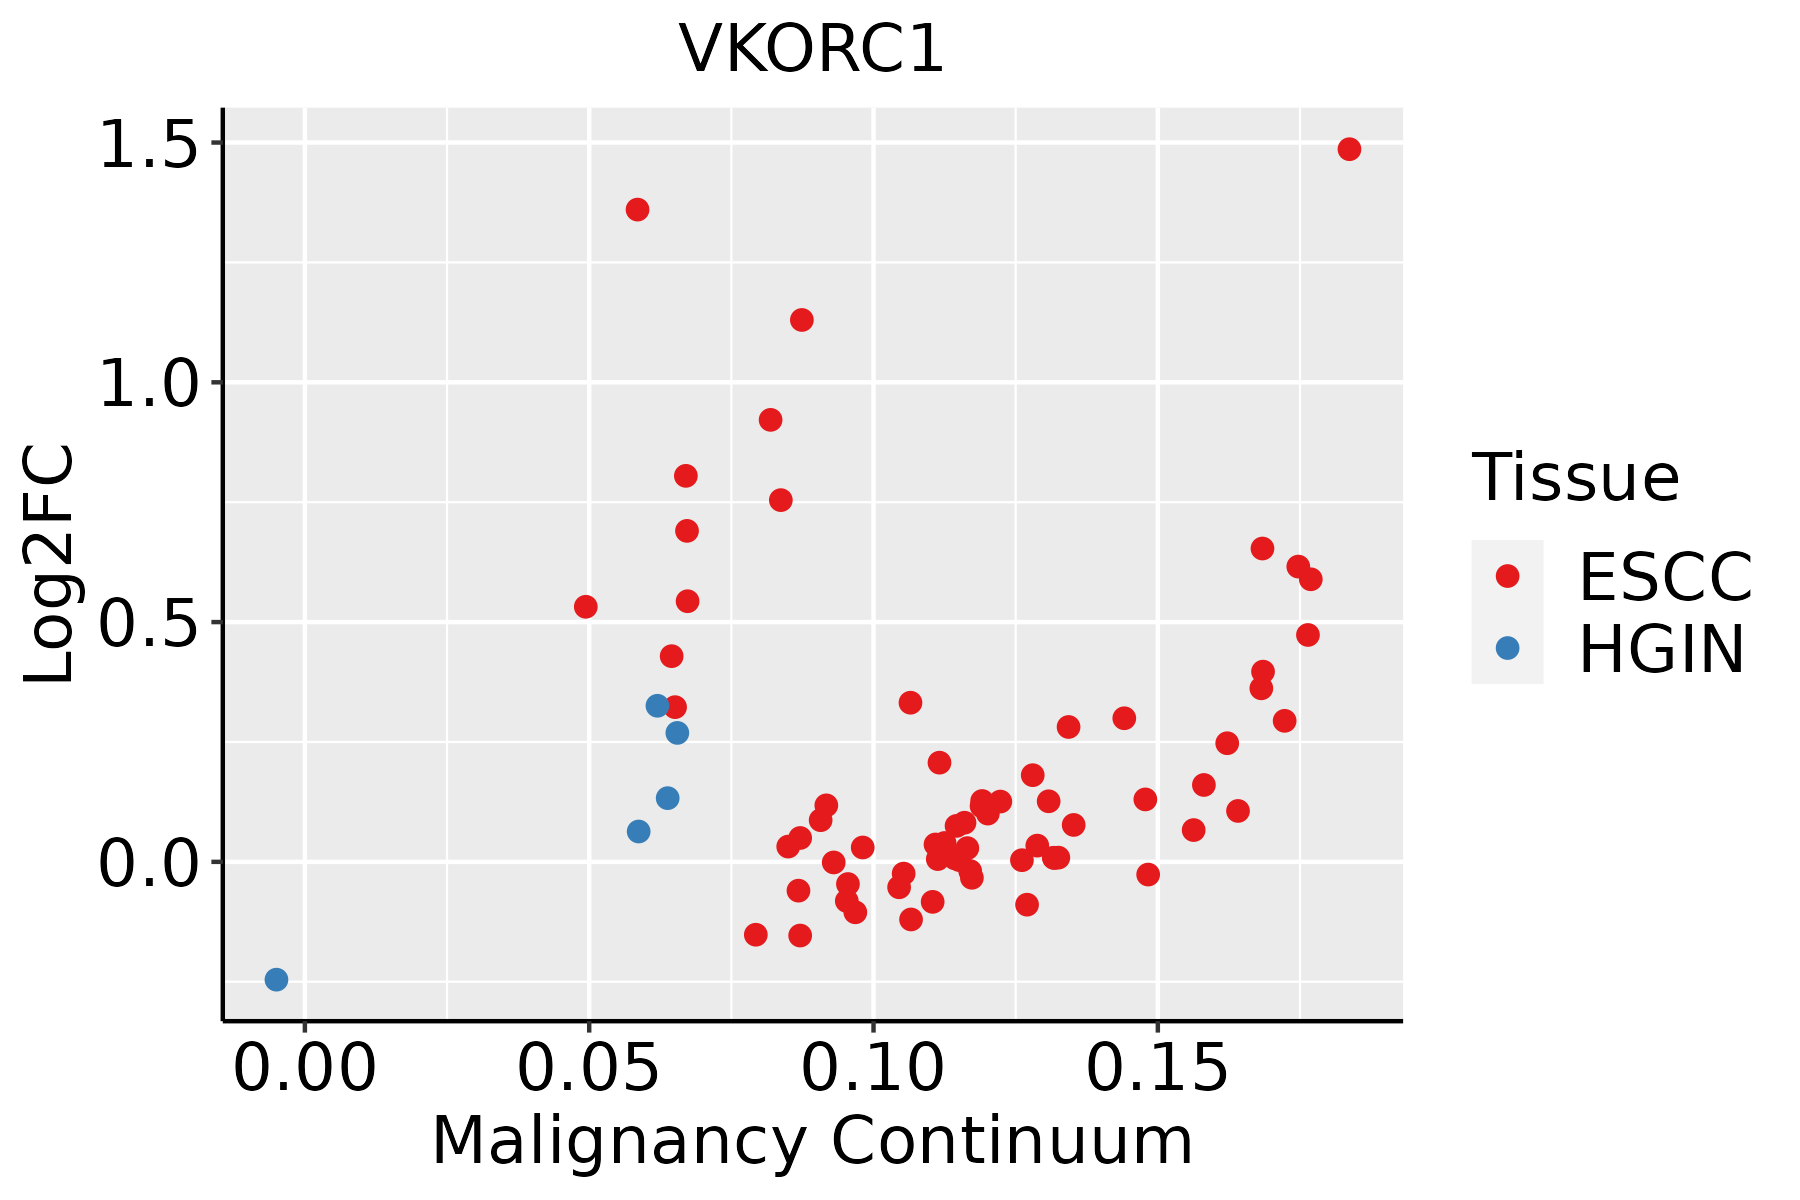 | ESCC: Esophageal squamous cell carcinoma |
| HGIN: High-grade intraepithelial neoplasias | ||
| LGIN: Low-grade intraepithelial neoplasias | ||
| Liver | 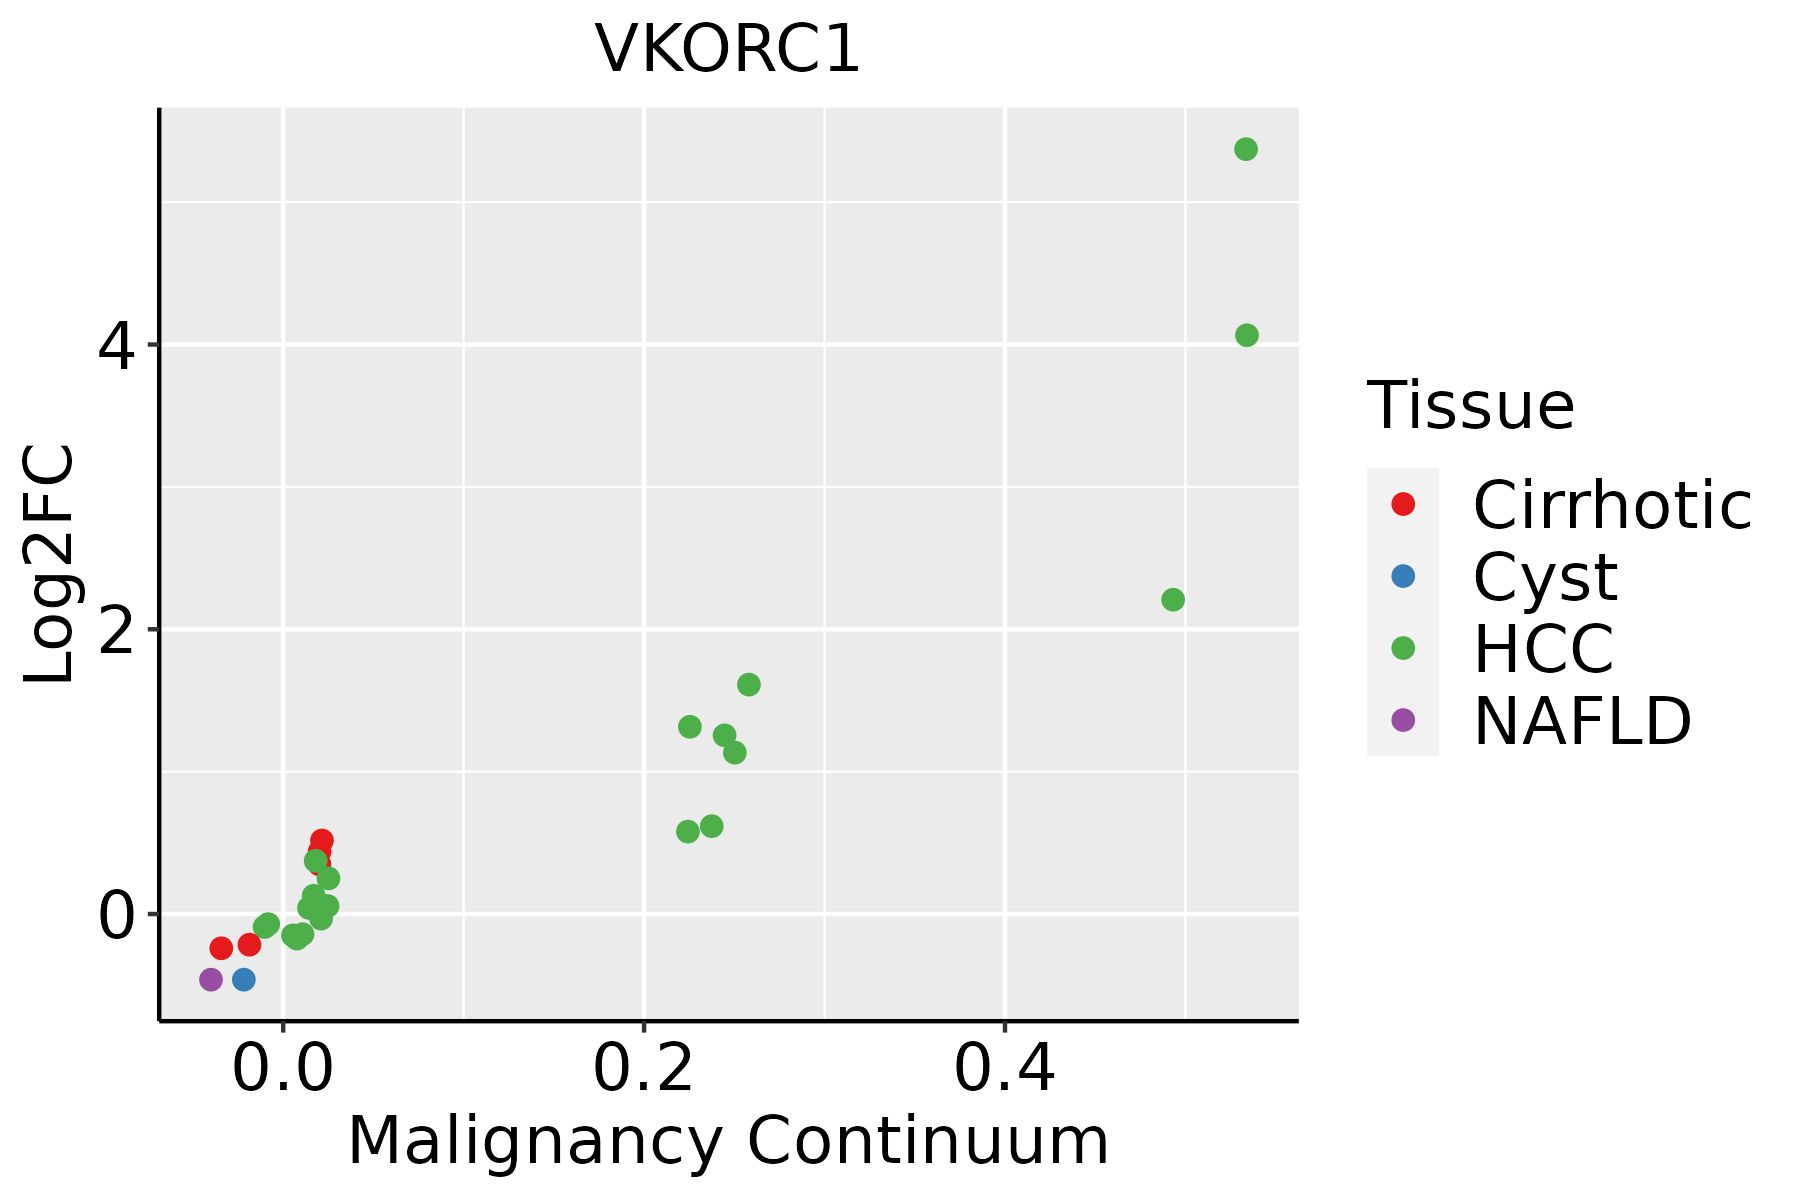 | HCC: Hepatocellular carcinoma |
| NAFLD: Non-alcoholic fatty liver disease | ||
| Oral Cavity | 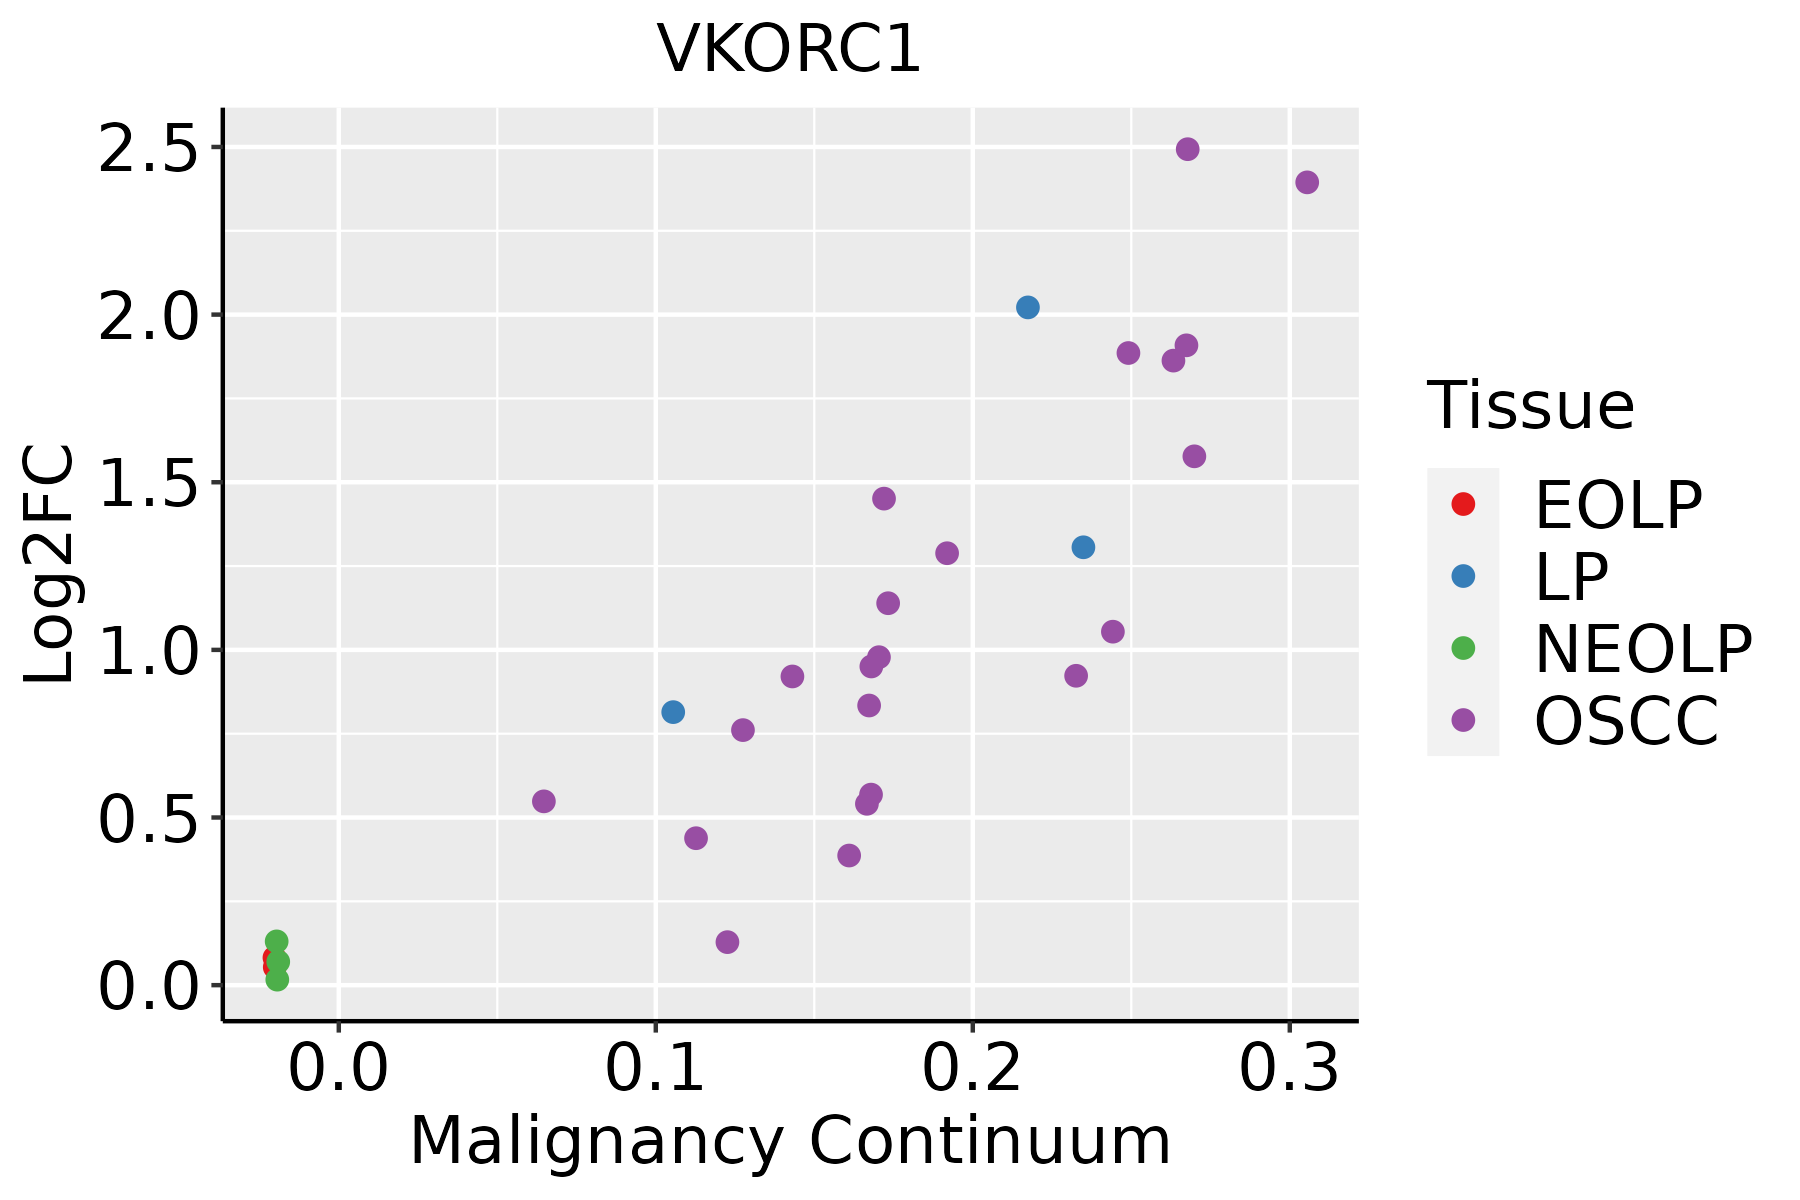 | EOLP: Erosive Oral lichen planus |
| LP: leukoplakia | ||
| NEOLP: Non-erosive oral lichen planus | ||
| OSCC: Oral squamous cell carcinoma | ||
| Prostate | 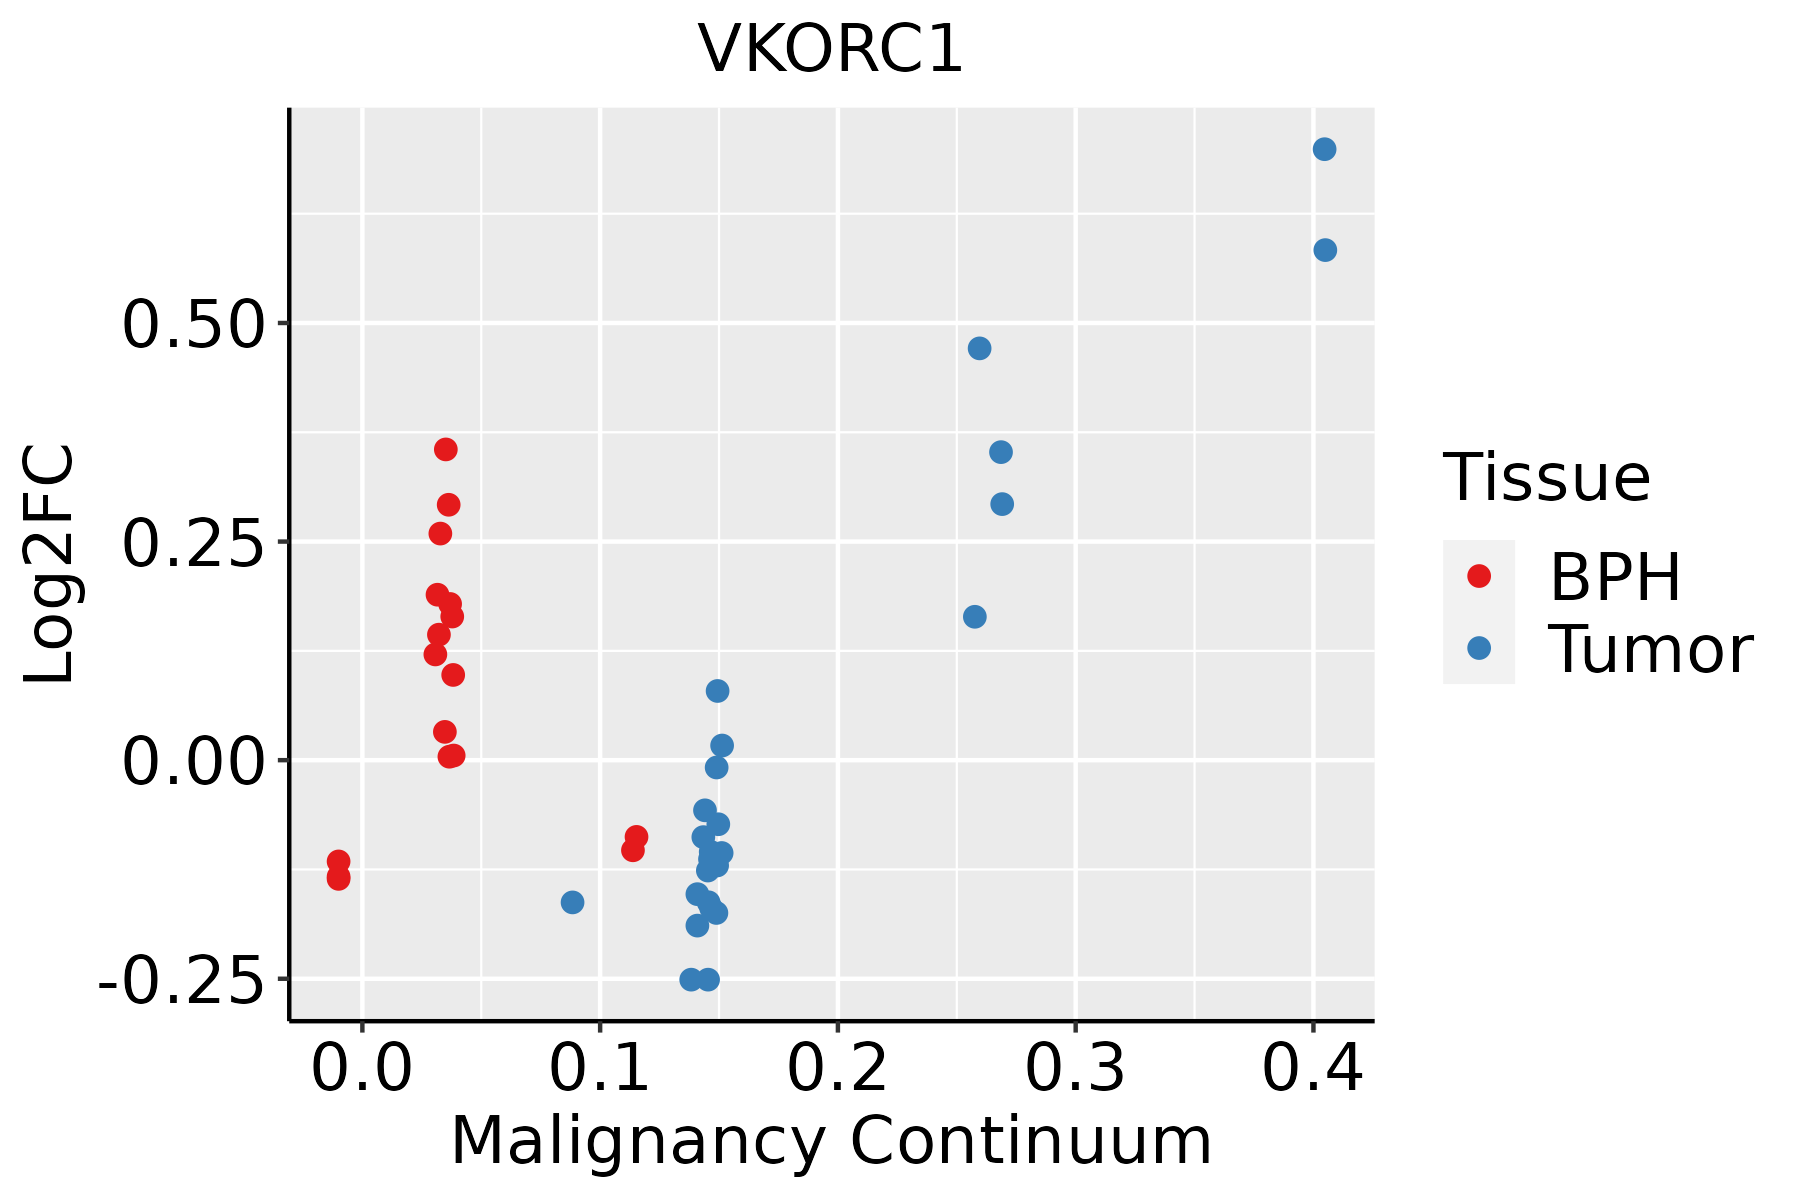 | BPH: Benign Prostatic Hyperplasia |
| Skin | 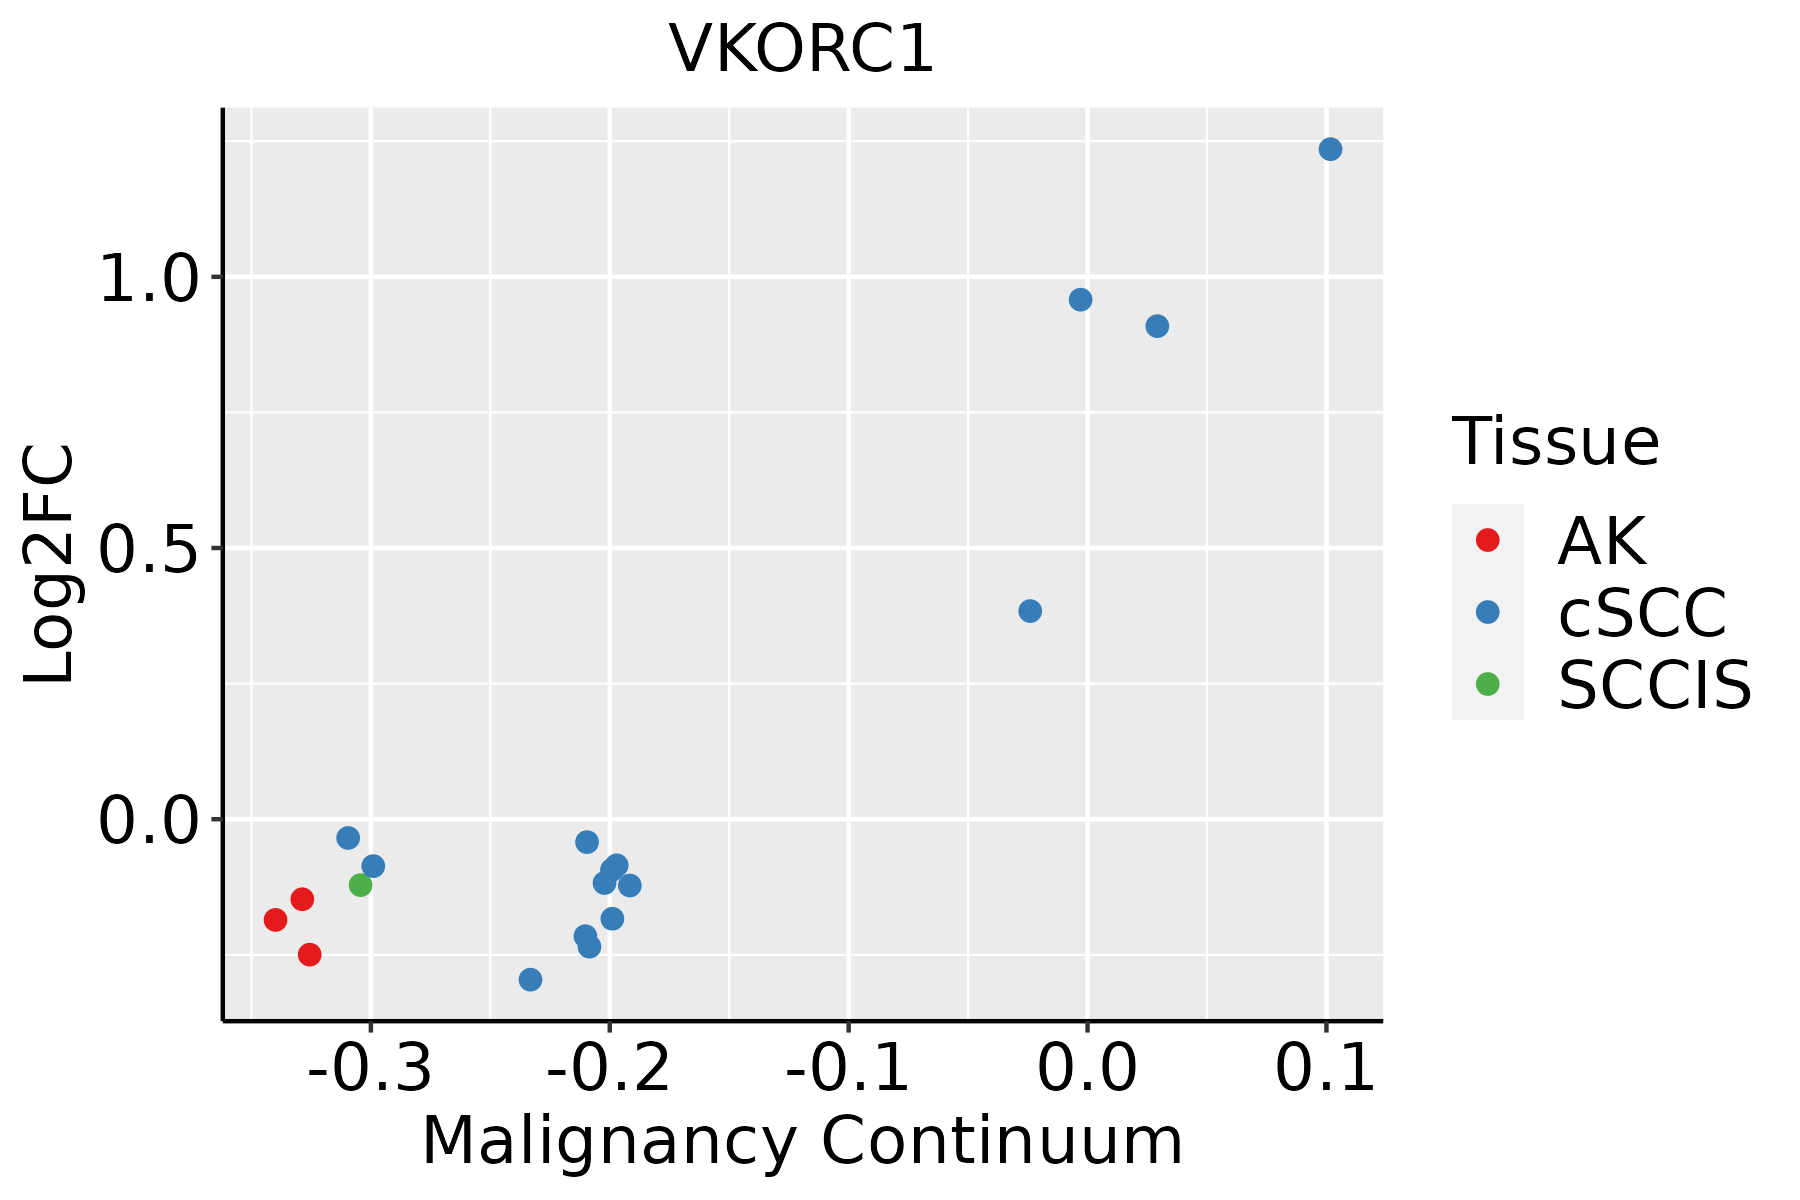 | AK: Actinic keratosis |
| cSCC: Cutaneous squamous cell carcinoma | ||
| SCCIS:squamous cell carcinoma in situ | ||
| Thyroid |  | ATC: Anaplastic thyroid cancer |
| HT: Hashimoto's thyroiditis | ||
| PTC: Papillary thyroid cancer |
| ∗log2FC in expression of this searched gene in stem-like cells from each diseased tissue sample relative to stem-like cells in normal samples in each tissue plotted against the malignancy continuum. Samples are colored based on if they are from different disease stage. |
Top |
Malignant transformation related pathway analysis |
| Find out the enriched GO biological processes and KEGG pathways involved in transition from healthy to precancer to cancer |
| Tissue | Disease Stage | Enriched GO biological Processes |
| Colorectum | AD |  |
| Colorectum | SER |  |
| Colorectum | MSS |  |
| Colorectum | MSI-H |  |
| Colorectum | FAP |  |
| ∗Top 15 enriched GO BP terms are showed in the bar plot of each disease state in each tissue. Each row represents a significant GO biological process which is colored according to the -log10(p.adjust). |
| Page: 1 2 3 4 5 6 7 8 9 |
| GO ID | Tissue | Disease Stage | Description | Gene Ratio | Bg Ratio | pvalue | p.adjust | Count |
| GO:00420609 | Breast | Precancer | wound healing | 48/1080 | 422/18723 | 5.48e-06 | 1.63e-04 | 48 |
| GO:00508789 | Breast | Precancer | regulation of body fluid levels | 40/1080 | 379/18723 | 1.68e-04 | 2.77e-03 | 40 |
| GO:00094108 | Breast | Precancer | response to xenobiotic stimulus | 45/1080 | 462/18723 | 4.17e-04 | 5.56e-03 | 45 |
| GO:00075995 | Breast | Precancer | hemostasis | 24/1080 | 222/18723 | 2.31e-03 | 2.15e-02 | 24 |
| GO:00075965 | Breast | Precancer | blood coagulation | 23/1080 | 217/18723 | 3.61e-03 | 2.98e-02 | 23 |
| GO:00508175 | Breast | Precancer | coagulation | 23/1080 | 222/18723 | 4.78e-03 | 3.64e-02 | 23 |
| GO:000941013 | Breast | IDC | response to xenobiotic stimulus | 62/1434 | 462/18723 | 1.05e-05 | 2.88e-04 | 62 |
| GO:004206014 | Breast | IDC | wound healing | 55/1434 | 422/18723 | 7.27e-05 | 1.45e-03 | 55 |
| GO:005087813 | Breast | IDC | regulation of body fluid levels | 50/1434 | 379/18723 | 1.12e-04 | 2.10e-03 | 50 |
| GO:000941023 | Breast | DCIS | response to xenobiotic stimulus | 59/1390 | 462/18723 | 3.00e-05 | 6.61e-04 | 59 |
| GO:005087823 | Breast | DCIS | regulation of body fluid levels | 50/1390 | 379/18723 | 5.17e-05 | 1.06e-03 | 50 |
| GO:004206024 | Breast | DCIS | wound healing | 54/1390 | 422/18723 | 6.09e-05 | 1.22e-03 | 54 |
| GO:000697910 | Cervix | CC | response to oxidative stress | 102/2311 | 446/18723 | 2.99e-10 | 4.36e-08 | 102 |
| GO:006219710 | Cervix | CC | cellular response to chemical stress | 76/2311 | 337/18723 | 1.01e-07 | 5.25e-06 | 76 |
| GO:003459910 | Cervix | CC | cellular response to oxidative stress | 63/2311 | 288/18723 | 3.58e-06 | 9.50e-05 | 63 |
| GO:0042060 | Colorectum | AD | wound healing | 128/3918 | 422/18723 | 2.73e-06 | 7.89e-05 | 128 |
| GO:0050878 | Colorectum | AD | regulation of body fluid levels | 108/3918 | 379/18723 | 2.54e-04 | 3.20e-03 | 108 |
| GO:0009410 | Colorectum | AD | response to xenobiotic stimulus | 128/3918 | 462/18723 | 2.69e-04 | 3.31e-03 | 128 |
| GO:00420601 | Colorectum | SER | wound healing | 97/2897 | 422/18723 | 2.69e-05 | 7.30e-04 | 97 |
| GO:00508781 | Colorectum | SER | regulation of body fluid levels | 81/2897 | 379/18723 | 1.28e-03 | 1.43e-02 | 81 |
| Page: 1 2 3 4 5 6 7 8 |
| Pathway ID | Tissue | Disease Stage | Description | Gene Ratio | Bg Ratio | pvalue | p.adjust | qvalue | Count |
| hsa012405 | Esophagus | ESCC | Biosynthesis of cofactors | 97/4205 | 153/8465 | 3.88e-04 | 1.35e-03 | 6.94e-04 | 97 |
| hsa0124012 | Esophagus | ESCC | Biosynthesis of cofactors | 97/4205 | 153/8465 | 3.88e-04 | 1.35e-03 | 6.94e-04 | 97 |
| hsa01240 | Liver | Cirrhotic | Biosynthesis of cofactors | 66/2530 | 153/8465 | 3.11e-04 | 1.99e-03 | 1.23e-03 | 66 |
| hsa012401 | Liver | Cirrhotic | Biosynthesis of cofactors | 66/2530 | 153/8465 | 3.11e-04 | 1.99e-03 | 1.23e-03 | 66 |
| hsa012402 | Liver | HCC | Biosynthesis of cofactors | 103/4020 | 153/8465 | 4.67e-07 | 5.05e-06 | 2.81e-06 | 103 |
| hsa012403 | Liver | HCC | Biosynthesis of cofactors | 103/4020 | 153/8465 | 4.67e-07 | 5.05e-06 | 2.81e-06 | 103 |
| hsa012404 | Oral cavity | OSCC | Biosynthesis of cofactors | 88/3704 | 153/8465 | 3.84e-04 | 1.20e-03 | 6.12e-04 | 88 |
| hsa00130 | Oral cavity | OSCC | Ubiquinone and other terpenoid-quinone biosynthesis | 9/3704 | 11/8465 | 1.19e-02 | 2.62e-02 | 1.33e-02 | 9 |
| hsa0124011 | Oral cavity | OSCC | Biosynthesis of cofactors | 88/3704 | 153/8465 | 3.84e-04 | 1.20e-03 | 6.12e-04 | 88 |
| hsa001301 | Oral cavity | OSCC | Ubiquinone and other terpenoid-quinone biosynthesis | 9/3704 | 11/8465 | 1.19e-02 | 2.62e-02 | 1.33e-02 | 9 |
| hsa001302 | Oral cavity | LP | Ubiquinone and other terpenoid-quinone biosynthesis | 8/2418 | 11/8465 | 3.03e-03 | 1.29e-02 | 8.35e-03 | 8 |
| hsa0124021 | Oral cavity | LP | Biosynthesis of cofactors | 57/2418 | 153/8465 | 1.17e-02 | 3.91e-02 | 2.52e-02 | 57 |
| hsa001303 | Oral cavity | LP | Ubiquinone and other terpenoid-quinone biosynthesis | 8/2418 | 11/8465 | 3.03e-03 | 1.29e-02 | 8.35e-03 | 8 |
| hsa0124031 | Oral cavity | LP | Biosynthesis of cofactors | 57/2418 | 153/8465 | 1.17e-02 | 3.91e-02 | 2.52e-02 | 57 |
| Page: 1 |
Top |
Cell-cell communication analysis |
| Identification of potential cell-cell interactions between two cell types and their ligand-receptor pairs for different disease states |
| Ligand | Receptor | LRpair | Pathway | Tissue | Disease Stage |
| Page: 1 |
Top |
Single-cell gene regulatory network inference analysis |
| Find out the significant the regulons (TFs) and the target genes of each regulon across cell types for different disease states |
| TF | Cell Type | Tissue | Disease Stage | Target Gene | RSS | Regulon Activity |
| ∗The dot plots of a searched regulon are shown for all cell subpopulations in each disease state of each tissue based on the regulon specific score inferred using pySCENIC and by calculating the average expression. |
| Page: 1 |
Top |
Somatic mutation of malignant transformation related genes |
| Annotation of somatic variants for genes involved in malignant transformation |
| Hugo Symbol | Variant Class | Variant Classification | dbSNP RS | HGVSc | HGVSp | HGVSp Short | SWISSPROT | BIOTYPE | SIFT | PolyPhen | Tumor Sample Barcode | Tissue | Histology | Sex | Age | Stage | Therapy Types | Drugs | Outcome |
| VKORC1 | SNV | Missense_Mutation | c.366G>T | p.Trp122Cys | p.W122C | Q9BQB6 | protein_coding | tolerated(0.13) | probably_damaging(0.956) | TCGA-NH-A8F7-06 | Colorectum | NA | NA | NA | NA | NA | NA | NA | |
| VKORC1 | SNV | Missense_Mutation | rs72547528 | c.292C>T | p.Arg98Trp | p.R98W | Q9BQB6 | protein_coding | tolerated(0.09) | possibly_damaging(0.636) | TCGA-AJ-A3EL-01 | Endometrium | uterine corpus endometrioid carcinoma | Female | <65 | I/II | Unknown | Unknown | SD |
| VKORC1 | SNV | Missense_Mutation | c.467C>A | p.Pro156His | p.P156H | Q9BQB6 | protein_coding | tolerated(0.55) | benign(0.001) | TCGA-AP-A051-01 | Endometrium | uterine corpus endometrioid carcinoma | Female | >=65 | I/II | Unknown | Unknown | SD | |
| VKORC1 | SNV | Missense_Mutation | novel | c.398N>C | p.Ile133Thr | p.I133T | Q9BQB6 | protein_coding | deleterious(0) | possibly_damaging(0.551) | TCGA-AP-A059-01 | Endometrium | uterine corpus endometrioid carcinoma | Female | >=65 | I/II | Unknown | Unknown | SD |
| VKORC1 | SNV | Missense_Mutation | novel | c.473N>A | p.Gly158Asp | p.G158D | Q9BQB6 | protein_coding | tolerated(0.38) | benign(0) | TCGA-B5-A3FC-01 | Endometrium | uterine corpus endometrioid carcinoma | Female | <65 | I/II | Unknown | Unknown | SD |
| VKORC1 | SNV | Missense_Mutation | rs775979722 | c.298N>T | p.Arg100Cys | p.R100C | Q9BQB6 | protein_coding | tolerated(0.18) | possibly_damaging(0.761) | TCGA-22-4594-01 | Lung | lung squamous cell carcinoma | Female | <65 | III/IV | Unknown | Unknown | SD |
| VKORC1 | SNV | Missense_Mutation | novel | c.249N>G | p.Phe83Leu | p.F83L | Q9BQB6 | protein_coding | tolerated(0.25) | benign(0.389) | TCGA-92-8063-01 | Lung | lung squamous cell carcinoma | Male | <65 | III/IV | Chemotherapy | taxol | SD |
| VKORC1 | SNV | Missense_Mutation | novel | c.254G>C | p.Cys85Ser | p.C85S | Q9BQB6 | protein_coding | deleterious(0.01) | possibly_damaging(0.715) | TCGA-HU-A4G8-01 | Stomach | stomach adenocarcinoma | Female | >=65 | I/II | Chemotherapy | 5-fluorouracil | SD |
| Page: 1 |
Top |
Related drugs of malignant transformation related genes |
| Identification of chemicals and drugs interact with genes involved in malignant transfromation |
| (DGIdb 4.0) |
| Entrez ID | Symbol | Category | Interaction Types | Drug Claim Name | Drug Name | PMIDs |
| 79001 | VKORC1 | DRUGGABLE GENOME, ENZYME | Tecarfarin | TECARFARIN | ||
| 79001 | VKORC1 | DRUGGABLE GENOME, ENZYME | inhibitor | 178103444 | PHENINDIONE | |
| 79001 | VKORC1 | DRUGGABLE GENOME, ENZYME | DICUMAROL | DICUMAROL | ||
| 79001 | VKORC1 | DRUGGABLE GENOME, ENZYME | inhibitor | 135651418 | ALITRETINOIN | |
| 79001 | VKORC1 | DRUGGABLE GENOME, ENZYME | PHENPROCOUMON | PHENPROCOUMON | ||
| 79001 | VKORC1 | DRUGGABLE GENOME, ENZYME | ACENOCOUMAROL | ACENOCOUMAROL | ||
| 79001 | VKORC1 | DRUGGABLE GENOME, ENZYME | inhibitor | 178103414 | DICUMAROL | |
| 79001 | VKORC1 | DRUGGABLE GENOME, ENZYME | inhibitor | 178103459 | WARFARIN | |
| 79001 | VKORC1 | DRUGGABLE GENOME, ENZYME | Dicumarol | DICUMAROL | ||
| 79001 | VKORC1 | DRUGGABLE GENOME, ENZYME | Acenocoumarol | ACENOCOUMAROL |
| Page: 1 2 3 4 |

Copyright 2023-Present -The University of Texas Health Science Center at Houston |