
|
|||||
|
 | |
| |
| |
| |
| |
| |
|
Gene: VIPAS39 |
Gene summary for VIPAS39 |
| Gene information | Species | Human | Gene symbol | VIPAS39 | Gene ID | 63894 |
| Gene name | VPS33B interacting protein, apical-basolateral polarity regulator, spe-39 homolog | |
| Gene Alias | C14orf133 | |
| Cytomap | 14q24.3 | |
| Gene Type | protein-coding | GO ID | GO:0000003 | UniProtAcc | Q6IA61 |
Top |
Malignant transformation analysis |
| Identification of the aberrant gene expression in precancerous and cancerous lesions by comparing the gene expression of stem-like cells in diseased tissues with normal stem cells |
| Entrez ID | Symbol | Replicates | Species | Organ | Tissue | Adj P-value | Log2FC | Malignancy |
| 63894 | VIPAS39 | LZE4T | Human | Esophagus | ESCC | 6.35e-03 | 1.20e-01 | 0.0811 |
| 63894 | VIPAS39 | LZE8T | Human | Esophagus | ESCC | 1.65e-04 | 1.35e-01 | 0.067 |
| 63894 | VIPAS39 | LZE20T | Human | Esophagus | ESCC | 4.98e-02 | 1.10e-01 | 0.0662 |
| 63894 | VIPAS39 | LZE22T | Human | Esophagus | ESCC | 1.57e-02 | 2.59e-01 | 0.068 |
| 63894 | VIPAS39 | LZE24T | Human | Esophagus | ESCC | 4.99e-09 | 1.98e-01 | 0.0596 |
| 63894 | VIPAS39 | LZE21T | Human | Esophagus | ESCC | 6.52e-03 | 2.33e-01 | 0.0655 |
| 63894 | VIPAS39 | P1T-E | Human | Esophagus | ESCC | 1.09e-04 | 1.82e-01 | 0.0875 |
| 63894 | VIPAS39 | P2T-E | Human | Esophagus | ESCC | 9.02e-11 | 1.71e-01 | 0.1177 |
| 63894 | VIPAS39 | P4T-E | Human | Esophagus | ESCC | 3.48e-08 | 1.88e-01 | 0.1323 |
| 63894 | VIPAS39 | P5T-E | Human | Esophagus | ESCC | 2.05e-07 | 1.32e-01 | 0.1327 |
| 63894 | VIPAS39 | P8T-E | Human | Esophagus | ESCC | 2.60e-16 | 1.62e-01 | 0.0889 |
| 63894 | VIPAS39 | P9T-E | Human | Esophagus | ESCC | 3.05e-03 | 9.37e-02 | 0.1131 |
| 63894 | VIPAS39 | P10T-E | Human | Esophagus | ESCC | 1.62e-18 | 2.80e-01 | 0.116 |
| 63894 | VIPAS39 | P11T-E | Human | Esophagus | ESCC | 6.08e-06 | 1.86e-01 | 0.1426 |
| 63894 | VIPAS39 | P12T-E | Human | Esophagus | ESCC | 3.92e-15 | 3.57e-01 | 0.1122 |
| 63894 | VIPAS39 | P15T-E | Human | Esophagus | ESCC | 1.87e-22 | 4.03e-01 | 0.1149 |
| 63894 | VIPAS39 | P16T-E | Human | Esophagus | ESCC | 5.79e-16 | 2.50e-01 | 0.1153 |
| 63894 | VIPAS39 | P17T-E | Human | Esophagus | ESCC | 8.50e-05 | 2.17e-01 | 0.1278 |
| 63894 | VIPAS39 | P19T-E | Human | Esophagus | ESCC | 6.53e-04 | 2.29e-01 | 0.1662 |
| 63894 | VIPAS39 | P20T-E | Human | Esophagus | ESCC | 1.61e-08 | 1.81e-01 | 0.1124 |
| Page: 1 2 3 4 |
| Tissue | Expression Dynamics | Abbreviation |
| Esophagus | 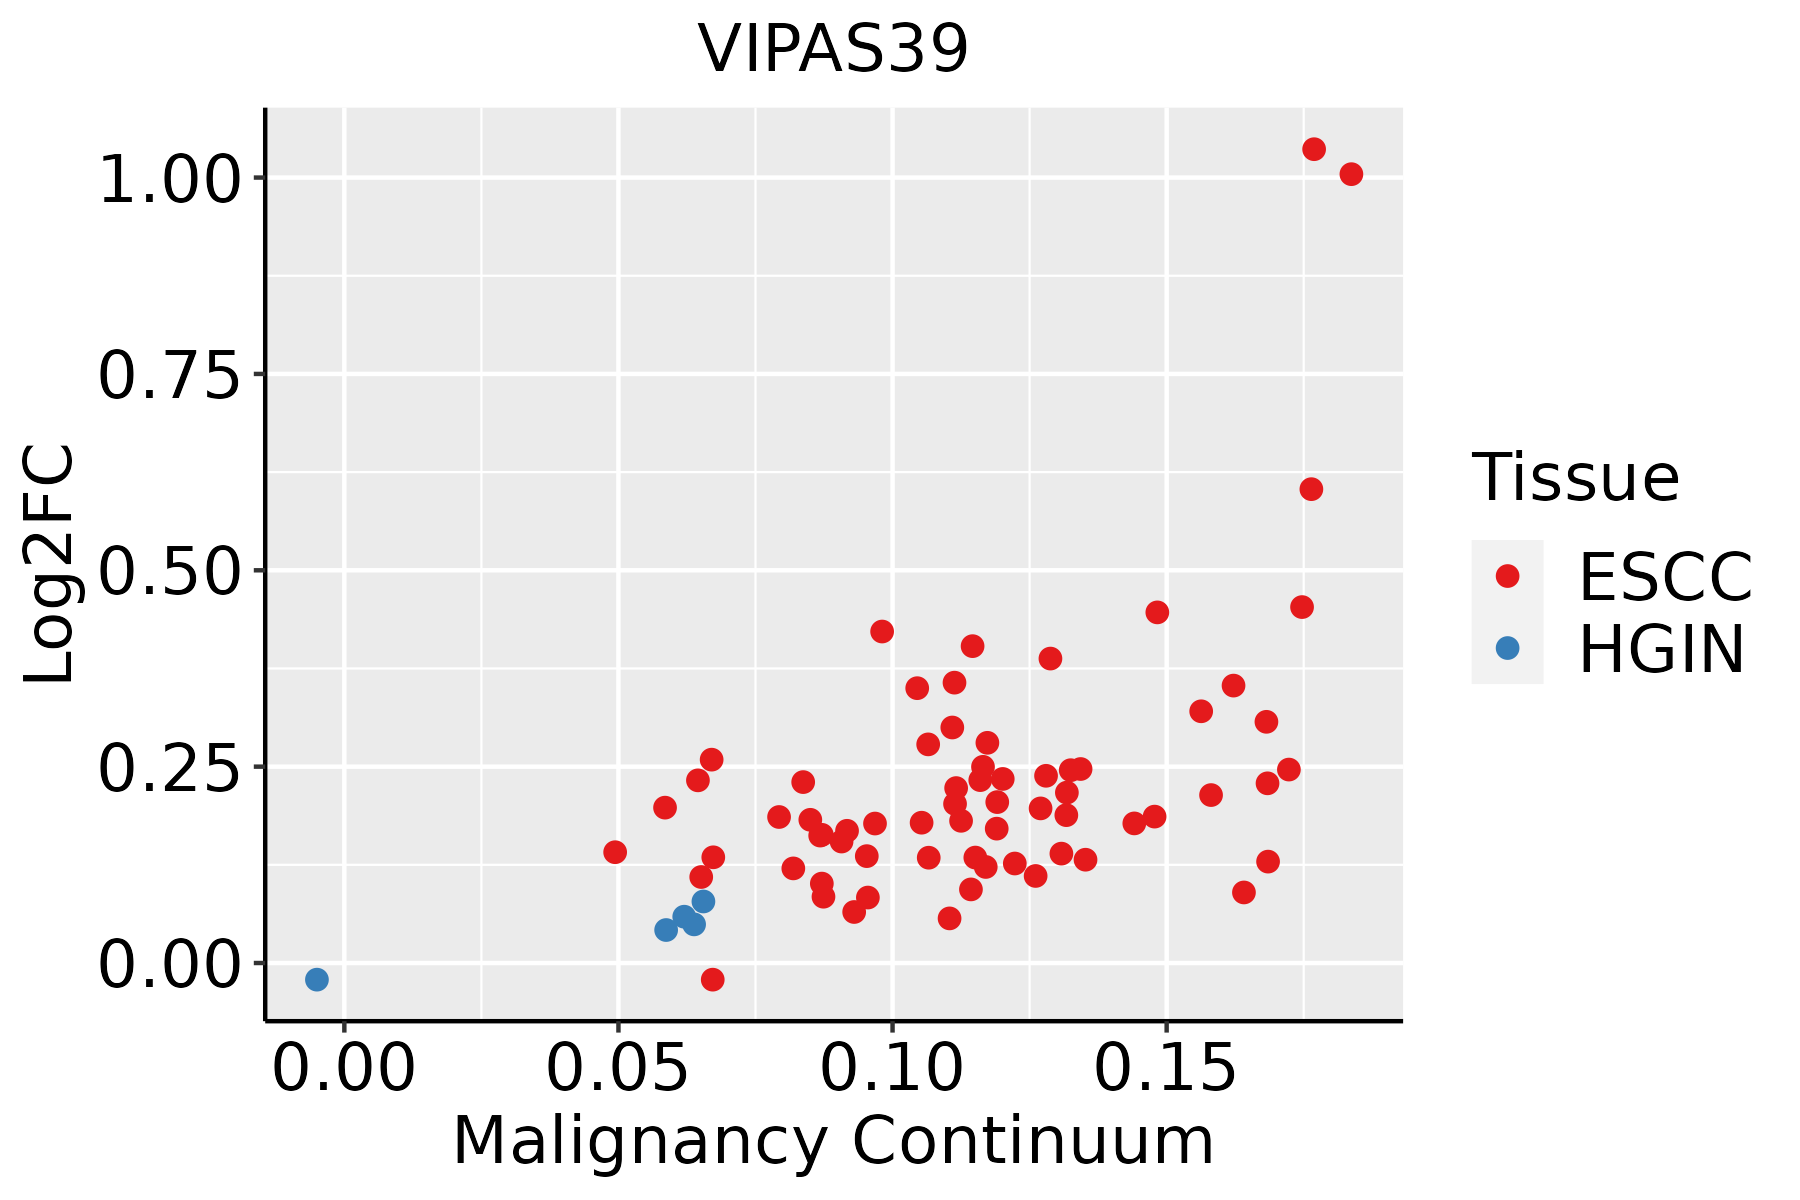 | ESCC: Esophageal squamous cell carcinoma |
| HGIN: High-grade intraepithelial neoplasias | ||
| LGIN: Low-grade intraepithelial neoplasias |
| ∗log2FC in expression of this searched gene in stem-like cells from each diseased tissue sample relative to stem-like cells in normal samples in each tissue plotted against the malignancy continuum. Samples are colored based on if they are from different disease stage. |
Top |
Malignant transformation related pathway analysis |
| Find out the enriched GO biological processes and KEGG pathways involved in transition from healthy to precancer to cancer |
| Tissue | Disease Stage | Enriched GO biological Processes |
| Colorectum | AD |  |
| Colorectum | SER |  |
| Colorectum | MSS |  |
| Colorectum | MSI-H |  |
| Colorectum | FAP |  |
| ∗Top 15 enriched GO BP terms are showed in the bar plot of each disease state in each tissue. Each row represents a significant GO biological process which is colored according to the -log10(p.adjust). |
| Page: 1 2 3 4 5 6 7 8 9 |
| GO ID | Tissue | Disease Stage | Description | Gene Ratio | Bg Ratio | pvalue | p.adjust | Count |
| GO:001820514 | Esophagus | ESCC | peptidyl-lysine modification | 259/8552 | 376/18723 | 3.90e-20 | 5.26e-18 | 259 |
| GO:000703417 | Esophagus | ESCC | vacuolar transport | 119/8552 | 157/18723 | 1.16e-14 | 6.30e-13 | 119 |
| GO:00070419 | Esophagus | ESCC | lysosomal transport | 83/8552 | 114/18723 | 3.52e-09 | 7.41e-08 | 83 |
| GO:00181263 | Esophagus | ESCC | protein hydroxylation | 23/8552 | 27/18723 | 2.60e-05 | 2.19e-04 | 23 |
| GO:00083333 | Esophagus | ESCC | endosome to lysosome transport | 40/8552 | 55/18723 | 4.27e-05 | 3.42e-04 | 40 |
| GO:00301984 | Esophagus | ESCC | extracellular matrix organization | 171/8552 | 301/18723 | 6.08e-05 | 4.67e-04 | 171 |
| GO:00430624 | Esophagus | ESCC | extracellular structure organization | 171/8552 | 302/18723 | 7.73e-05 | 5.76e-04 | 171 |
| GO:00452294 | Esophagus | ESCC | external encapsulating structure organization | 172/8552 | 304/18723 | 7.80e-05 | 5.80e-04 | 172 |
| GO:00301993 | Esophagus | ESCC | collagen fibril organization | 40/8552 | 61/18723 | 1.35e-03 | 6.44e-03 | 40 |
| GO:00329631 | Esophagus | ESCC | collagen metabolic process | 62/8552 | 104/18723 | 2.90e-03 | 1.22e-02 | 62 |
| Page: 1 |
| Pathway ID | Tissue | Disease Stage | Description | Gene Ratio | Bg Ratio | pvalue | p.adjust | qvalue | Count |
| Page: 1 |
Top |
Cell-cell communication analysis |
| Identification of potential cell-cell interactions between two cell types and their ligand-receptor pairs for different disease states |
| Ligand | Receptor | LRpair | Pathway | Tissue | Disease Stage |
| Page: 1 |
Top |
Single-cell gene regulatory network inference analysis |
| Find out the significant the regulons (TFs) and the target genes of each regulon across cell types for different disease states |
| TF | Cell Type | Tissue | Disease Stage | Target Gene | RSS | Regulon Activity |
| ∗The dot plots of a searched regulon are shown for all cell subpopulations in each disease state of each tissue based on the regulon specific score inferred using pySCENIC and by calculating the average expression. |
| Page: 1 |
Top |
Somatic mutation of malignant transformation related genes |
| Annotation of somatic variants for genes involved in malignant transformation |
| Hugo Symbol | Variant Class | Variant Classification | dbSNP RS | HGVSc | HGVSp | HGVSp Short | SWISSPROT | BIOTYPE | SIFT | PolyPhen | Tumor Sample Barcode | Tissue | Histology | Sex | Age | Stage | Therapy Types | Drugs | Outcome |
| VIPAS39 | insertion | Frame_Shift_Ins | novel | c.476_477insGGTG | p.Asp159GlufsTer36 | p.D159Efs*36 | Q9H9C1 | protein_coding | TCGA-AR-A0TY-01 | Breast | breast invasive carcinoma | Female | <65 | I/II | Unspecific | Paclitaxel | PD | ||
| VIPAS39 | insertion | Nonsense_Mutation | novel | c.475_476insTGTTAAATGTTAAGTAAAGATCCTGGATTCCCCTTGG | p.Asp159ValfsTer6 | p.D159Vfs*6 | Q9H9C1 | protein_coding | TCGA-AR-A0TY-01 | Breast | breast invasive carcinoma | Female | <65 | I/II | Unspecific | Paclitaxel | PD | ||
| VIPAS39 | SNV | Missense_Mutation | novel | c.719N>G | p.Leu240Arg | p.L240R | Q9H9C1 | protein_coding | deleterious(0) | probably_damaging(0.999) | TCGA-2W-A8YY-01 | Cervix | cervical & endocervical cancer | Female | <65 | I/II | Chemotherapy | cisplatin | CR |
| VIPAS39 | SNV | Missense_Mutation | novel | c.1118N>T | p.Ala373Val | p.A373V | Q9H9C1 | protein_coding | deleterious(0.04) | probably_damaging(0.982) | TCGA-EA-A410-01 | Cervix | cervical & endocervical cancer | Female | <65 | I/II | Unknown | Unknown | SD |
| VIPAS39 | SNV | Missense_Mutation | novel | c.475G>A | p.Asp159Asn | p.D159N | Q9H9C1 | protein_coding | deleterious(0.01) | possibly_damaging(0.838) | TCGA-VS-A958-01 | Cervix | cervical & endocervical cancer | Female | <65 | I/II | Chemotherapy | cisplatin | CR |
| VIPAS39 | SNV | Missense_Mutation | c.280N>C | p.Phe94Leu | p.F94L | Q9H9C1 | protein_coding | tolerated(0.65) | benign(0) | TCGA-AA-3966-01 | Colorectum | colon adenocarcinoma | Female | >=65 | I/II | Unknown | Unknown | SD | |
| VIPAS39 | SNV | Missense_Mutation | c.820N>A | p.Leu274Ile | p.L274I | Q9H9C1 | protein_coding | deleterious(0.01) | probably_damaging(0.974) | TCGA-AA-A00N-01 | Colorectum | colon adenocarcinoma | Male | >=65 | I/II | Unknown | Unknown | PD | |
| VIPAS39 | SNV | Missense_Mutation | rs761383550 | c.269N>A | p.Ser90Asn | p.S90N | Q9H9C1 | protein_coding | tolerated(0.42) | benign(0) | TCGA-AA-A00N-01 | Colorectum | colon adenocarcinoma | Male | >=65 | I/II | Unknown | Unknown | PD |
| VIPAS39 | SNV | Missense_Mutation | rs371894407 | c.884C>T | p.Thr295Met | p.T295M | Q9H9C1 | protein_coding | deleterious(0.01) | benign(0.117) | TCGA-CM-4746-01 | Colorectum | colon adenocarcinoma | Male | <65 | I/II | Unknown | Unknown | SD |
| VIPAS39 | SNV | Missense_Mutation | c.804N>G | p.Asp268Glu | p.D268E | Q9H9C1 | protein_coding | tolerated(1) | benign(0) | TCGA-QG-A5YW-01 | Colorectum | colon adenocarcinoma | Female | <65 | III/IV | Chemotherapy | capecitabine | CR |
| Page: 1 2 3 4 5 6 |
Top |
Related drugs of malignant transformation related genes |
| Identification of chemicals and drugs interact with genes involved in malignant transfromation |
| (DGIdb 4.0) |
| Entrez ID | Symbol | Category | Interaction Types | Drug Claim Name | Drug Name | PMIDs |
| Page: 1 |

Copyright 2023-Present -The University of Texas Health Science Center at Houston |