
|
|||||
|
 | |
| |
| |
| |
| |
| |
|
Gene: VIL1 |
Gene summary for VIL1 |
| Gene information | Species | Human | Gene symbol | VIL1 | Gene ID | 7429 |
| Gene name | villin 1 | |
| Gene Alias | D2S1471 | |
| Cytomap | 2q35 | |
| Gene Type | protein-coding | GO ID | GO:0000902 | UniProtAcc | P09327 |
Top |
Malignant transformation analysis |
| Identification of the aberrant gene expression in precancerous and cancerous lesions by comparing the gene expression of stem-like cells in diseased tissues with normal stem cells |
| Entrez ID | Symbol | Replicates | Species | Organ | Tissue | Adj P-value | Log2FC | Malignancy |
| 7429 | VIL1 | HTA11_3410_2000001011 | Human | Colorectum | AD | 1.31e-02 | -1.57e-01 | 0.0155 |
| 7429 | VIL1 | HTA11_2487_2000001011 | Human | Colorectum | SER | 2.12e-05 | 5.11e-01 | -0.1808 |
| 7429 | VIL1 | HTA11_78_2000001011 | Human | Colorectum | AD | 2.34e-03 | 3.31e-01 | -0.1088 |
| 7429 | VIL1 | HTA11_347_2000001011 | Human | Colorectum | AD | 4.32e-30 | 8.96e-01 | -0.1954 |
| 7429 | VIL1 | HTA11_2112_2000001011 | Human | Colorectum | SER | 2.25e-03 | 7.50e-01 | -0.2196 |
| 7429 | VIL1 | HTA11_3361_2000001011 | Human | Colorectum | AD | 7.33e-03 | 3.83e-01 | -0.1207 |
| 7429 | VIL1 | HTA11_83_2000001011 | Human | Colorectum | SER | 2.73e-07 | 5.91e-01 | -0.1526 |
| 7429 | VIL1 | HTA11_696_2000001011 | Human | Colorectum | AD | 2.27e-12 | 6.58e-01 | -0.1464 |
| 7429 | VIL1 | HTA11_1391_2000001011 | Human | Colorectum | AD | 1.76e-07 | 6.10e-01 | -0.059 |
| 7429 | VIL1 | HTA11_2992_2000001011 | Human | Colorectum | SER | 4.47e-02 | 5.65e-01 | -0.1706 |
| 7429 | VIL1 | HTA11_866_3004761011 | Human | Colorectum | AD | 1.65e-04 | 3.88e-01 | 0.096 |
| 7429 | VIL1 | HTA11_10711_2000001011 | Human | Colorectum | AD | 3.58e-02 | 3.95e-01 | 0.0338 |
| 7429 | VIL1 | HTA11_99999965062_69753 | Human | Colorectum | MSI-H | 1.34e-02 | 9.13e-01 | 0.3487 |
| 7429 | VIL1 | HTA11_99999965104_69814 | Human | Colorectum | MSS | 7.95e-12 | 7.88e-01 | 0.281 |
| 7429 | VIL1 | HTA11_99999971662_82457 | Human | Colorectum | MSS | 8.47e-07 | 6.28e-01 | 0.3859 |
| 7429 | VIL1 | HTA11_99999973899_84307 | Human | Colorectum | MSS | 1.55e-07 | 8.27e-01 | 0.2585 |
| 7429 | VIL1 | HTA11_99999974143_84620 | Human | Colorectum | MSS | 4.18e-09 | 5.45e-01 | 0.3005 |
| 7429 | VIL1 | A015-C-203 | Human | Colorectum | FAP | 1.40e-14 | -1.35e-01 | -0.1294 |
| 7429 | VIL1 | A015-C-204 | Human | Colorectum | FAP | 2.25e-02 | -2.86e-01 | -0.0228 |
| 7429 | VIL1 | A002-C-201 | Human | Colorectum | FAP | 1.50e-04 | -2.64e-01 | 0.0324 |
| Page: 1 2 3 4 |
| Tissue | Expression Dynamics | Abbreviation |
| Colorectum (GSE201348) |  | FAP: Familial adenomatous polyposis |
| CRC: Colorectal cancer | ||
| Colorectum (HTA11) |  | AD: Adenomas |
| SER: Sessile serrated lesions | ||
| MSI-H: Microsatellite-high colorectal cancer | ||
| MSS: Microsatellite stable colorectal cancer | ||
| GC |  | CAG: Chronic atrophic gastritis |
| CAG with IM: Chronic atrophic gastritis with intestinal metaplasia | ||
| CSG: Chronic superficial gastritis | ||
| GC: Gastric cancer | ||
| SIM: Severe intestinal metaplasia | ||
| WIM: Wild intestinal metaplasia | ||
| Liver | 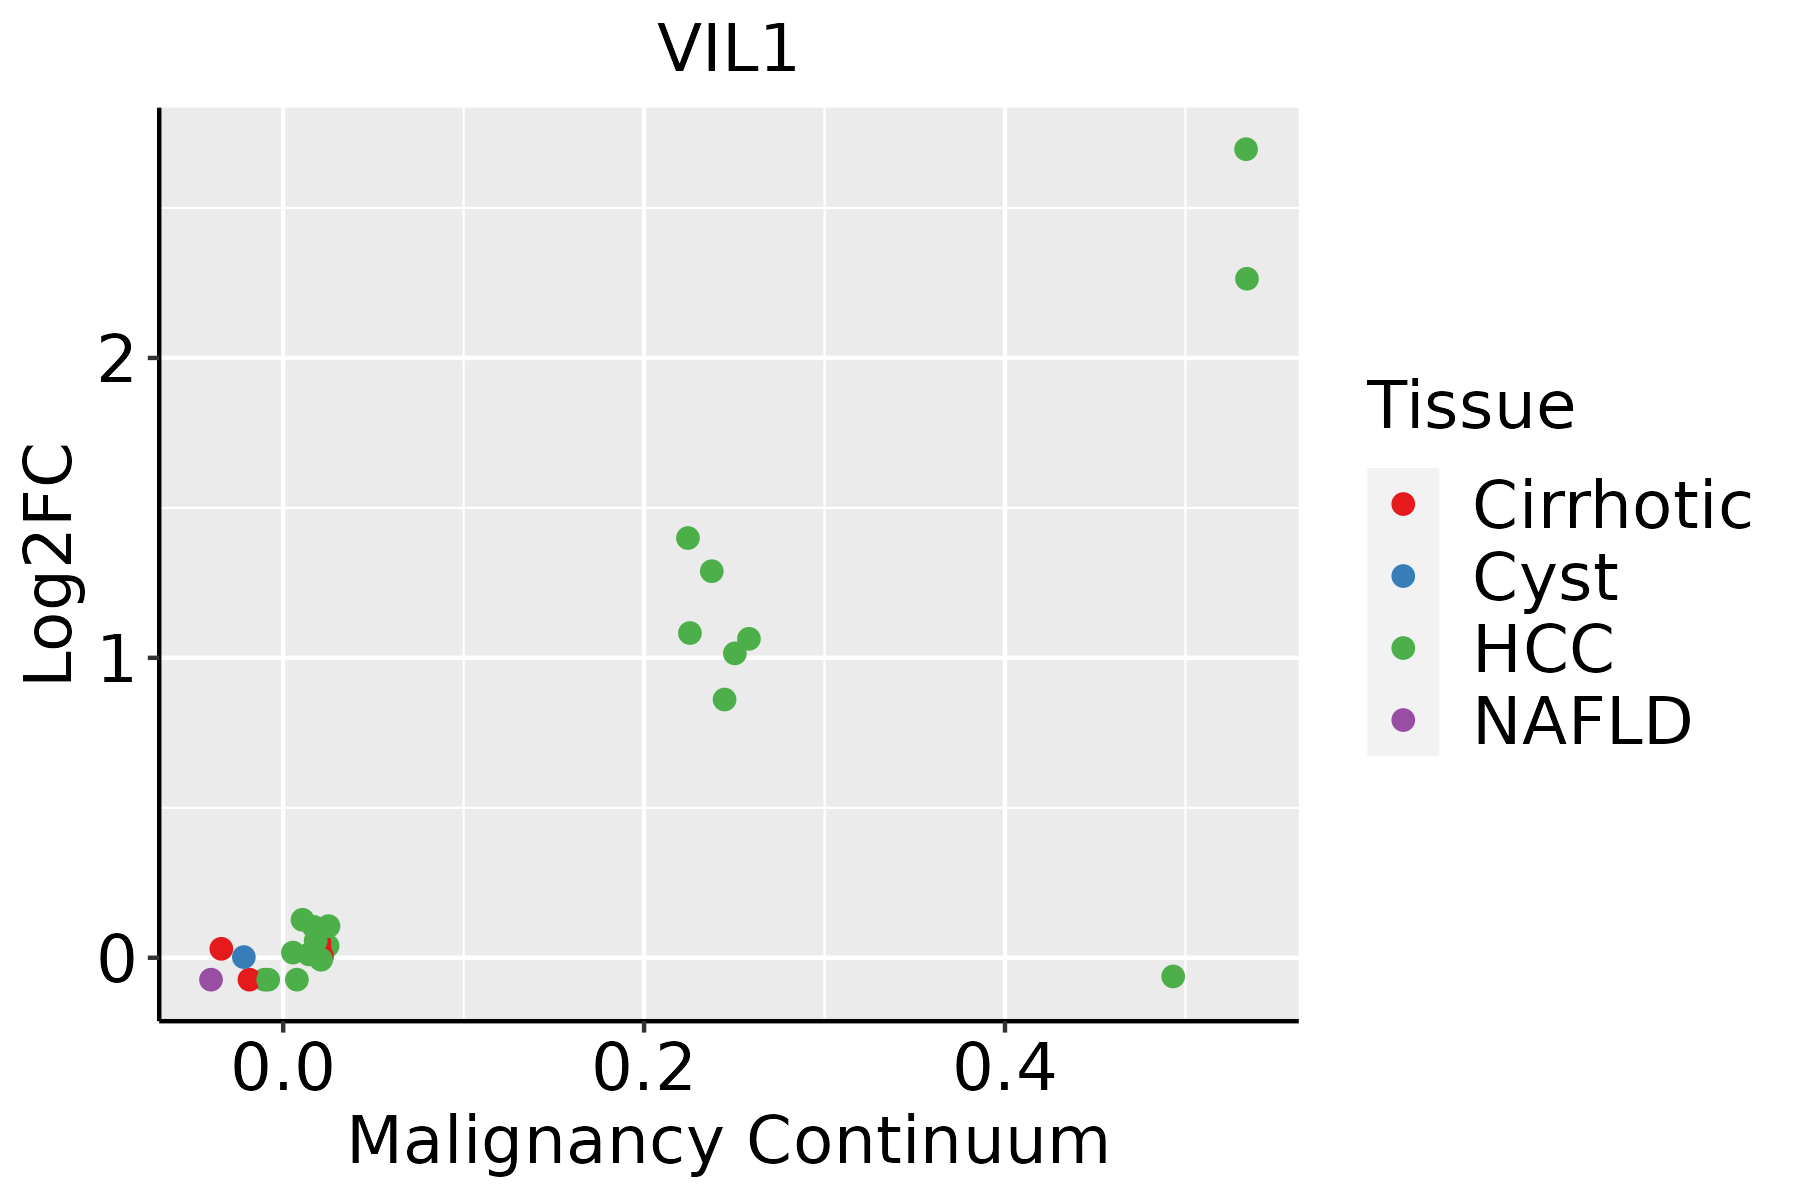 | HCC: Hepatocellular carcinoma |
| NAFLD: Non-alcoholic fatty liver disease |
| ∗log2FC in expression of this searched gene in stem-like cells from each diseased tissue sample relative to stem-like cells in normal samples in each tissue plotted against the malignancy continuum. Samples are colored based on if they are from different disease stage. |
Top |
Malignant transformation related pathway analysis |
| Find out the enriched GO biological processes and KEGG pathways involved in transition from healthy to precancer to cancer |
| Tissue | Disease Stage | Enriched GO biological Processes |
| Colorectum | AD |  |
| Colorectum | SER |  |
| Colorectum | MSS |  |
| Colorectum | MSI-H |  |
| Colorectum | FAP |  |
| ∗Top 15 enriched GO BP terms are showed in the bar plot of each disease state in each tissue. Each row represents a significant GO biological process which is colored according to the -log10(p.adjust). |
| Page: 1 2 3 4 5 6 7 8 9 |
| GO ID | Tissue | Disease Stage | Description | Gene Ratio | Bg Ratio | pvalue | p.adjust | Count |
| GO:0072659 | Colorectum | AD | protein localization to plasma membrane | 122/3918 | 284/18723 | 2.86e-17 | 1.49e-14 | 122 |
| GO:0007015 | Colorectum | AD | actin filament organization | 167/3918 | 442/18723 | 1.65e-16 | 7.94e-14 | 167 |
| GO:1990778 | Colorectum | AD | protein localization to cell periphery | 129/3918 | 333/18723 | 5.51e-14 | 1.15e-11 | 129 |
| GO:0032535 | Colorectum | AD | regulation of cellular component size | 142/3918 | 383/18723 | 1.74e-13 | 3.41e-11 | 142 |
| GO:1903829 | Colorectum | AD | positive regulation of cellular protein localization | 110/3918 | 276/18723 | 4.58e-13 | 8.44e-11 | 110 |
| GO:1902903 | Colorectum | AD | regulation of supramolecular fiber organization | 139/3918 | 383/18723 | 2.01e-12 | 3.19e-10 | 139 |
| GO:0032970 | Colorectum | AD | regulation of actin filament-based process | 142/3918 | 397/18723 | 4.05e-12 | 5.90e-10 | 142 |
| GO:0110053 | Colorectum | AD | regulation of actin filament organization | 108/3918 | 278/18723 | 5.02e-12 | 6.98e-10 | 108 |
| GO:0008154 | Colorectum | AD | actin polymerization or depolymerization | 90/3918 | 218/18723 | 6.14e-12 | 8.23e-10 | 90 |
| GO:0032271 | Colorectum | AD | regulation of protein polymerization | 94/3918 | 233/18723 | 1.01e-11 | 1.29e-09 | 94 |
| GO:0030041 | Colorectum | AD | actin filament polymerization | 81/3918 | 191/18723 | 1.35e-11 | 1.69e-09 | 81 |
| GO:0051258 | Colorectum | AD | protein polymerization | 112/3918 | 297/18723 | 1.85e-11 | 2.27e-09 | 112 |
| GO:0043254 | Colorectum | AD | regulation of protein-containing complex assembly | 148/3918 | 428/18723 | 2.64e-11 | 3.18e-09 | 148 |
| GO:0008064 | Colorectum | AD | regulation of actin polymerization or depolymerization | 79/3918 | 188/18723 | 4.17e-11 | 4.74e-09 | 79 |
| GO:0030833 | Colorectum | AD | regulation of actin filament polymerization | 74/3918 | 172/18723 | 4.50e-11 | 5.03e-09 | 74 |
| GO:0030832 | Colorectum | AD | regulation of actin filament length | 79/3918 | 189/18723 | 5.71e-11 | 6.27e-09 | 79 |
| GO:1902905 | Colorectum | AD | positive regulation of supramolecular fiber organization | 85/3918 | 209/18723 | 5.95e-11 | 6.33e-09 | 85 |
| GO:0032956 | Colorectum | AD | regulation of actin cytoskeleton organization | 127/3918 | 358/18723 | 1.03e-10 | 1.04e-08 | 127 |
| GO:0051495 | Colorectum | AD | positive regulation of cytoskeleton organization | 89/3918 | 226/18723 | 1.61e-10 | 1.56e-08 | 89 |
| GO:0032273 | Colorectum | AD | positive regulation of protein polymerization | 62/3918 | 138/18723 | 1.94e-10 | 1.76e-08 | 62 |
| Page: 1 2 3 4 5 6 7 8 9 10 11 12 13 14 15 16 17 18 19 20 21 22 23 24 25 26 27 28 29 30 31 32 33 34 35 36 37 38 39 40 |
| Pathway ID | Tissue | Disease Stage | Description | Gene Ratio | Bg Ratio | pvalue | p.adjust | qvalue | Count |
| Page: 1 |
Top |
Cell-cell communication analysis |
| Identification of potential cell-cell interactions between two cell types and their ligand-receptor pairs for different disease states |
| Ligand | Receptor | LRpair | Pathway | Tissue | Disease Stage |
| Page: 1 |
Top |
Single-cell gene regulatory network inference analysis |
| Find out the significant the regulons (TFs) and the target genes of each regulon across cell types for different disease states |
| TF | Cell Type | Tissue | Disease Stage | Target Gene | RSS | Regulon Activity |
| ∗The dot plots of a searched regulon are shown for all cell subpopulations in each disease state of each tissue based on the regulon specific score inferred using pySCENIC and by calculating the average expression. |
| Page: 1 |
Top |
Somatic mutation of malignant transformation related genes |
| Annotation of somatic variants for genes involved in malignant transformation |
| Hugo Symbol | Variant Class | Variant Classification | dbSNP RS | HGVSc | HGVSp | HGVSp Short | SWISSPROT | BIOTYPE | SIFT | PolyPhen | Tumor Sample Barcode | Tissue | Histology | Sex | Age | Stage | Therapy Types | Drugs | Outcome |
| VIL1 | SNV | Missense_Mutation | rs762246582 | c.2020N>A | p.Ala674Thr | p.A674T | P09327 | protein_coding | deleterious(0.04) | possibly_damaging(0.57) | TCGA-A2-A3Y0-01 | Breast | breast invasive carcinoma | Female | <65 | I/II | Chemotherapy | adriamycin | CR |
| VIL1 | SNV | Missense_Mutation | c.1473N>G | p.Ile491Met | p.I491M | P09327 | protein_coding | tolerated(0.14) | benign(0.196) | TCGA-AC-A23H-01 | Breast | breast invasive carcinoma | Female | >=65 | I/II | Unknown | Unknown | PD | |
| VIL1 | SNV | Missense_Mutation | c.2065N>A | p.Arg689Ser | p.R689S | P09327 | protein_coding | deleterious(0.01) | probably_damaging(1) | TCGA-B6-A0X4-01 | Breast | breast invasive carcinoma | Female | <65 | I/II | Unknown | Unknown | PD | |
| VIL1 | SNV | Missense_Mutation | rs370604646 | c.2065C>T | p.Arg689Cys | p.R689C | P09327 | protein_coding | deleterious(0) | probably_damaging(1) | TCGA-BH-A18G-01 | Breast | breast invasive carcinoma | Female | >=65 | I/II | Unknown | Unknown | SD |
| VIL1 | SNV | Missense_Mutation | rs750796385 | c.1333N>A | p.Val445Ile | p.V445I | P09327 | protein_coding | tolerated(0.94) | benign(0) | TCGA-D8-A1JF-01 | Breast | breast invasive carcinoma | Female | >=65 | III/IV | Unknown | Unknown | SD |
| VIL1 | insertion | Frame_Shift_Ins | novel | c.2478_2479insAAACAACAAAAAACAATGGCCAGGCATGGTGGCTCATGCC | p.Phe827LysfsTer74 | p.F827Kfs*74 | P09327 | protein_coding | TCGA-A2-A0CP-01 | Breast | breast invasive carcinoma | Female | <65 | I/II | Chemotherapy | cytoxan | SD | ||
| VIL1 | insertion | Frame_Shift_Ins | novel | c.1639_1640insT | p.Leu548ProfsTer16 | p.L548Pfs*16 | P09327 | protein_coding | TCGA-A8-A09Z-01 | Breast | breast invasive carcinoma | Female | >=65 | I/II | Unknown | Unknown | SD | ||
| VIL1 | insertion | In_Frame_Ins | novel | c.1641_1642insTTCATAGGAGACTACCCTGGAGGTTCTATCACCTATGTGGAA | p.Val547_Leu548insPheIleGlyAspTyrProGlyGlySerIleThrTyrValGlu | p.V547_L548insFIGDYPGGSITYVE | P09327 | protein_coding | TCGA-A8-A09Z-01 | Breast | breast invasive carcinoma | Female | >=65 | I/II | Unknown | Unknown | SD | ||
| VIL1 | insertion | Nonsense_Mutation | novel | c.68_69insTCACCTCCCAAAAGGCAGAAAATAAA | p.Arg23SerfsTer9 | p.R23Sfs*9 | P09327 | protein_coding | TCGA-AO-A0JF-01 | Breast | breast invasive carcinoma | Female | >=65 | I/II | Chemotherapy | doxorubicin | SD | ||
| VIL1 | deletion | Frame_Shift_Del | c.1858delC | p.Arg620GlyfsTer33 | p.R620Gfs*33 | P09327 | protein_coding | TCGA-BH-A0HA-01 | Breast | breast invasive carcinoma | Female | <65 | I/II | Unknown | Unknown | SD |
| Page: 1 2 3 4 5 6 7 8 9 |
Top |
Related drugs of malignant transformation related genes |
| Identification of chemicals and drugs interact with genes involved in malignant transfromation |
| (DGIdb 4.0) |
| Entrez ID | Symbol | Category | Interaction Types | Drug Claim Name | Drug Name | PMIDs |
| Page: 1 |

Copyright 2023-Present -The University of Texas Health Science Center at Houston |