
|
|||||
|
 | |
| |
| |
| |
| |
| |
|
Gene: VHL |
Gene summary for VHL |
| Gene information | Species | Human | Gene symbol | VHL | Gene ID | 7428 |
| Gene name | von Hippel-Lindau tumor suppressor | |
| Gene Alias | HRCA1 | |
| Cytomap | 3p25.3 | |
| Gene Type | protein-coding | GO ID | GO:0000122 | UniProtAcc | A0A024R2F2 |
Top |
Malignant transformation analysis |
| Identification of the aberrant gene expression in precancerous and cancerous lesions by comparing the gene expression of stem-like cells in diseased tissues with normal stem cells |
| Entrez ID | Symbol | Replicates | Species | Organ | Tissue | Adj P-value | Log2FC | Malignancy |
| 7428 | VHL | LZE2T | Human | Esophagus | ESCC | 5.27e-03 | 3.09e-01 | 0.082 |
| 7428 | VHL | LZE4T | Human | Esophagus | ESCC | 1.49e-07 | 1.78e-01 | 0.0811 |
| 7428 | VHL | LZE5T | Human | Esophagus | ESCC | 2.30e-02 | 1.69e-01 | 0.0514 |
| 7428 | VHL | LZE7T | Human | Esophagus | ESCC | 7.16e-05 | 1.95e-01 | 0.0667 |
| 7428 | VHL | LZE8T | Human | Esophagus | ESCC | 7.58e-03 | 1.25e-01 | 0.067 |
| 7428 | VHL | LZE22T | Human | Esophagus | ESCC | 6.42e-04 | 3.87e-01 | 0.068 |
| 7428 | VHL | LZE24T | Human | Esophagus | ESCC | 2.65e-09 | 3.07e-01 | 0.0596 |
| 7428 | VHL | LZE6T | Human | Esophagus | ESCC | 1.53e-03 | 1.18e-01 | 0.0845 |
| 7428 | VHL | P1T-E | Human | Esophagus | ESCC | 1.77e-04 | 2.42e-01 | 0.0875 |
| 7428 | VHL | P2T-E | Human | Esophagus | ESCC | 8.83e-37 | 6.32e-01 | 0.1177 |
| 7428 | VHL | P4T-E | Human | Esophagus | ESCC | 1.17e-28 | 7.36e-01 | 0.1323 |
| 7428 | VHL | P5T-E | Human | Esophagus | ESCC | 3.58e-28 | 6.75e-01 | 0.1327 |
| 7428 | VHL | P8T-E | Human | Esophagus | ESCC | 7.15e-12 | 2.77e-01 | 0.0889 |
| 7428 | VHL | P9T-E | Human | Esophagus | ESCC | 1.71e-08 | 1.48e-01 | 0.1131 |
| 7428 | VHL | P10T-E | Human | Esophagus | ESCC | 5.31e-36 | 6.94e-01 | 0.116 |
| 7428 | VHL | P11T-E | Human | Esophagus | ESCC | 1.04e-10 | 4.73e-01 | 0.1426 |
| 7428 | VHL | P12T-E | Human | Esophagus | ESCC | 4.12e-20 | 4.41e-01 | 0.1122 |
| 7428 | VHL | P15T-E | Human | Esophagus | ESCC | 1.04e-12 | 3.22e-01 | 0.1149 |
| 7428 | VHL | P16T-E | Human | Esophagus | ESCC | 2.15e-24 | 5.39e-01 | 0.1153 |
| 7428 | VHL | P17T-E | Human | Esophagus | ESCC | 1.85e-05 | 1.84e-01 | 0.1278 |
| Page: 1 2 3 4 |
| Tissue | Expression Dynamics | Abbreviation |
| Esophagus | 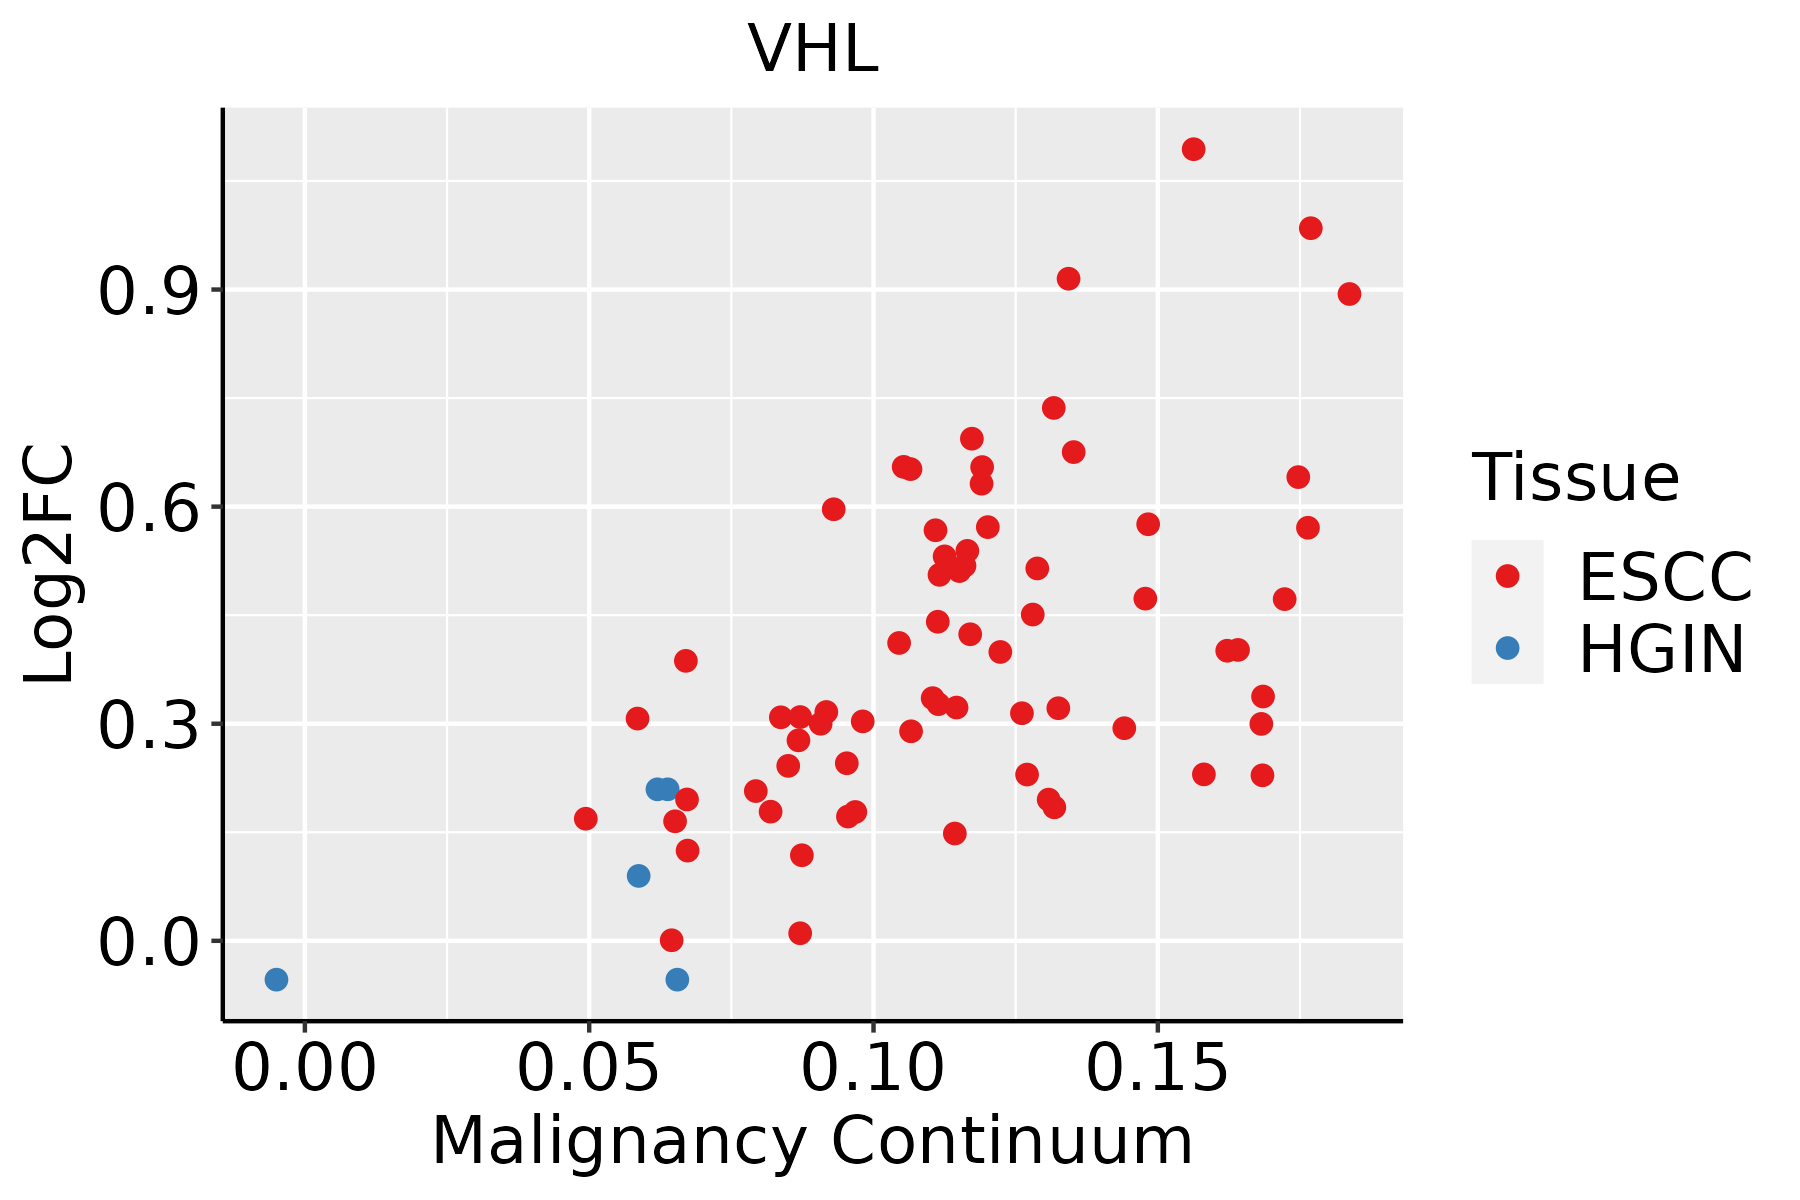 | ESCC: Esophageal squamous cell carcinoma |
| HGIN: High-grade intraepithelial neoplasias | ||
| LGIN: Low-grade intraepithelial neoplasias | ||
| Liver |  | HCC: Hepatocellular carcinoma |
| NAFLD: Non-alcoholic fatty liver disease |
| ∗log2FC in expression of this searched gene in stem-like cells from each diseased tissue sample relative to stem-like cells in normal samples in each tissue plotted against the malignancy continuum. Samples are colored based on if they are from different disease stage. |
Top |
Malignant transformation related pathway analysis |
| Find out the enriched GO biological processes and KEGG pathways involved in transition from healthy to precancer to cancer |
| Tissue | Disease Stage | Enriched GO biological Processes |
| Colorectum | AD |  |
| Colorectum | SER |  |
| Colorectum | MSS |  |
| Colorectum | MSI-H |  |
| Colorectum | FAP |  |
| ∗Top 15 enriched GO BP terms are showed in the bar plot of each disease state in each tissue. Each row represents a significant GO biological process which is colored according to the -log10(p.adjust). |
| Page: 1 2 3 4 5 6 7 8 9 |
| GO ID | Tissue | Disease Stage | Description | Gene Ratio | Bg Ratio | pvalue | p.adjust | Count |
| GO:0031647111 | Esophagus | ESCC | regulation of protein stability | 223/8552 | 298/18723 | 5.76e-25 | 1.52e-22 | 223 |
| GO:0050821111 | Esophagus | ESCC | protein stabilization | 140/8552 | 191/18723 | 6.50e-15 | 3.61e-13 | 140 |
| GO:0070482111 | Esophagus | ESCC | response to oxygen levels | 218/8552 | 347/18723 | 6.91e-11 | 2.17e-09 | 218 |
| GO:0043618111 | Esophagus | ESCC | regulation of transcription from RNA polymerase II promoter in response to stress | 42/8552 | 47/18723 | 3.91e-10 | 1.05e-08 | 42 |
| GO:0043620111 | Esophagus | ESCC | regulation of DNA-templated transcription in response to stress | 46/8552 | 53/18723 | 5.17e-10 | 1.33e-08 | 46 |
| GO:0036293111 | Esophagus | ESCC | response to decreased oxygen levels | 201/8552 | 322/18723 | 8.37e-10 | 2.04e-08 | 201 |
| GO:0001666111 | Esophagus | ESCC | response to hypoxia | 192/8552 | 307/18723 | 1.59e-09 | 3.69e-08 | 192 |
| GO:0071453110 | Esophagus | ESCC | cellular response to oxygen levels | 114/8552 | 177/18723 | 3.63e-07 | 5.06e-06 | 114 |
| GO:0036294110 | Esophagus | ESCC | cellular response to decreased oxygen levels | 105/8552 | 161/18723 | 4.20e-07 | 5.73e-06 | 105 |
| GO:007145616 | Esophagus | ESCC | cellular response to hypoxia | 97/8552 | 151/18723 | 3.12e-06 | 3.51e-05 | 97 |
| GO:00614184 | Esophagus | ESCC | regulation of transcription from RNA polymerase II promoter in response to hypoxia | 13/8552 | 13/18723 | 3.75e-05 | 3.04e-04 | 13 |
| GO:009720115 | Esophagus | ESCC | negative regulation of transcription from RNA polymerase II promoter in response to stress | 11/8552 | 12/18723 | 1.26e-03 | 6.06e-03 | 11 |
| GO:0046426 | Esophagus | ESCC | negative regulation of receptor signaling pathway via JAK-STAT | 19/8552 | 28/18723 | 1.49e-02 | 4.84e-02 | 19 |
| GO:003164722 | Liver | HCC | regulation of protein stability | 211/7958 | 298/18723 | 2.29e-23 | 5.01e-21 | 211 |
| GO:005082122 | Liver | HCC | protein stabilization | 139/7958 | 191/18723 | 1.61e-17 | 1.71e-15 | 139 |
| GO:004362022 | Liver | HCC | regulation of DNA-templated transcription in response to stress | 43/7958 | 53/18723 | 9.27e-09 | 2.33e-07 | 43 |
| GO:004361822 | Liver | HCC | regulation of transcription from RNA polymerase II promoter in response to stress | 37/7958 | 47/18723 | 4.37e-07 | 7.23e-06 | 37 |
| GO:000166612 | Liver | HCC | response to hypoxia | 172/7958 | 307/18723 | 1.06e-06 | 1.59e-05 | 172 |
| GO:003629312 | Liver | HCC | response to decreased oxygen levels | 179/7958 | 322/18723 | 1.29e-06 | 1.87e-05 | 179 |
| GO:007048212 | Liver | HCC | response to oxygen levels | 191/7958 | 347/18723 | 1.42e-06 | 2.03e-05 | 191 |
| Page: 1 2 |
| Pathway ID | Tissue | Disease Stage | Description | Gene Ratio | Bg Ratio | pvalue | p.adjust | qvalue | Count |
| hsa0412027 | Esophagus | ESCC | Ubiquitin mediated proteolysis | 122/4205 | 142/8465 | 6.53e-20 | 7.29e-18 | 3.74e-18 | 122 |
| hsa0521118 | Esophagus | ESCC | Renal cell carcinoma | 51/4205 | 69/8465 | 3.29e-05 | 1.53e-04 | 7.83e-05 | 51 |
| hsa0406629 | Esophagus | ESCC | HIF-1 signaling pathway | 75/4205 | 109/8465 | 3.66e-05 | 1.68e-04 | 8.60e-05 | 75 |
| hsa0412036 | Esophagus | ESCC | Ubiquitin mediated proteolysis | 122/4205 | 142/8465 | 6.53e-20 | 7.29e-18 | 3.74e-18 | 122 |
| hsa0521119 | Esophagus | ESCC | Renal cell carcinoma | 51/4205 | 69/8465 | 3.29e-05 | 1.53e-04 | 7.83e-05 | 51 |
| hsa04066113 | Esophagus | ESCC | HIF-1 signaling pathway | 75/4205 | 109/8465 | 3.66e-05 | 1.68e-04 | 8.60e-05 | 75 |
| hsa0412041 | Liver | HCC | Ubiquitin mediated proteolysis | 110/4020 | 142/8465 | 1.67e-13 | 3.74e-12 | 2.08e-12 | 110 |
| hsa0521121 | Liver | HCC | Renal cell carcinoma | 51/4020 | 69/8465 | 6.76e-06 | 5.53e-05 | 3.07e-05 | 51 |
| hsa0406622 | Liver | HCC | HIF-1 signaling pathway | 70/4020 | 109/8465 | 2.96e-04 | 1.36e-03 | 7.57e-04 | 70 |
| hsa0412051 | Liver | HCC | Ubiquitin mediated proteolysis | 110/4020 | 142/8465 | 1.67e-13 | 3.74e-12 | 2.08e-12 | 110 |
| hsa0521131 | Liver | HCC | Renal cell carcinoma | 51/4020 | 69/8465 | 6.76e-06 | 5.53e-05 | 3.07e-05 | 51 |
| hsa0406632 | Liver | HCC | HIF-1 signaling pathway | 70/4020 | 109/8465 | 2.96e-04 | 1.36e-03 | 7.57e-04 | 70 |
| Page: 1 |
Top |
Cell-cell communication analysis |
| Identification of potential cell-cell interactions between two cell types and their ligand-receptor pairs for different disease states |
| Ligand | Receptor | LRpair | Pathway | Tissue | Disease Stage |
| Page: 1 |
Top |
Single-cell gene regulatory network inference analysis |
| Find out the significant the regulons (TFs) and the target genes of each regulon across cell types for different disease states |
| TF | Cell Type | Tissue | Disease Stage | Target Gene | RSS | Regulon Activity |
| ∗The dot plots of a searched regulon are shown for all cell subpopulations in each disease state of each tissue based on the regulon specific score inferred using pySCENIC and by calculating the average expression. |
| Page: 1 |
Top |
Somatic mutation of malignant transformation related genes |
| Annotation of somatic variants for genes involved in malignant transformation |
| Hugo Symbol | Variant Class | Variant Classification | dbSNP RS | HGVSc | HGVSp | HGVSp Short | SWISSPROT | BIOTYPE | SIFT | PolyPhen | Tumor Sample Barcode | Tissue | Histology | Sex | Age | Stage | Therapy Types | Drugs | Outcome |
| VHL | insertion | Frame_Shift_Ins | novel | c.468_469insTGTGTAGAGCATGAGATATTTTGGCTTATTTGTTGCTG | p.Thr157CysfsTer13 | p.T157Cfs*13 | P40337 | protein_coding | TCGA-A2-A0EO-01 | Breast | breast invasive carcinoma | Female | <65 | I/II | Hormone Therapy | tamoxiphen | SD | ||
| VHL | SNV | Missense_Mutation | rs373068386 | c.154N>A | p.Glu52Lys | p.E52K | P40337 | protein_coding | tolerated(0.15) | benign(0) | TCGA-AZ-6599-01 | Colorectum | colon adenocarcinoma | Male | >=65 | I/II | Unknown | Unknown | SD |
| VHL | SNV | Missense_Mutation | rs367545984 | c.556N>A | p.Glu186Lys | p.E186K | P40337 | protein_coding | tolerated(0.08) | possibly_damaging(0.779) | TCGA-AG-A002-01 | Colorectum | rectum adenocarcinoma | Male | <65 | I/II | Unknown | Unknown | SD |
| VHL | deletion | Frame_Shift_Del | novel | c.410delN | p.Val137GlyfsTer22 | p.V137Gfs*22 | P40337 | protein_coding | TCGA-A6-3807-01 | Colorectum | colon adenocarcinoma | Female | <65 | III/IV | Ancillary | leucovorin | SD | ||
| VHL | deletion | Frame_Shift_Del | novel | c.412_415delNNNN | p.Pro138LeufsTer20 | p.P138Lfs*20 | P40337 | protein_coding | TCGA-A6-3807-01 | Colorectum | colon adenocarcinoma | Female | <65 | III/IV | Ancillary | leucovorin | SD | ||
| VHL | deletion | Frame_Shift_Del | c.440delN | p.Phe148LeufsTer11 | p.F148Lfs*11 | P40337 | protein_coding | TCGA-AA-3845-01 | Colorectum | colon adenocarcinoma | Female | >=65 | I/II | Unknown | Unknown | PD | |||
| VHL | SNV | Missense_Mutation | c.430N>A | p.Gly144Arg | p.G144R | P40337 | protein_coding | deleterious(0) | probably_damaging(1) | TCGA-A5-A1OF-01 | Endometrium | uterine corpus endometrioid carcinoma | Female | <65 | I/II | Unknown | Unknown | SD | |
| VHL | SNV | Missense_Mutation | c.430N>A | p.Gly144Arg | p.G144R | P40337 | protein_coding | deleterious(0) | probably_damaging(1) | TCGA-BG-A0MT-01 | Endometrium | uterine corpus endometrioid carcinoma | Female | <65 | I/II | Unknown | Unknown | PD | |
| VHL | SNV | Missense_Mutation | rs5030820 | c.499N>T | p.Arg167Trp | p.R167W | P40337 | protein_coding | deleterious(0) | probably_damaging(1) | TCGA-BG-A18C-01 | Endometrium | uterine corpus endometrioid carcinoma | Female | >=65 | I/II | Unknown | Unknown | SD |
| VHL | SNV | Missense_Mutation | rs199926195 | c.613N>T | p.Arg205Cys | p.R205C | P40337 | protein_coding | deleterious(0.01) | benign(0.015) | TCGA-BG-A220-01 | Endometrium | uterine corpus endometrioid carcinoma | Female | >=65 | I/II | Unknown | Unknown | SD |
| Page: 1 2 |
Top |
Related drugs of malignant transformation related genes |
| Identification of chemicals and drugs interact with genes involved in malignant transfromation |
| (DGIdb 4.0) |
| Entrez ID | Symbol | Category | Interaction Types | Drug Claim Name | Drug Name | PMIDs |
| 7428 | VHL | CLINICALLY ACTIONABLE, DRUG RESISTANCE, TRANSCRIPTION FACTOR | Everolimus | EVEROLIMUS | 26951309 | |
| 7428 | VHL | CLINICALLY ACTIONABLE, DRUG RESISTANCE, TRANSCRIPTION FACTOR | Alpha 2 Interferon | 16827904 | ||
| 7428 | VHL | CLINICALLY ACTIONABLE, DRUG RESISTANCE, TRANSCRIPTION FACTOR | CB-839 | TELAGLENASTAT | 28346230 | |
| 7428 | VHL | CLINICALLY ACTIONABLE, DRUG RESISTANCE, TRANSCRIPTION FACTOR | STF-62247 | 18769110,18598947 | ||
| 7428 | VHL | CLINICALLY ACTIONABLE, DRUG RESISTANCE, TRANSCRIPTION FACTOR | ELR510444 | 22295124 | ||
| 7428 | VHL | CLINICALLY ACTIONABLE, DRUG RESISTANCE, TRANSCRIPTION FACTOR | Saracatinib | SARACATINIB | 26802156 | |
| 7428 | VHL | CLINICALLY ACTIONABLE, DRUG RESISTANCE, TRANSCRIPTION FACTOR | ANTI-VEGF MONOCLONAL ANTIBODY | 28103578 | ||
| 7428 | VHL | CLINICALLY ACTIONABLE, DRUG RESISTANCE, TRANSCRIPTION FACTOR | Trametinib | TRAMETINIB | 26487278 | |
| 7428 | VHL | CLINICALLY ACTIONABLE, DRUG RESISTANCE, TRANSCRIPTION FACTOR | EVEROLIMUS | EVEROLIMUS | 26951309 | |
| 7428 | VHL | CLINICALLY ACTIONABLE, DRUG RESISTANCE, TRANSCRIPTION FACTOR | NICOTINE | NICOTINE | 14555188 |
| Page: 1 2 3 |

Copyright 2023-Present -The University of Texas Health Science Center at Houston |