| GO ID | Tissue | Disease Stage | Description | Gene Ratio | Bg Ratio | pvalue | p.adjust | Count |
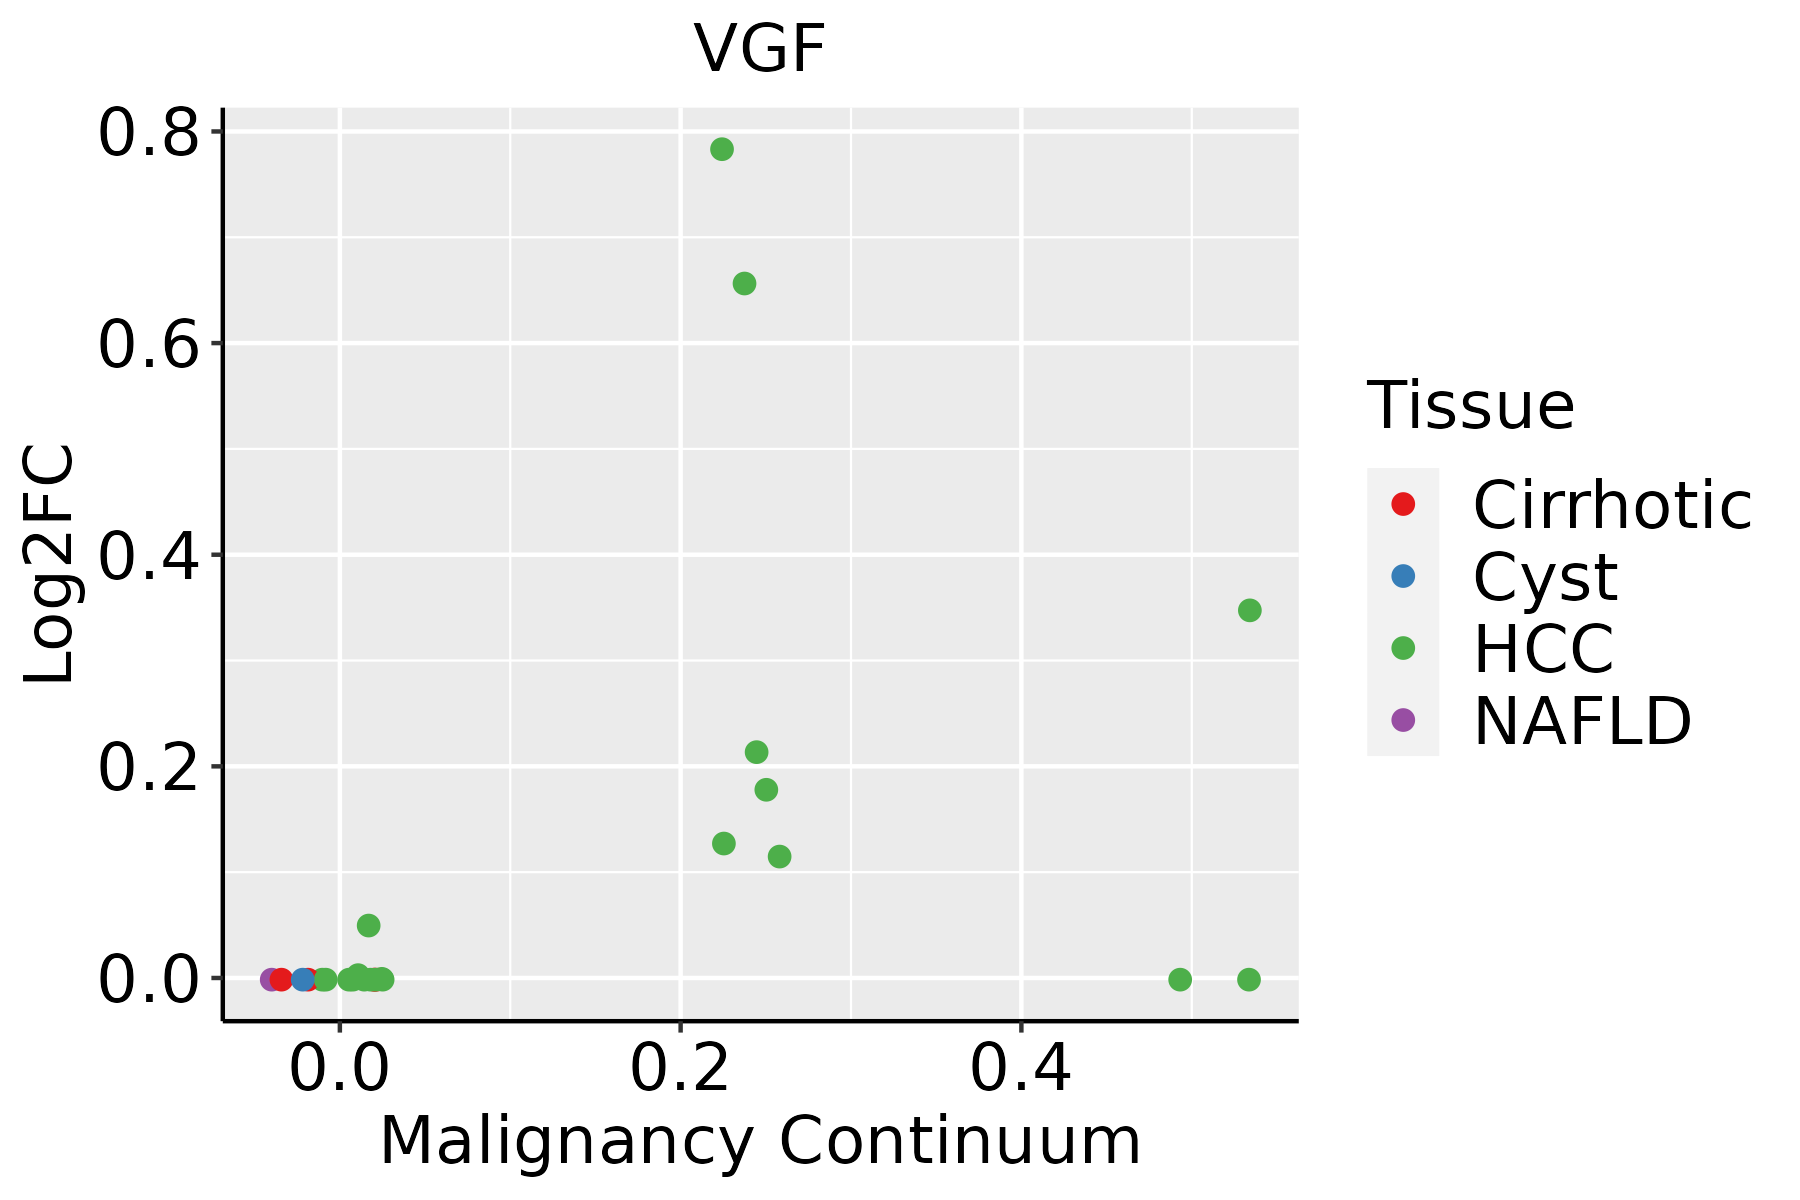
| GO:000609122 | Liver | HCC | generation of precursor metabolites and energy | 340/7958 | 490/18723 | 4.04e-34 | 2.85e-31 | 340 |
| GO:003286821 | Liver | HCC | response to insulin | 172/7958 | 264/18723 | 7.14e-14 | 4.23e-12 | 172 |
| GO:004343422 | Liver | HCC | response to peptide hormone | 247/7958 | 414/18723 | 9.55e-13 | 4.77e-11 | 247 |
| GO:003166722 | Liver | HCC | response to nutrient levels | 276/7958 | 474/18723 | 2.30e-12 | 1.08e-10 | 276 |
| GO:000926611 | Liver | HCC | response to temperature stimulus | 101/7958 | 178/18723 | 8.55e-05 | 7.48e-04 | 101 |
| GO:005159121 | Liver | HCC | response to cAMP | 57/7958 | 93/18723 | 1.96e-04 | 1.52e-03 | 57 |
| GO:001407421 | Liver | HCC | response to purine-containing compound | 84/7958 | 148/18723 | 3.19e-04 | 2.26e-03 | 84 |
| GO:004259322 | Liver | HCC | glucose homeostasis | 137/7958 | 258/18723 | 3.59e-04 | 2.49e-03 | 137 |
| GO:003350022 | Liver | HCC | carbohydrate homeostasis | 137/7958 | 259/18723 | 4.45e-04 | 2.98e-03 | 137 |
| GO:004668321 | Liver | HCC | response to organophosphorus | 73/7958 | 131/18723 | 1.52e-03 | 8.05e-03 | 73 |
| GO:003559212 | Liver | HCC | establishment of protein localization to extracellular region | 176/7958 | 360/18723 | 7.96e-03 | 3.15e-02 | 176 |
| GO:000930612 | Liver | HCC | protein secretion | 175/7958 | 359/18723 | 9.32e-03 | 3.57e-02 | 175 |
| GO:006145811 | Liver | HCC | reproductive system development | 205/7958 | 427/18723 | 1.16e-02 | 4.27e-02 | 205 |
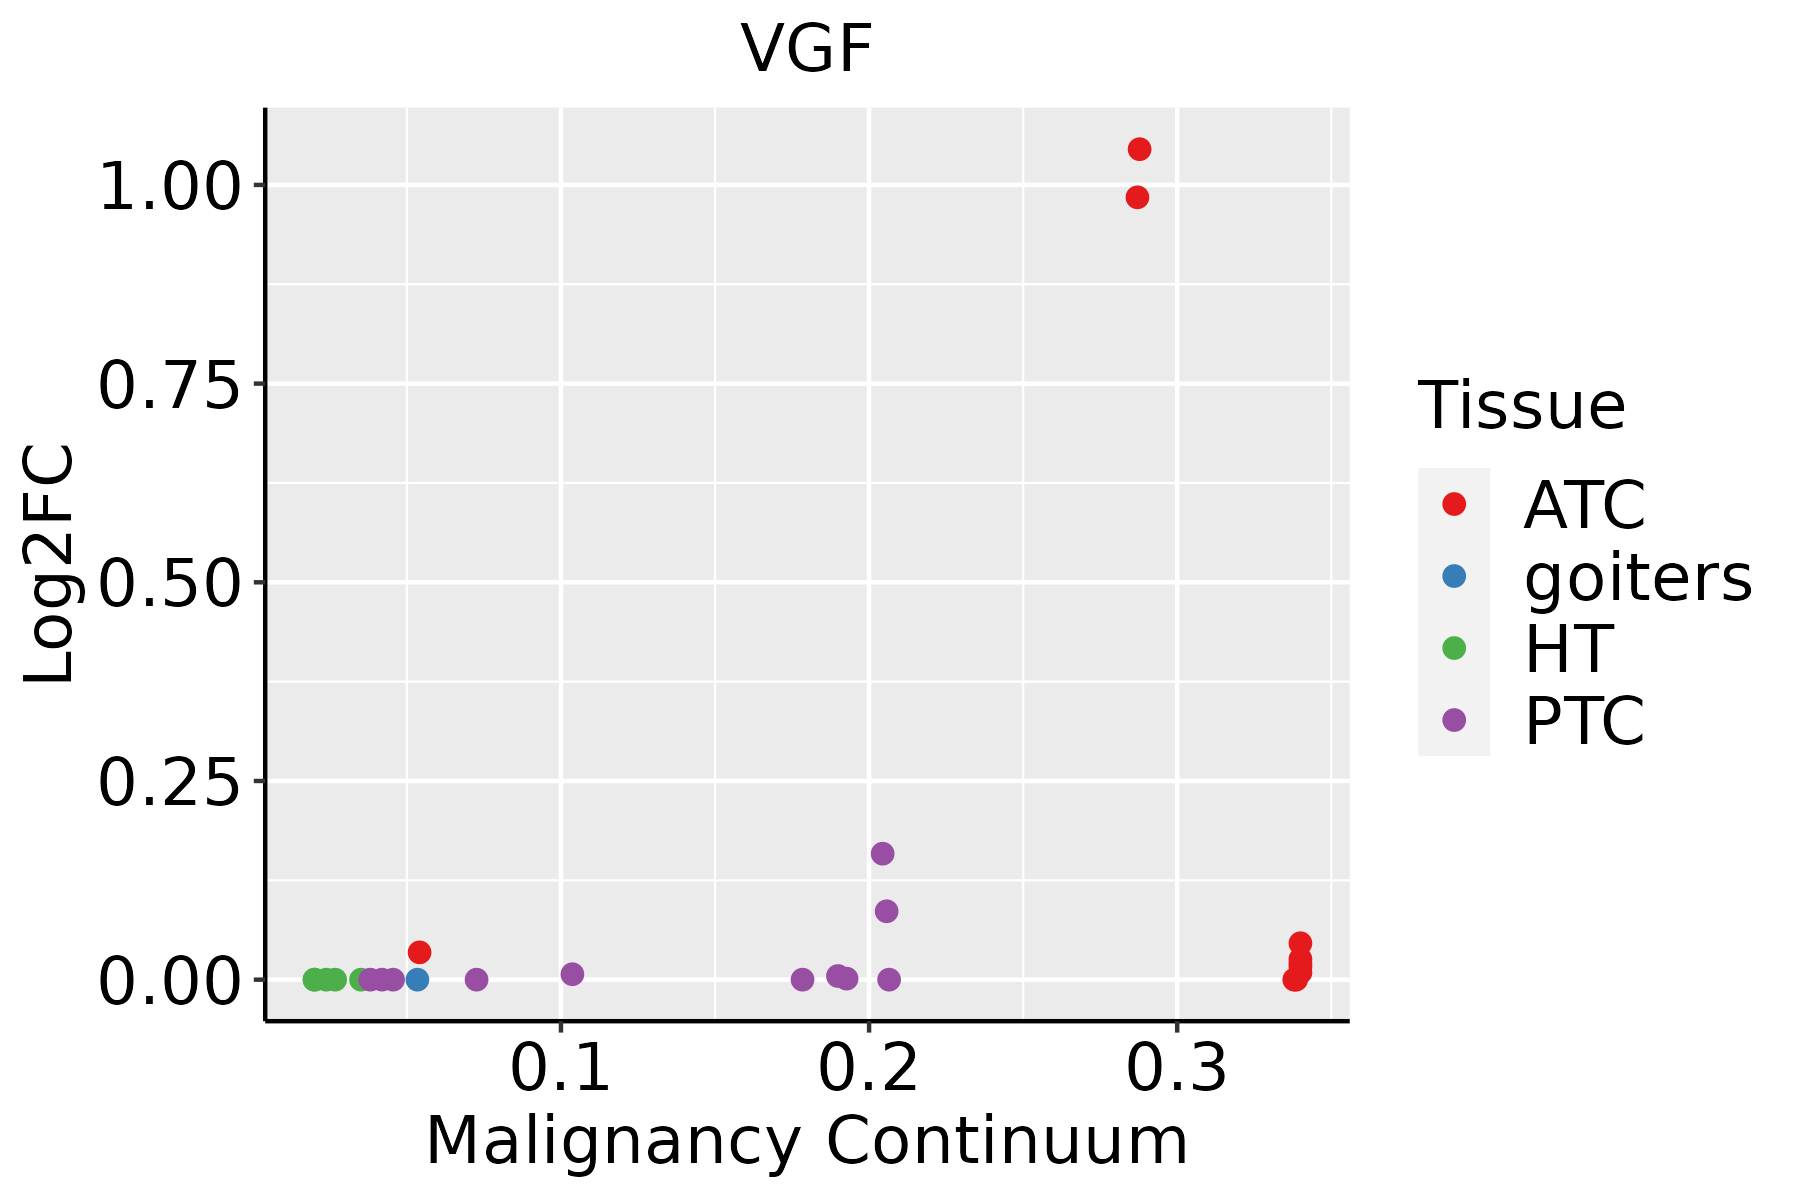
| GO:000609134 | Thyroid | ATC | generation of precursor metabolites and energy | 256/6293 | 490/18723 | 6.55e-18 | 7.69e-16 | 256 |
| GO:004343428 | Thyroid | ATC | response to peptide hormone | 192/6293 | 414/18723 | 3.63e-08 | 6.70e-07 | 192 |
| GO:0031667210 | Thyroid | ATC | response to nutrient levels | 212/6293 | 474/18723 | 2.37e-07 | 3.70e-06 | 212 |
| GO:006145827 | Thyroid | ATC | reproductive system development | 193/6293 | 427/18723 | 3.32e-07 | 4.92e-06 | 193 |
| GO:004860825 | Thyroid | ATC | reproductive structure development | 190/6293 | 424/18723 | 8.40e-07 | 1.11e-05 | 190 |
| GO:003286824 | Thyroid | ATC | response to insulin | 126/6293 | 264/18723 | 1.24e-06 | 1.59e-05 | 126 |
| GO:000926632 | Thyroid | ATC | response to temperature stimulus | 83/6293 | 178/18723 | 2.03e-04 | 1.35e-03 | 83 |
| Hugo Symbol | Variant Class | Variant Classification | dbSNP RS | HGVSc | HGVSp | HGVSp Short | SWISSPROT | BIOTYPE | SIFT | PolyPhen | Tumor Sample Barcode | Tissue | Histology | Sex | Age | Stage | Therapy Types | Drugs | Outcome |
| VGF | SNV | Missense_Mutation | novel | c.594G>T | p.Glu198Asp | p.E198D | O15240 | protein_coding | deleterious_low_confidence(0) | possibly_damaging(0.806) | TCGA-C8-A8HP-01 | Breast | breast invasive carcinoma | Female | <65 | III/IV | Chemotherapy | 5-fluorouracil | CR |
| VGF | SNV | Missense_Mutation | | c.1712N>T | p.Pro571Leu | p.P571L | O15240 | protein_coding | tolerated_low_confidence(0.05) | benign(0.33) | TCGA-E9-A1NA-01 | Breast | breast invasive carcinoma | Female | <65 | I/II | Chemotherapy | cyclophosphamide | SD |
| VGF | SNV | Missense_Mutation | | c.1812G>C | p.Glu604Asp | p.E604D | O15240 | protein_coding | deleterious_low_confidence(0.02) | benign(0.025) | TCGA-DR-A0ZM-01 | Cervix | cervical & endocervical cancer | Female | <65 | III/IV | Unspecific | Cisplatin | SD |
| VGF | SNV | Missense_Mutation | novel | c.28N>A | p.Ala10Thr | p.A10T | O15240 | protein_coding | tolerated_low_confidence(0.27) | benign(0) | TCGA-AZ-4315-01 | Colorectum | colon adenocarcinoma | Male | <65 | I/II | Unknown | Unknown | SD |
| VGF | SNV | Missense_Mutation | rs532601632 | c.1136N>T | p.Gly379Val | p.G379V | O15240 | protein_coding | tolerated_low_confidence(0.1) | benign(0.095) | TCGA-CK-4951-01 | Colorectum | colon adenocarcinoma | Female | >=65 | I/II | Unknown | Unknown | PD |
| VGF | SNV | Missense_Mutation | novel | c.1337N>G | p.Glu446Gly | p.E446G | O15240 | protein_coding | deleterious_low_confidence(0.01) | benign(0.162) | TCGA-CK-6746-01 | Colorectum | colon adenocarcinoma | Female | >=65 | I/II | Unknown | Unknown | SD |
| VGF | SNV | Missense_Mutation | | c.1329C>G | p.Asp443Glu | p.D443E | O15240 | protein_coding | deleterious_low_confidence(0.02) | possibly_damaging(0.464) | TCGA-G4-6588-01 | Colorectum | colon adenocarcinoma | Female | <65 | I/II | Unknown | Unknown | SD |
| VGF | SNV | Missense_Mutation | rs761504889 | c.1723C>T | p.His575Tyr | p.H575Y | O15240 | protein_coding | tolerated_low_confidence(0.31) | benign(0) | TCGA-EI-6881-01 | Colorectum | rectum adenocarcinoma | Male | <65 | III/IV | Chemotherapy | 5 | SD |
| VGF | SNV | Missense_Mutation | | c.801N>T | p.Lys267Asn | p.K267N | O15240 | protein_coding | deleterious_low_confidence(0) | possibly_damaging(0.898) | TCGA-AP-A059-01 | Endometrium | uterine corpus endometrioid carcinoma | Female | >=65 | I/II | Unknown | Unknown | SD |
| VGF | SNV | Missense_Mutation | novel | c.502N>T | p.Asp168Tyr | p.D168Y | O15240 | protein_coding | deleterious_low_confidence(0) | possibly_damaging(0.66) | TCGA-B5-A1MR-01 | Endometrium | uterine corpus endometrioid carcinoma | Female | >=65 | III/IV | Unknown | Unknown | SD |