
|
|||||
|
 | |
| |
| |
| |
| |
| |
|
Gene: VEZT |
Gene summary for VEZT |
| Gene information | Species | Human | Gene symbol | VEZT | Gene ID | 55591 |
| Gene name | vezatin, adherens junctions transmembrane protein | |
| Gene Alias | VEZATIN | |
| Cytomap | 12q22 | |
| Gene Type | protein-coding | GO ID | GO:0007155 | UniProtAcc | Q9HBM0 |
Top |
Malignant transformation analysis |
| Identification of the aberrant gene expression in precancerous and cancerous lesions by comparing the gene expression of stem-like cells in diseased tissues with normal stem cells |
| Entrez ID | Symbol | Replicates | Species | Organ | Tissue | Adj P-value | Log2FC | Malignancy |
| 55591 | VEZT | CCI_2 | Human | Cervix | CC | 3.30e-05 | 6.50e-01 | 0.5249 |
| 55591 | VEZT | CCI_3 | Human | Cervix | CC | 6.77e-04 | 6.74e-01 | 0.516 |
| 55591 | VEZT | sample3 | Human | Cervix | CC | 2.58e-04 | 2.69e-01 | 0.1387 |
| 55591 | VEZT | T3 | Human | Cervix | CC | 5.73e-05 | 2.65e-01 | 0.1389 |
| 55591 | VEZT | LZE4T | Human | Esophagus | ESCC | 1.02e-15 | 4.84e-01 | 0.0811 |
| 55591 | VEZT | LZE5T | Human | Esophagus | ESCC | 2.90e-04 | 5.43e-01 | 0.0514 |
| 55591 | VEZT | LZE7T | Human | Esophagus | ESCC | 7.30e-22 | 4.26e-01 | 0.0667 |
| 55591 | VEZT | LZE8T | Human | Esophagus | ESCC | 9.24e-14 | 3.06e-01 | 0.067 |
| 55591 | VEZT | LZE20T | Human | Esophagus | ESCC | 2.64e-03 | 1.62e-01 | 0.0662 |
| 55591 | VEZT | LZE22T | Human | Esophagus | ESCC | 4.57e-07 | 3.57e-01 | 0.068 |
| 55591 | VEZT | LZE24T | Human | Esophagus | ESCC | 5.87e-25 | 4.63e-01 | 0.0596 |
| 55591 | VEZT | LZE21T | Human | Esophagus | ESCC | 5.96e-05 | 2.57e-01 | 0.0655 |
| 55591 | VEZT | LZE6T | Human | Esophagus | ESCC | 7.11e-04 | 2.31e-01 | 0.0845 |
| 55591 | VEZT | P1T-E | Human | Esophagus | ESCC | 2.81e-05 | 3.39e-01 | 0.0875 |
| 55591 | VEZT | P2T-E | Human | Esophagus | ESCC | 3.00e-75 | 1.35e+00 | 0.1177 |
| 55591 | VEZT | P4T-E | Human | Esophagus | ESCC | 3.61e-41 | 9.54e-01 | 0.1323 |
| 55591 | VEZT | P5T-E | Human | Esophagus | ESCC | 3.55e-27 | 5.87e-01 | 0.1327 |
| 55591 | VEZT | P8T-E | Human | Esophagus | ESCC | 6.38e-53 | 9.97e-01 | 0.0889 |
| 55591 | VEZT | P9T-E | Human | Esophagus | ESCC | 2.98e-19 | 4.28e-01 | 0.1131 |
| 55591 | VEZT | P10T-E | Human | Esophagus | ESCC | 6.73e-39 | 6.61e-01 | 0.116 |
| Page: 1 2 3 4 5 6 7 8 9 |
| Tissue | Expression Dynamics | Abbreviation |
| Cervix | 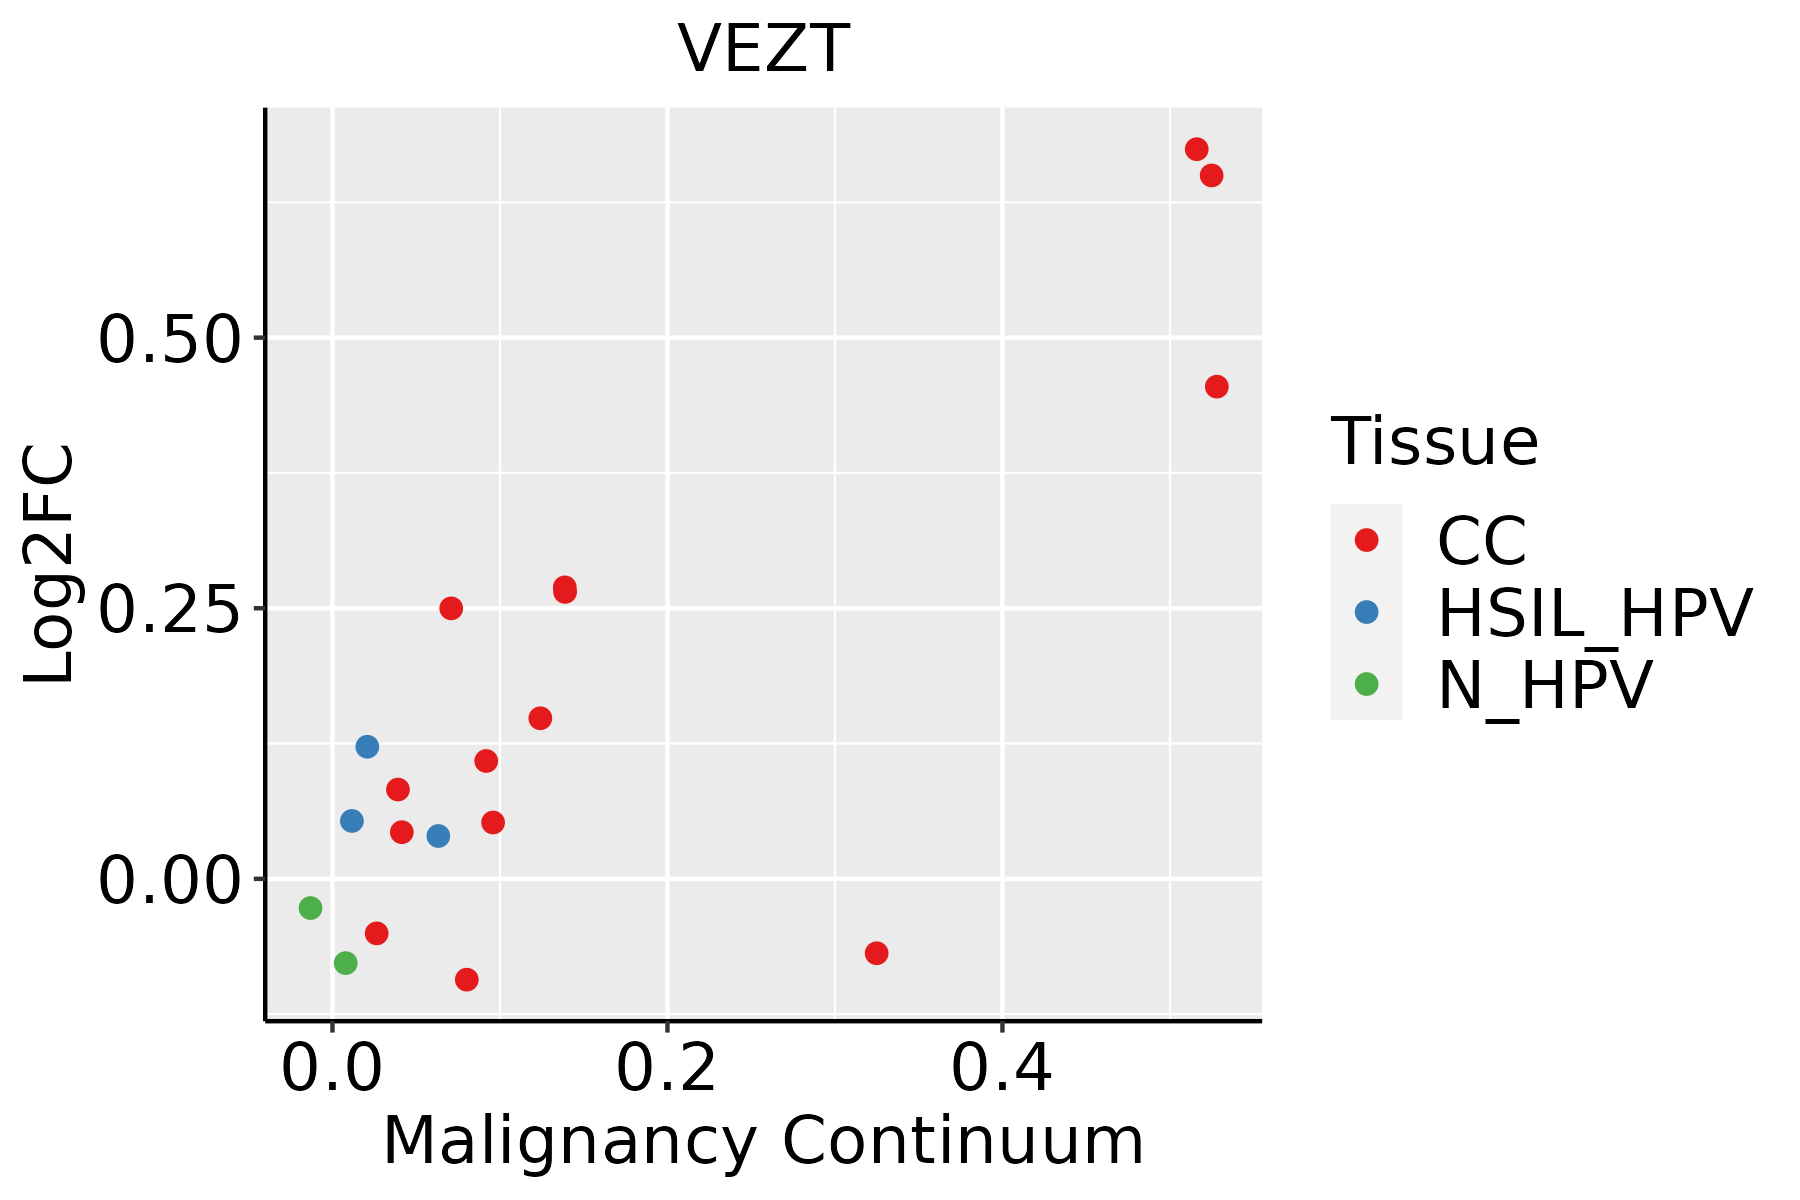 | CC: Cervix cancer |
| HSIL_HPV: HPV-infected high-grade squamous intraepithelial lesions | ||
| N_HPV: HPV-infected normal cervix | ||
| Esophagus | 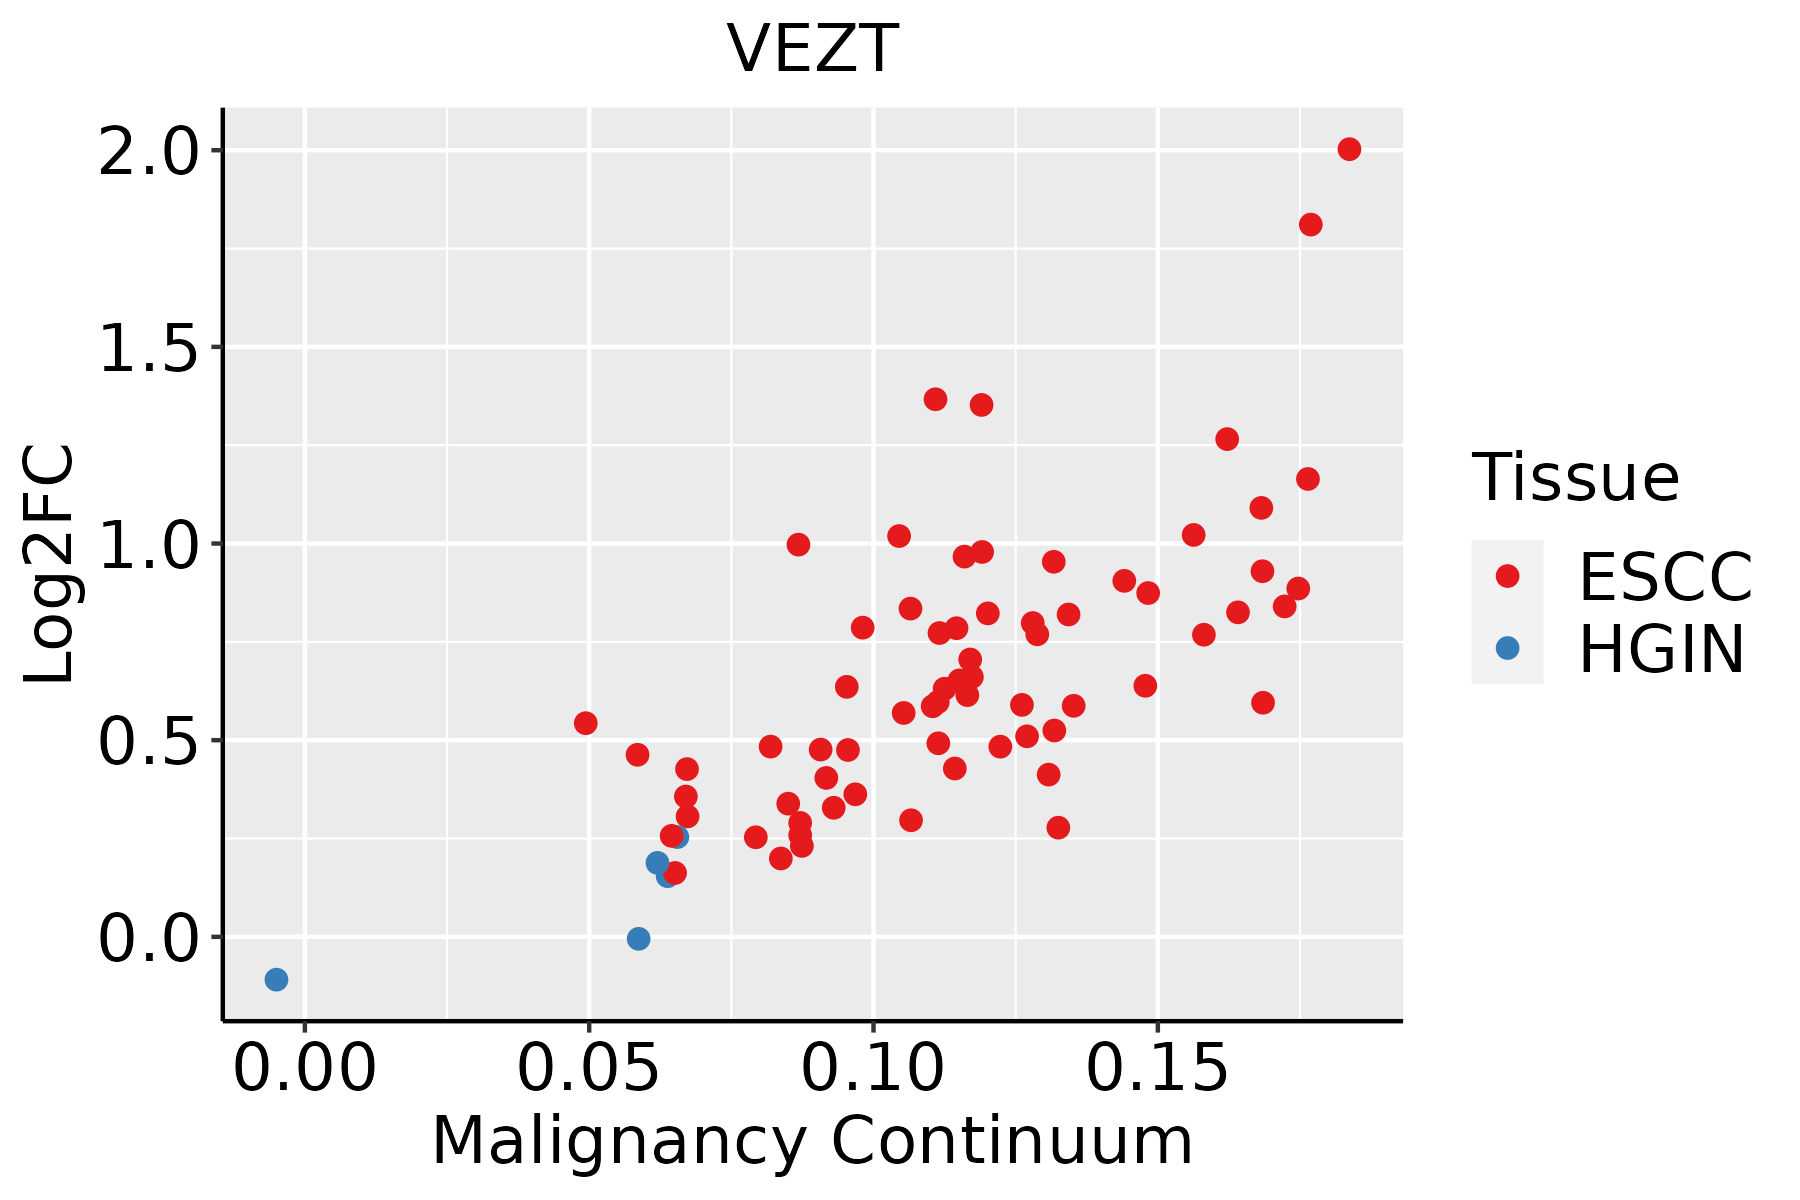 | ESCC: Esophageal squamous cell carcinoma |
| HGIN: High-grade intraepithelial neoplasias | ||
| LGIN: Low-grade intraepithelial neoplasias | ||
| Liver | 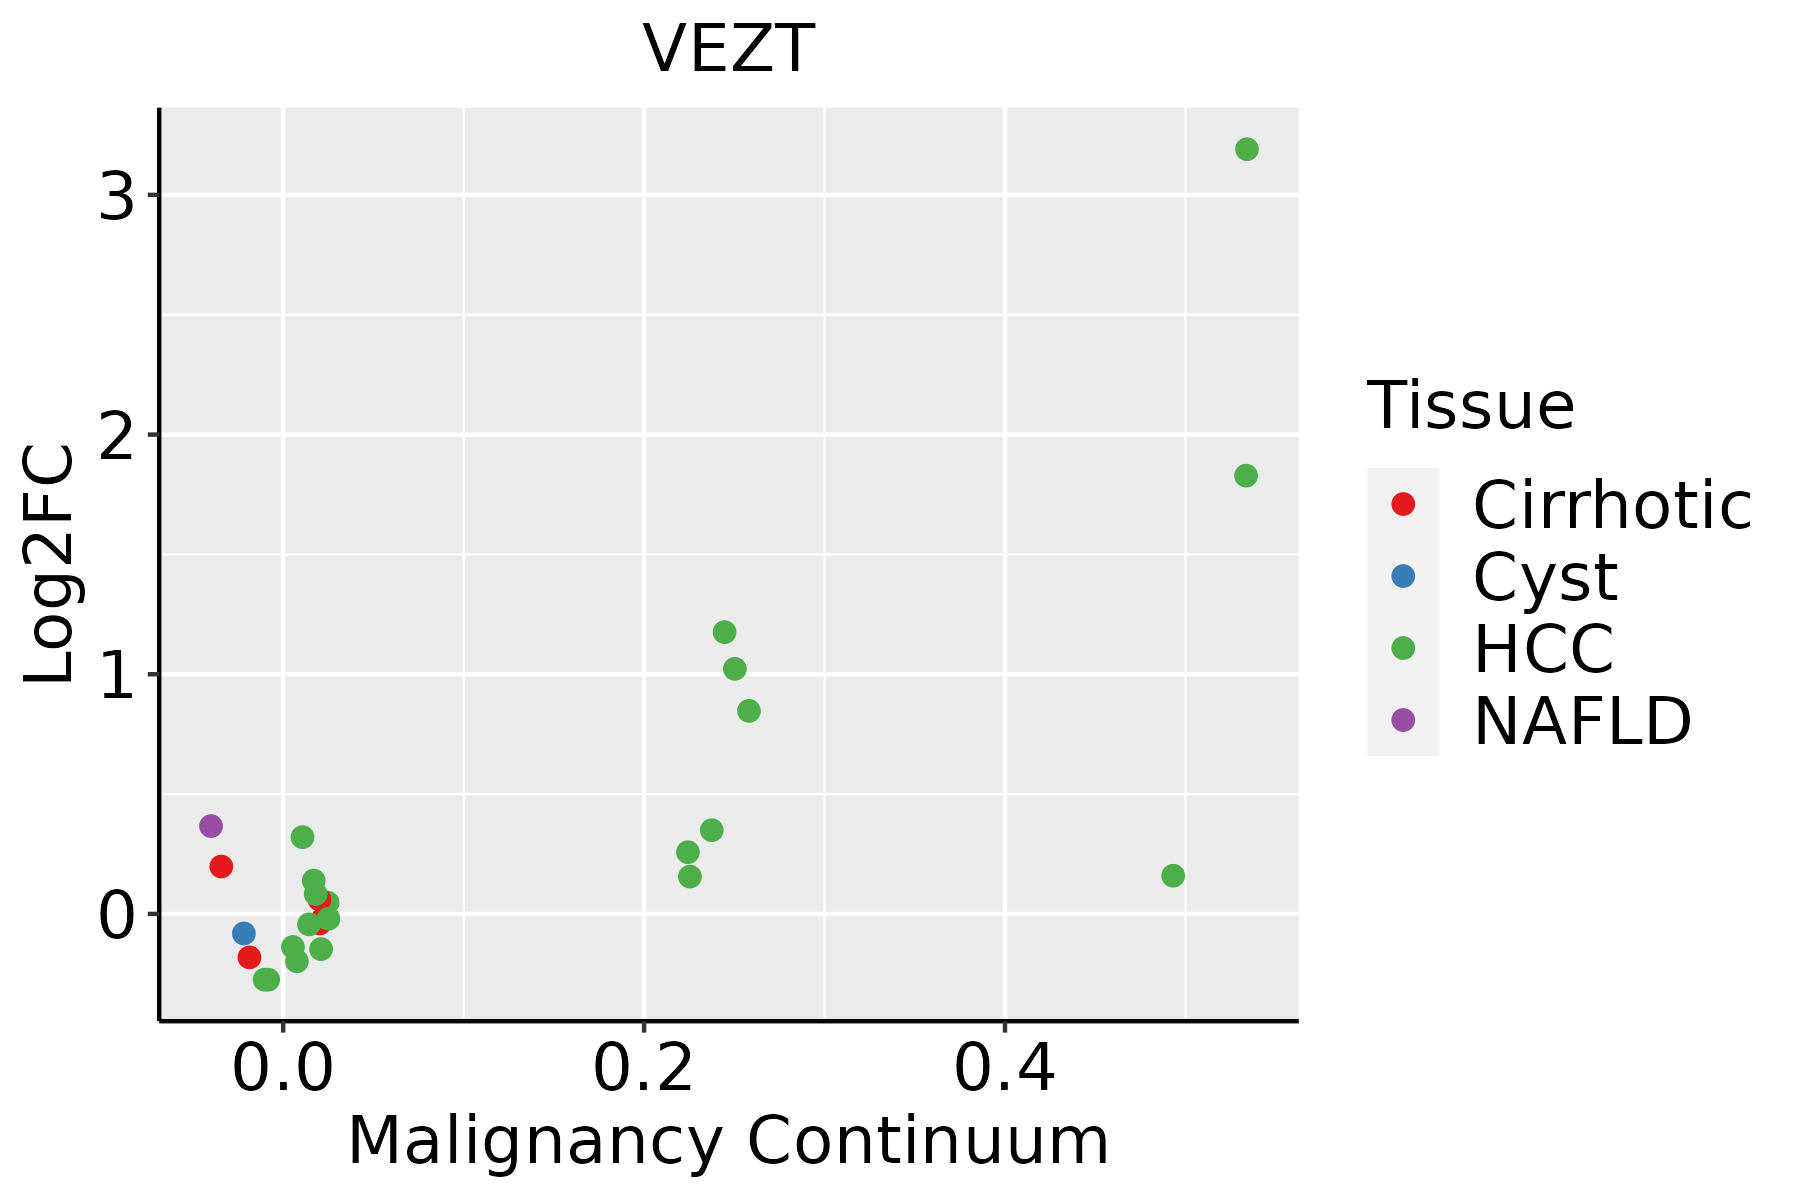 | HCC: Hepatocellular carcinoma |
| NAFLD: Non-alcoholic fatty liver disease | ||
| Lung | 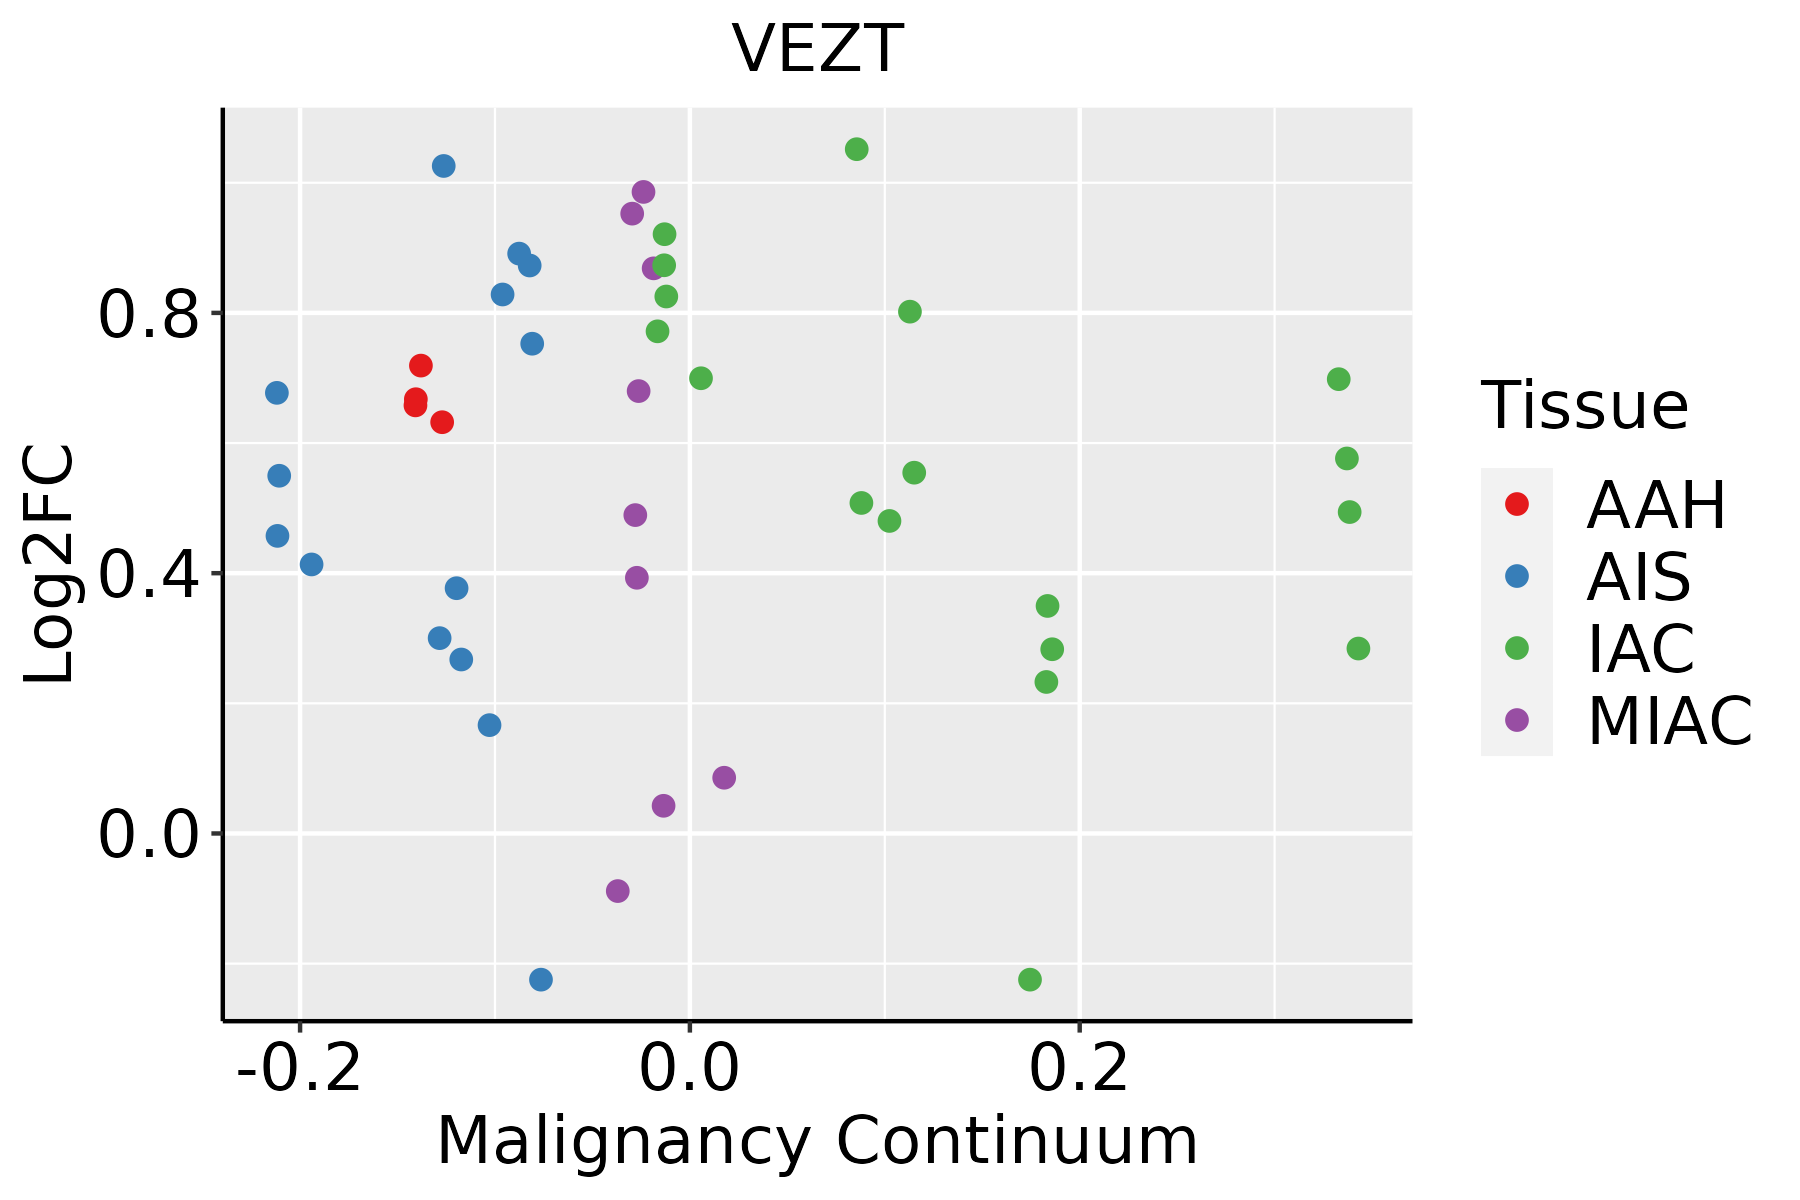 | AAH: Atypical adenomatous hyperplasia |
| AIS: Adenocarcinoma in situ | ||
| IAC: Invasive lung adenocarcinoma | ||
| MIA: Minimally invasive adenocarcinoma | ||
| Oral Cavity |  | EOLP: Erosive Oral lichen planus |
| LP: leukoplakia | ||
| NEOLP: Non-erosive oral lichen planus | ||
| OSCC: Oral squamous cell carcinoma | ||
| Prostate | 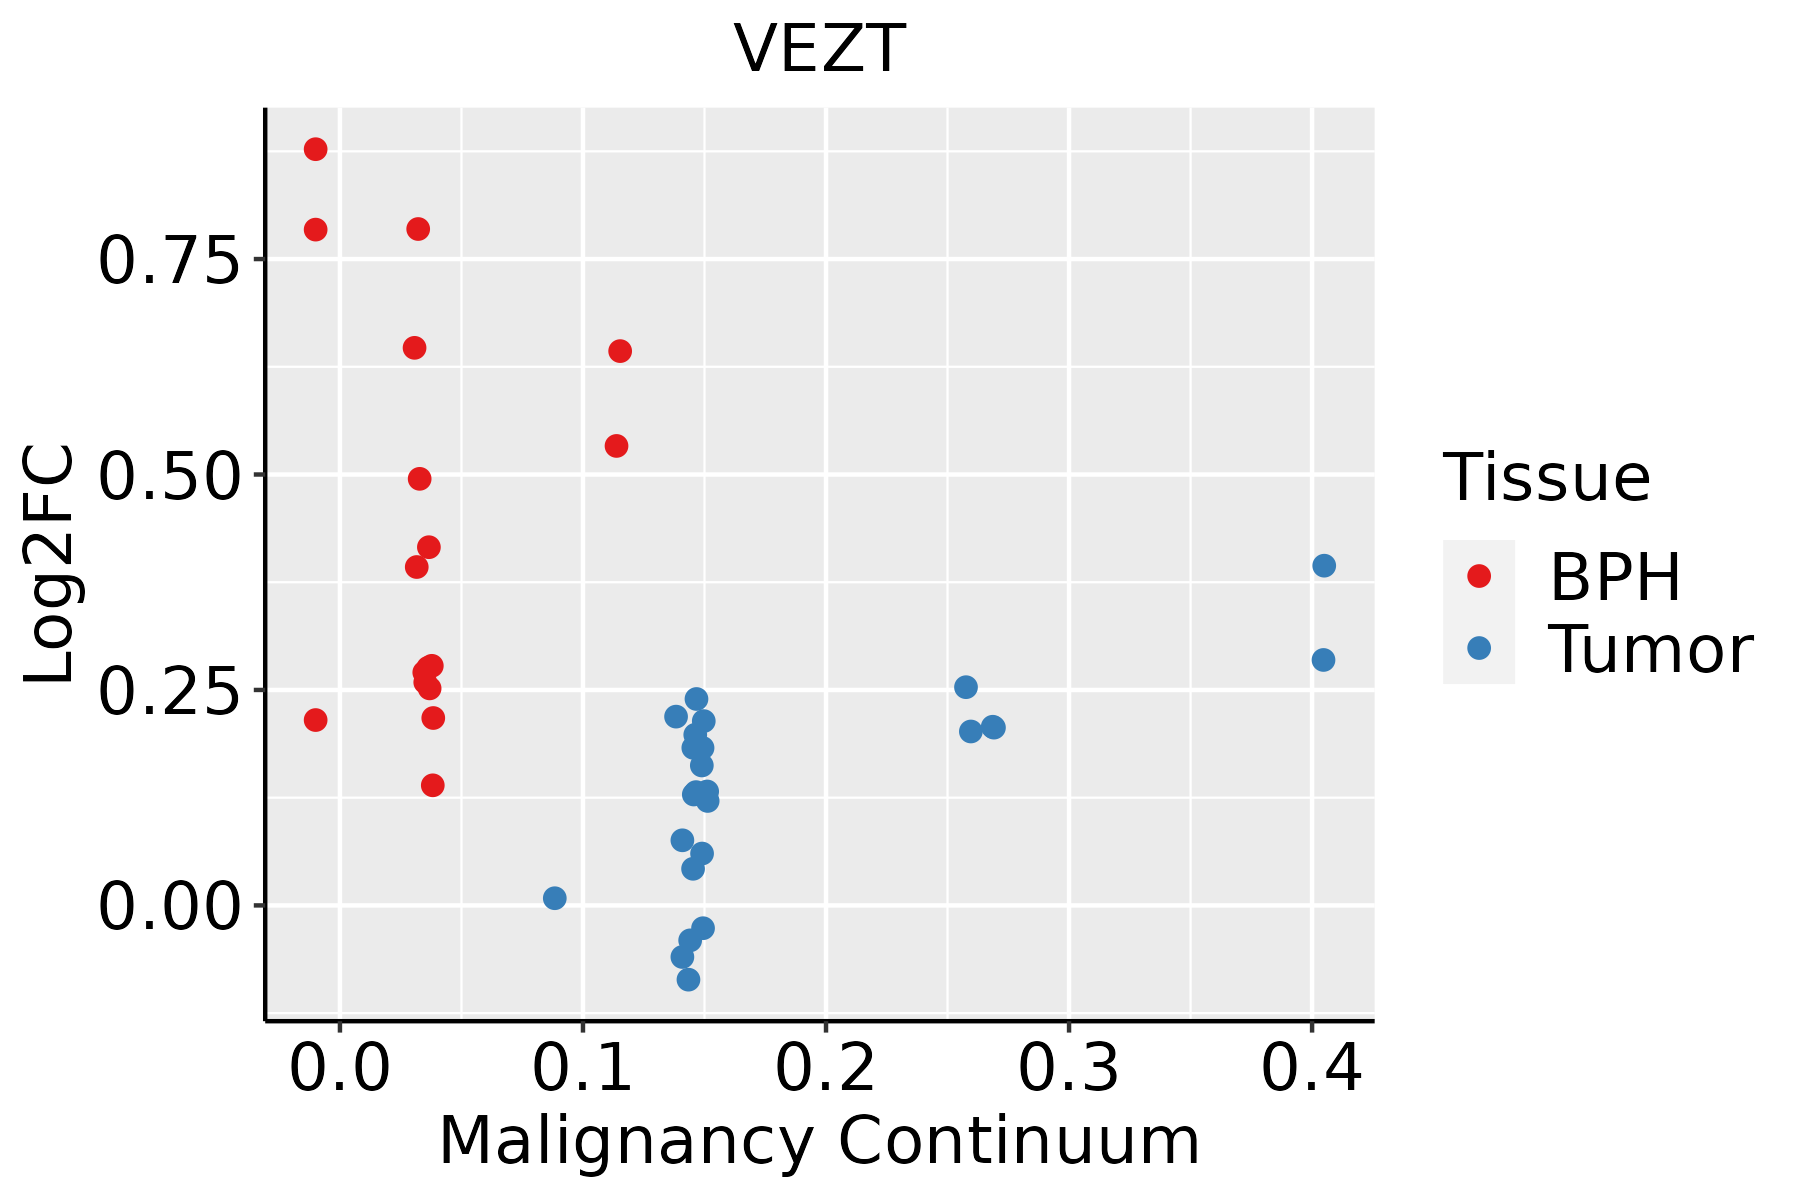 | BPH: Benign Prostatic Hyperplasia |
| Skin | 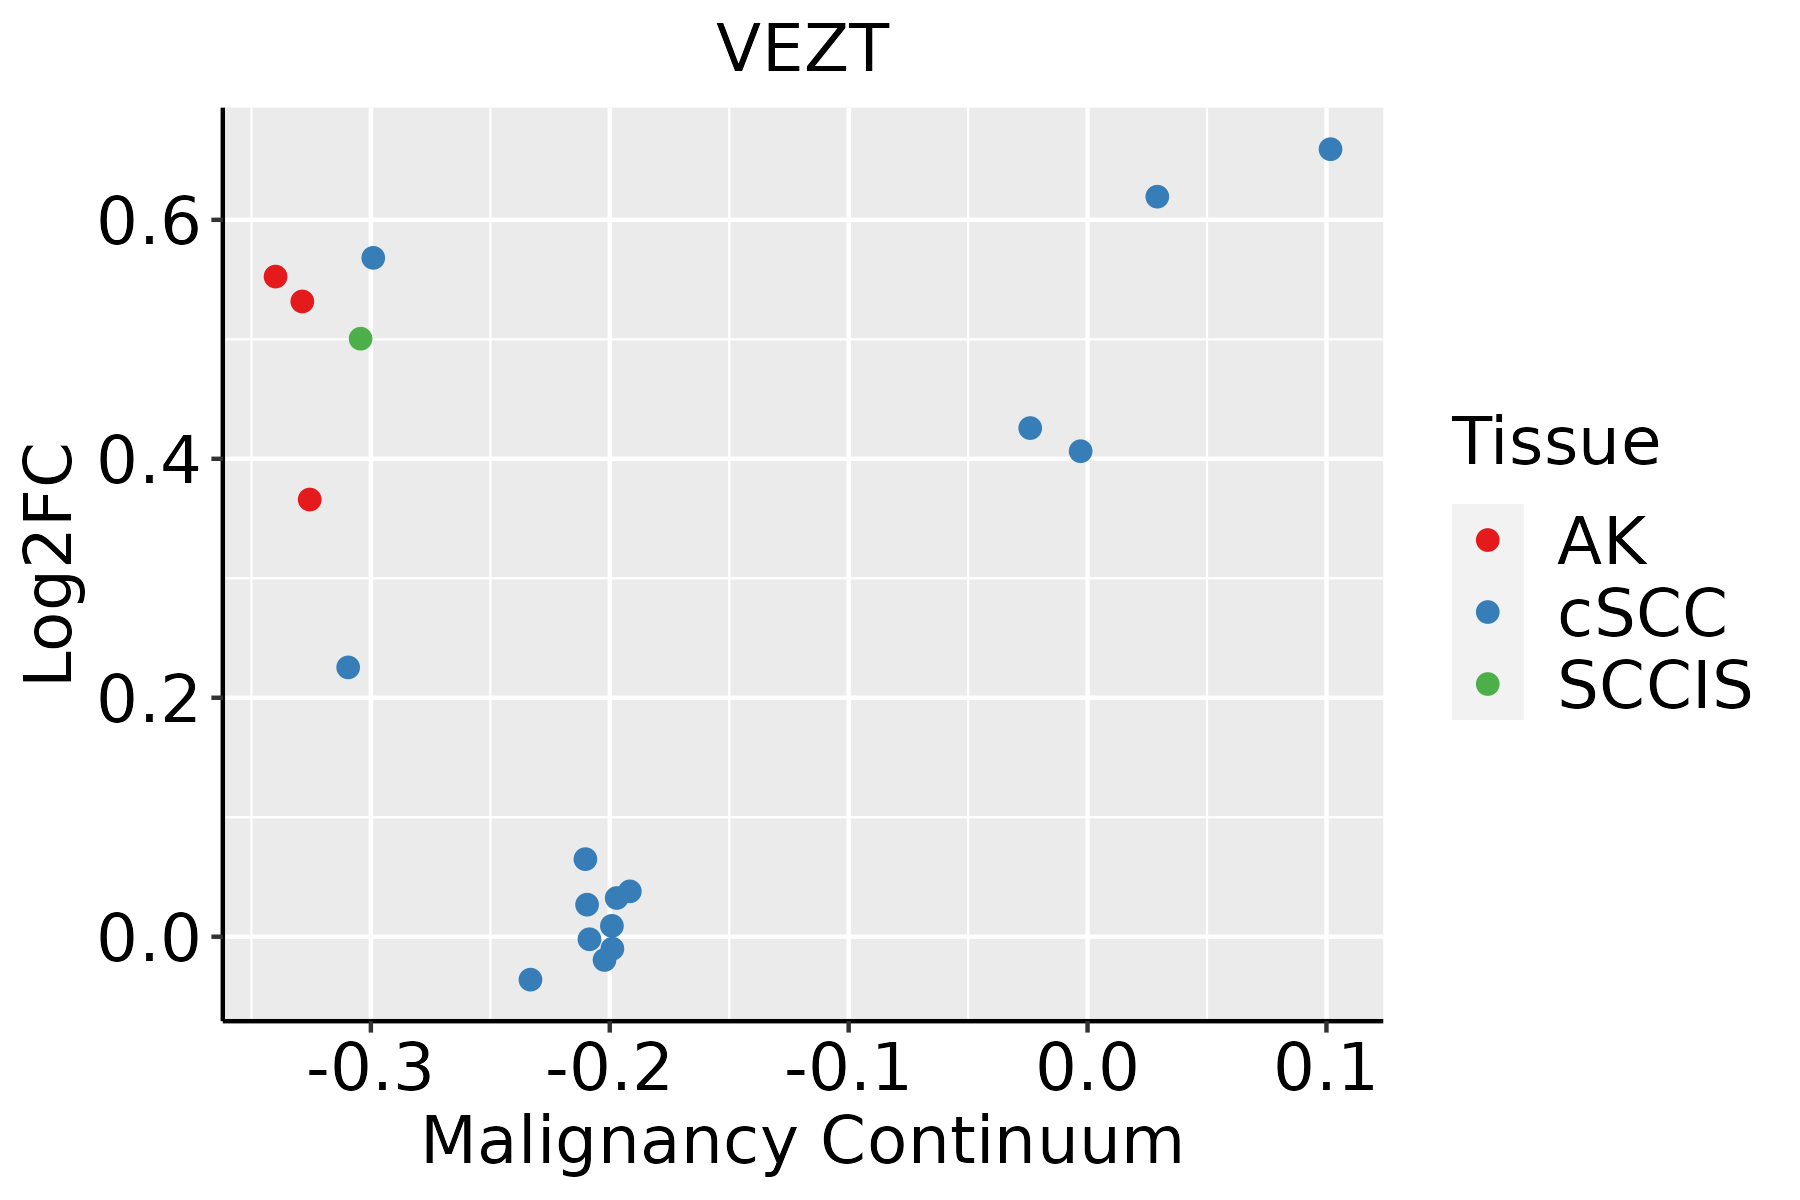 | AK: Actinic keratosis |
| cSCC: Cutaneous squamous cell carcinoma | ||
| SCCIS:squamous cell carcinoma in situ | ||
| Thyroid | 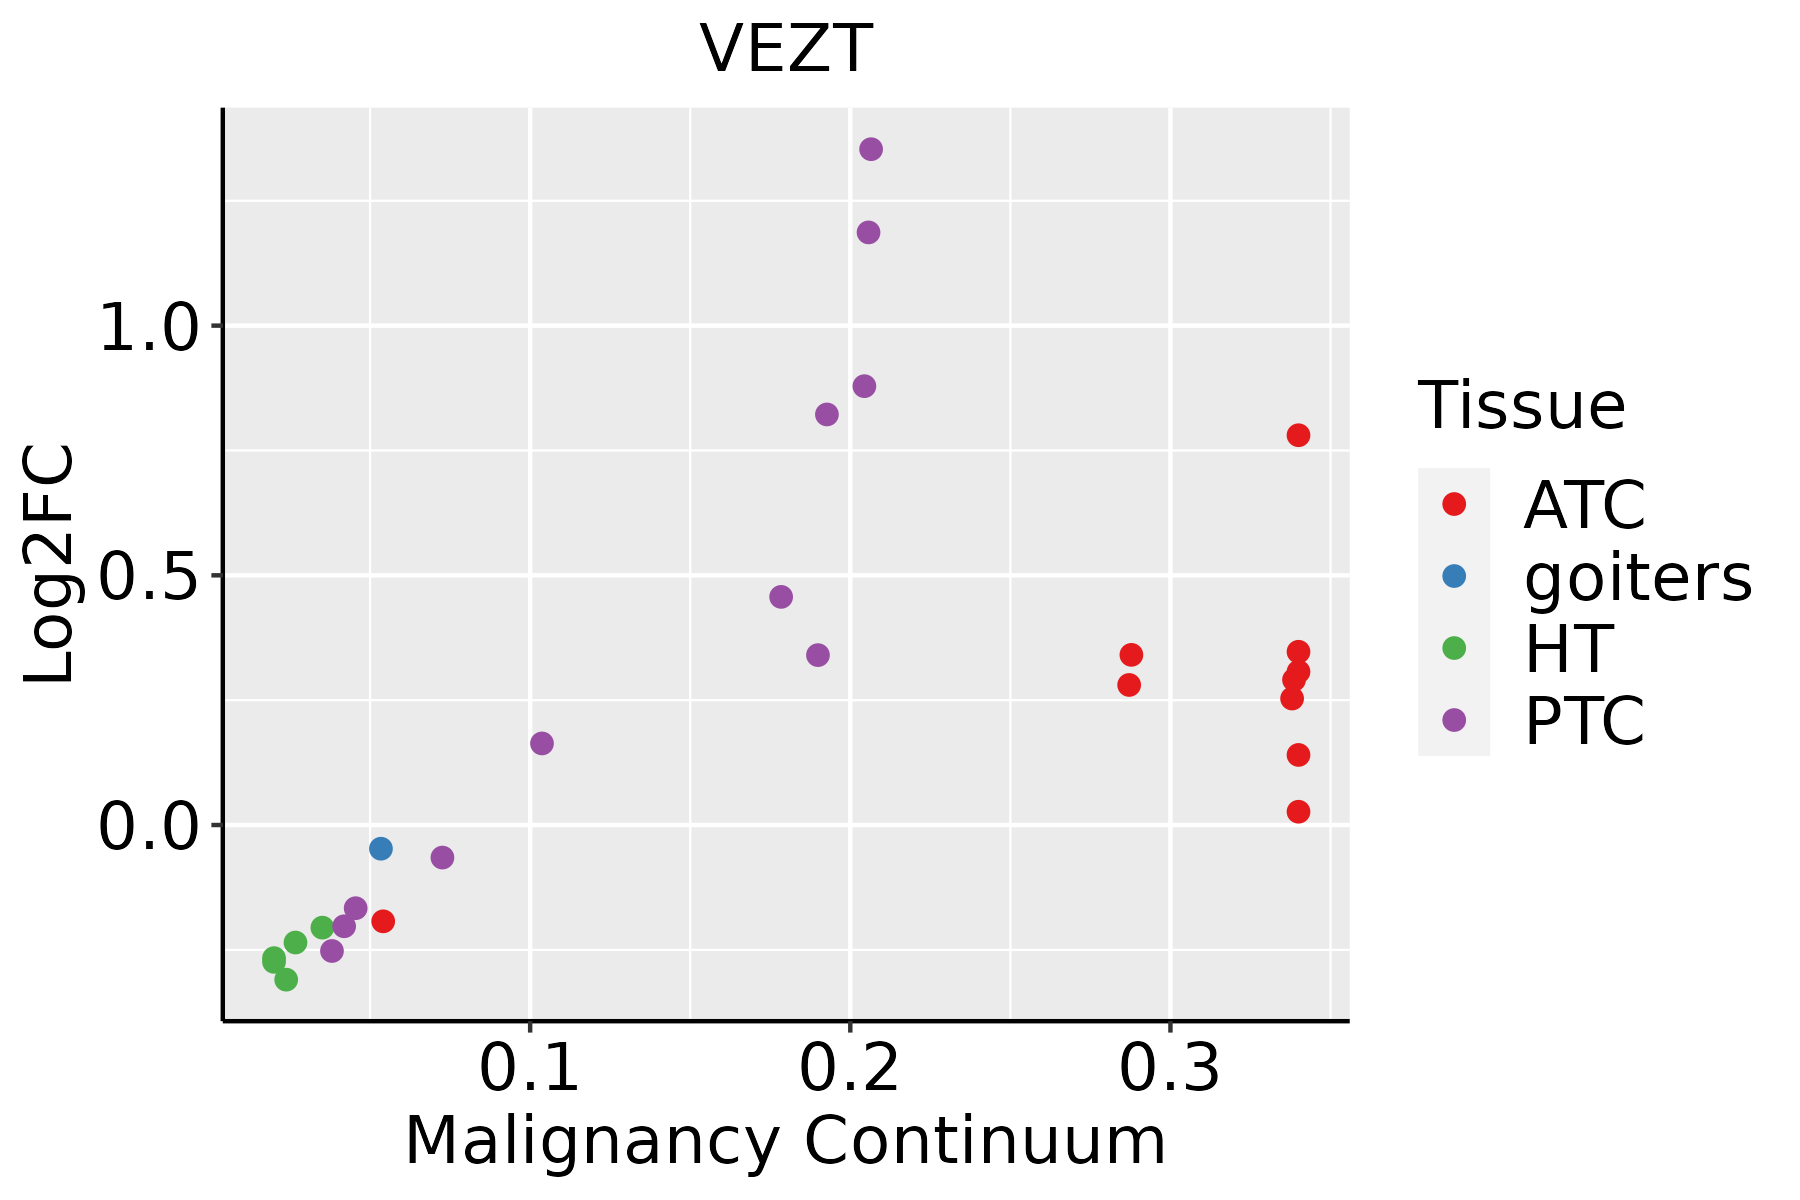 | ATC: Anaplastic thyroid cancer |
| HT: Hashimoto's thyroiditis | ||
| PTC: Papillary thyroid cancer |
| ∗log2FC in expression of this searched gene in stem-like cells from each diseased tissue sample relative to stem-like cells in normal samples in each tissue plotted against the malignancy continuum. Samples are colored based on if they are from different disease stage. |
Top |
Malignant transformation related pathway analysis |
| Find out the enriched GO biological processes and KEGG pathways involved in transition from healthy to precancer to cancer |
| Tissue | Disease Stage | Enriched GO biological Processes |
| Colorectum | AD |  |
| Colorectum | SER |  |
| Colorectum | MSS |  |
| Colorectum | MSI-H |  |
| Colorectum | FAP |  |
| ∗Top 15 enriched GO BP terms are showed in the bar plot of each disease state in each tissue. Each row represents a significant GO biological process which is colored according to the -log10(p.adjust). |
| Page: 1 2 3 4 5 6 7 8 9 |
| GO ID | Tissue | Disease Stage | Description | Gene Ratio | Bg Ratio | pvalue | p.adjust | Count |
| Page: 1 |
| Pathway ID | Tissue | Disease Stage | Description | Gene Ratio | Bg Ratio | pvalue | p.adjust | qvalue | Count |
| Page: 1 |
Top |
Cell-cell communication analysis |
| Identification of potential cell-cell interactions between two cell types and their ligand-receptor pairs for different disease states |
| Ligand | Receptor | LRpair | Pathway | Tissue | Disease Stage |
| Page: 1 |
Top |
Single-cell gene regulatory network inference analysis |
| Find out the significant the regulons (TFs) and the target genes of each regulon across cell types for different disease states |
| TF | Cell Type | Tissue | Disease Stage | Target Gene | RSS | Regulon Activity |
| ∗The dot plots of a searched regulon are shown for all cell subpopulations in each disease state of each tissue based on the regulon specific score inferred using pySCENIC and by calculating the average expression. |
| Page: 1 |
Top |
Somatic mutation of malignant transformation related genes |
| Annotation of somatic variants for genes involved in malignant transformation |
| Hugo Symbol | Variant Class | Variant Classification | dbSNP RS | HGVSc | HGVSp | HGVSp Short | SWISSPROT | BIOTYPE | SIFT | PolyPhen | Tumor Sample Barcode | Tissue | Histology | Sex | Age | Stage | Therapy Types | Drugs | Outcome |
| VEZT | SNV | Missense_Mutation | c.85N>A | p.Glu29Lys | p.E29K | Q9HBM0 | protein_coding | deleterious(0) | probably_damaging(0.978) | TCGA-AC-A23H-01 | Breast | breast invasive carcinoma | Female | >=65 | I/II | Unknown | Unknown | PD | |
| VEZT | SNV | Missense_Mutation | c.1699N>A | p.Glu567Lys | p.E567K | Q9HBM0 | protein_coding | deleterious(0) | probably_damaging(0.913) | TCGA-AC-A23H-01 | Breast | breast invasive carcinoma | Female | >=65 | I/II | Unknown | Unknown | PD | |
| VEZT | SNV | Missense_Mutation | c.1910N>T | p.Gly637Val | p.G637V | Q9HBM0 | protein_coding | tolerated(0.09) | benign(0.368) | TCGA-AC-A23H-01 | Breast | breast invasive carcinoma | Female | >=65 | I/II | Unknown | Unknown | PD | |
| VEZT | SNV | Missense_Mutation | novel | c.512N>G | p.Val171Gly | p.V171G | Q9HBM0 | protein_coding | tolerated(0.16) | benign(0.09) | TCGA-B6-A1KF-01 | Breast | breast invasive carcinoma | Female | >=65 | I/II | Unknown | Unknown | SD |
| VEZT | SNV | Missense_Mutation | c.130N>A | p.Glu44Lys | p.E44K | Q9HBM0 | protein_coding | deleterious(0.03) | benign(0.009) | TCGA-BH-A0HI-01 | Breast | breast invasive carcinoma | Female | >=65 | I/II | Hormone Therapy | arimidex | SD | |
| VEZT | SNV | Missense_Mutation | novel | c.512T>G | p.Val171Gly | p.V171G | Q9HBM0 | protein_coding | tolerated(0.16) | benign(0.09) | TCGA-BH-A1F5-01 | Breast | breast invasive carcinoma | Female | <65 | I/II | Unknown | Unknown | SD |
| VEZT | SNV | Missense_Mutation | c.1786N>C | p.Glu596Gln | p.E596Q | Q9HBM0 | protein_coding | deleterious(0) | possibly_damaging(0.638) | TCGA-D8-A27G-01 | Breast | breast invasive carcinoma | Female | >=65 | I/II | Unknown | Unknown | SD | |
| VEZT | insertion | Frame_Shift_Ins | novel | c.581_582insC | p.Gln194HisfsTer23 | p.Q194Hfs*23 | Q9HBM0 | protein_coding | TCGA-AN-A03X-01 | Breast | breast invasive carcinoma | Female | >=65 | I/II | Unknown | Unknown | SD | ||
| VEZT | insertion | Nonsense_Mutation | novel | c.582_583insTAATGGAGAGGAGGATGATAAGGTACATCACAGG | p.Val195Ter | p.V195* | Q9HBM0 | protein_coding | TCGA-AN-A03X-01 | Breast | breast invasive carcinoma | Female | >=65 | I/II | Unknown | Unknown | SD | ||
| VEZT | insertion | Nonsense_Mutation | novel | c.704_705insAGAGAAAGAAAGATGAATTACTTTAA | p.Phe235LeufsTer6 | p.F235Lfs*6 | Q9HBM0 | protein_coding | TCGA-AR-A0U0-01 | Breast | breast invasive carcinoma | Female | >=65 | I/II | Unknown | Unknown | SD |
| Page: 1 2 3 4 5 6 7 |
Top |
Related drugs of malignant transformation related genes |
| Identification of chemicals and drugs interact with genes involved in malignant transfromation |
| (DGIdb 4.0) |
| Entrez ID | Symbol | Category | Interaction Types | Drug Claim Name | Drug Name | PMIDs |
| Page: 1 |

Copyright 2023-Present -The University of Texas Health Science Center at Houston |