
|
|||||
|
 | |
| |
| |
| |
| |
| |
|
Gene: VEZF1 |
Gene summary for VEZF1 |
| Gene information | Species | Human | Gene symbol | VEZF1 | Gene ID | 7716 |
| Gene name | vascular endothelial zinc finger 1 | |
| Gene Alias | DB1 | |
| Cytomap | 17q22 | |
| Gene Type | protein-coding | GO ID | GO:0001525 | UniProtAcc | J3QSH4 |
Top |
Malignant transformation analysis |
| Identification of the aberrant gene expression in precancerous and cancerous lesions by comparing the gene expression of stem-like cells in diseased tissues with normal stem cells |
| Entrez ID | Symbol | Replicates | Species | Organ | Tissue | Adj P-value | Log2FC | Malignancy |
| 7716 | VEZF1 | LZE4T | Human | Esophagus | ESCC | 2.19e-19 | 5.27e-01 | 0.0811 |
| 7716 | VEZF1 | LZE5T | Human | Esophagus | ESCC | 1.44e-03 | 4.01e-01 | 0.0514 |
| 7716 | VEZF1 | LZE7T | Human | Esophagus | ESCC | 5.21e-06 | 5.38e-01 | 0.0667 |
| 7716 | VEZF1 | LZE8T | Human | Esophagus | ESCC | 5.52e-13 | 3.19e-01 | 0.067 |
| 7716 | VEZF1 | LZE20T | Human | Esophagus | ESCC | 1.13e-02 | 3.60e-02 | 0.0662 |
| 7716 | VEZF1 | LZE22T | Human | Esophagus | ESCC | 1.52e-04 | 3.53e-01 | 0.068 |
| 7716 | VEZF1 | LZE24T | Human | Esophagus | ESCC | 1.69e-24 | 7.70e-01 | 0.0596 |
| 7716 | VEZF1 | LZE21T | Human | Esophagus | ESCC | 2.79e-04 | 3.48e-01 | 0.0655 |
| 7716 | VEZF1 | LZE6T | Human | Esophagus | ESCC | 5.76e-05 | 2.21e-01 | 0.0845 |
| 7716 | VEZF1 | P1T-E | Human | Esophagus | ESCC | 1.42e-10 | 4.95e-01 | 0.0875 |
| 7716 | VEZF1 | P2T-E | Human | Esophagus | ESCC | 5.16e-48 | 1.06e+00 | 0.1177 |
| 7716 | VEZF1 | P4T-E | Human | Esophagus | ESCC | 1.42e-21 | 4.83e-01 | 0.1323 |
| 7716 | VEZF1 | P5T-E | Human | Esophagus | ESCC | 9.21e-11 | 9.99e-02 | 0.1327 |
| 7716 | VEZF1 | P8T-E | Human | Esophagus | ESCC | 4.01e-32 | 7.37e-01 | 0.0889 |
| 7716 | VEZF1 | P9T-E | Human | Esophagus | ESCC | 3.14e-13 | 3.76e-01 | 0.1131 |
| 7716 | VEZF1 | P10T-E | Human | Esophagus | ESCC | 1.79e-32 | 7.91e-01 | 0.116 |
| 7716 | VEZF1 | P11T-E | Human | Esophagus | ESCC | 6.53e-26 | 9.22e-01 | 0.1426 |
| 7716 | VEZF1 | P12T-E | Human | Esophagus | ESCC | 6.66e-38 | 9.48e-01 | 0.1122 |
| 7716 | VEZF1 | P15T-E | Human | Esophagus | ESCC | 4.07e-35 | 9.14e-01 | 0.1149 |
| 7716 | VEZF1 | P16T-E | Human | Esophagus | ESCC | 1.22e-28 | 8.01e-01 | 0.1153 |
| Page: 1 2 3 4 5 6 7 |
| Tissue | Expression Dynamics | Abbreviation |
| Esophagus |  | ESCC: Esophageal squamous cell carcinoma |
| HGIN: High-grade intraepithelial neoplasias | ||
| LGIN: Low-grade intraepithelial neoplasias | ||
| Liver |  | HCC: Hepatocellular carcinoma |
| NAFLD: Non-alcoholic fatty liver disease | ||
| Oral Cavity | 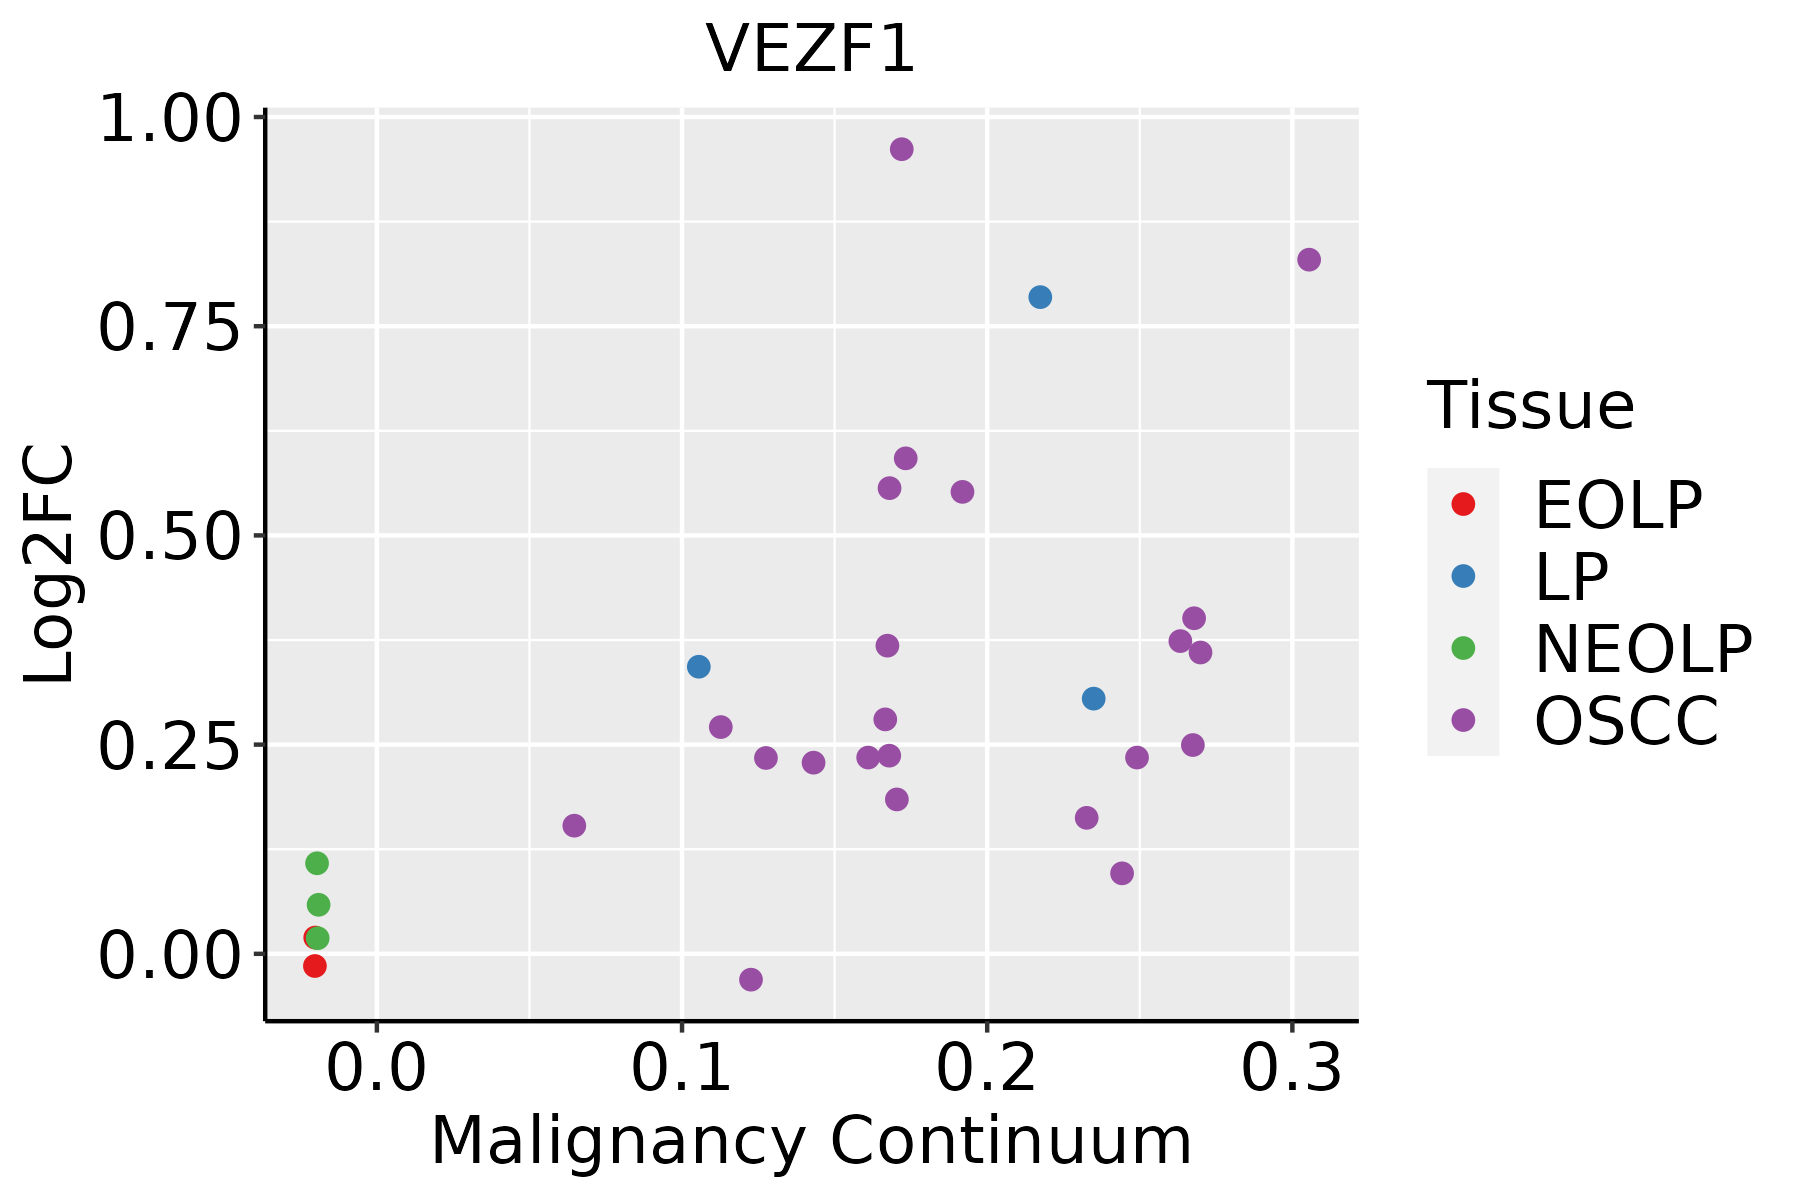 | EOLP: Erosive Oral lichen planus |
| LP: leukoplakia | ||
| NEOLP: Non-erosive oral lichen planus | ||
| OSCC: Oral squamous cell carcinoma | ||
| Prostate | 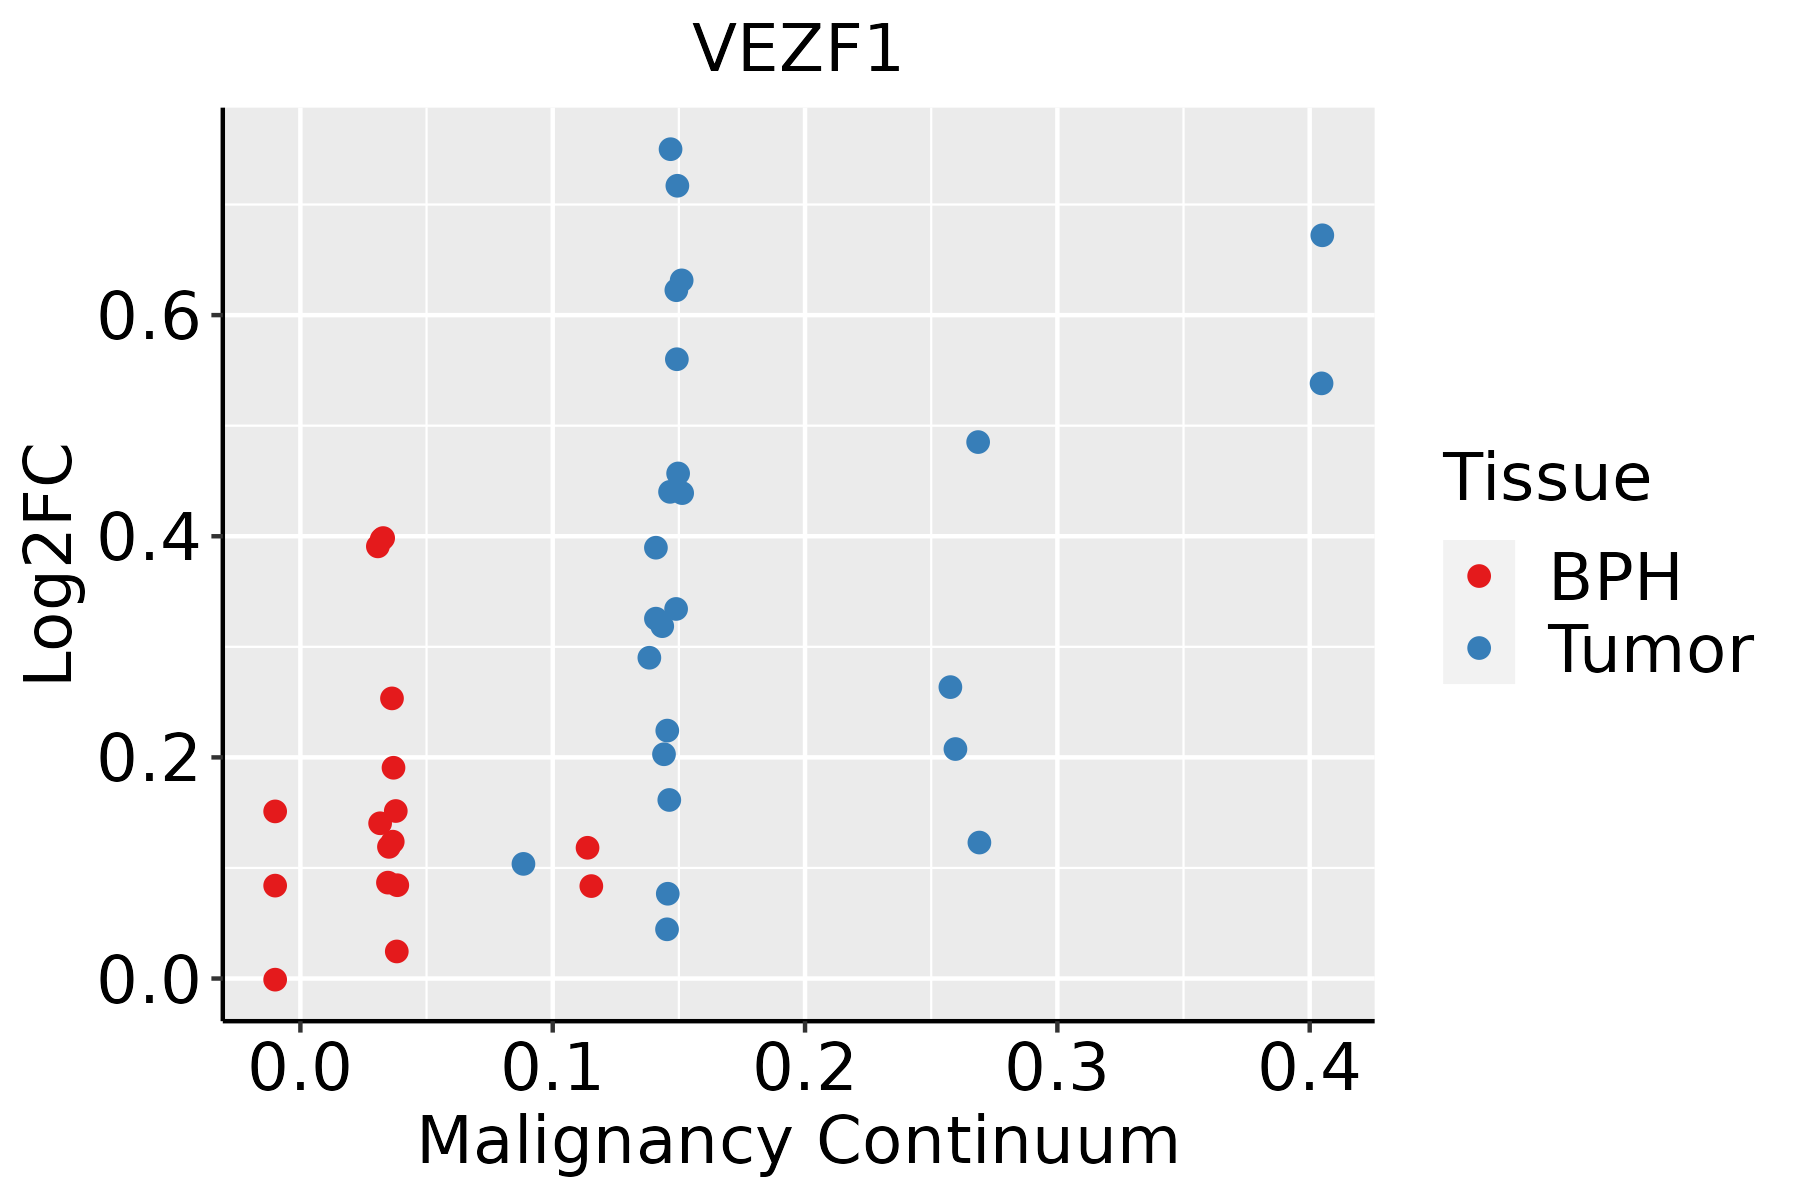 | BPH: Benign Prostatic Hyperplasia |
| Skin |  | AK: Actinic keratosis |
| cSCC: Cutaneous squamous cell carcinoma | ||
| SCCIS:squamous cell carcinoma in situ | ||
| Thyroid | 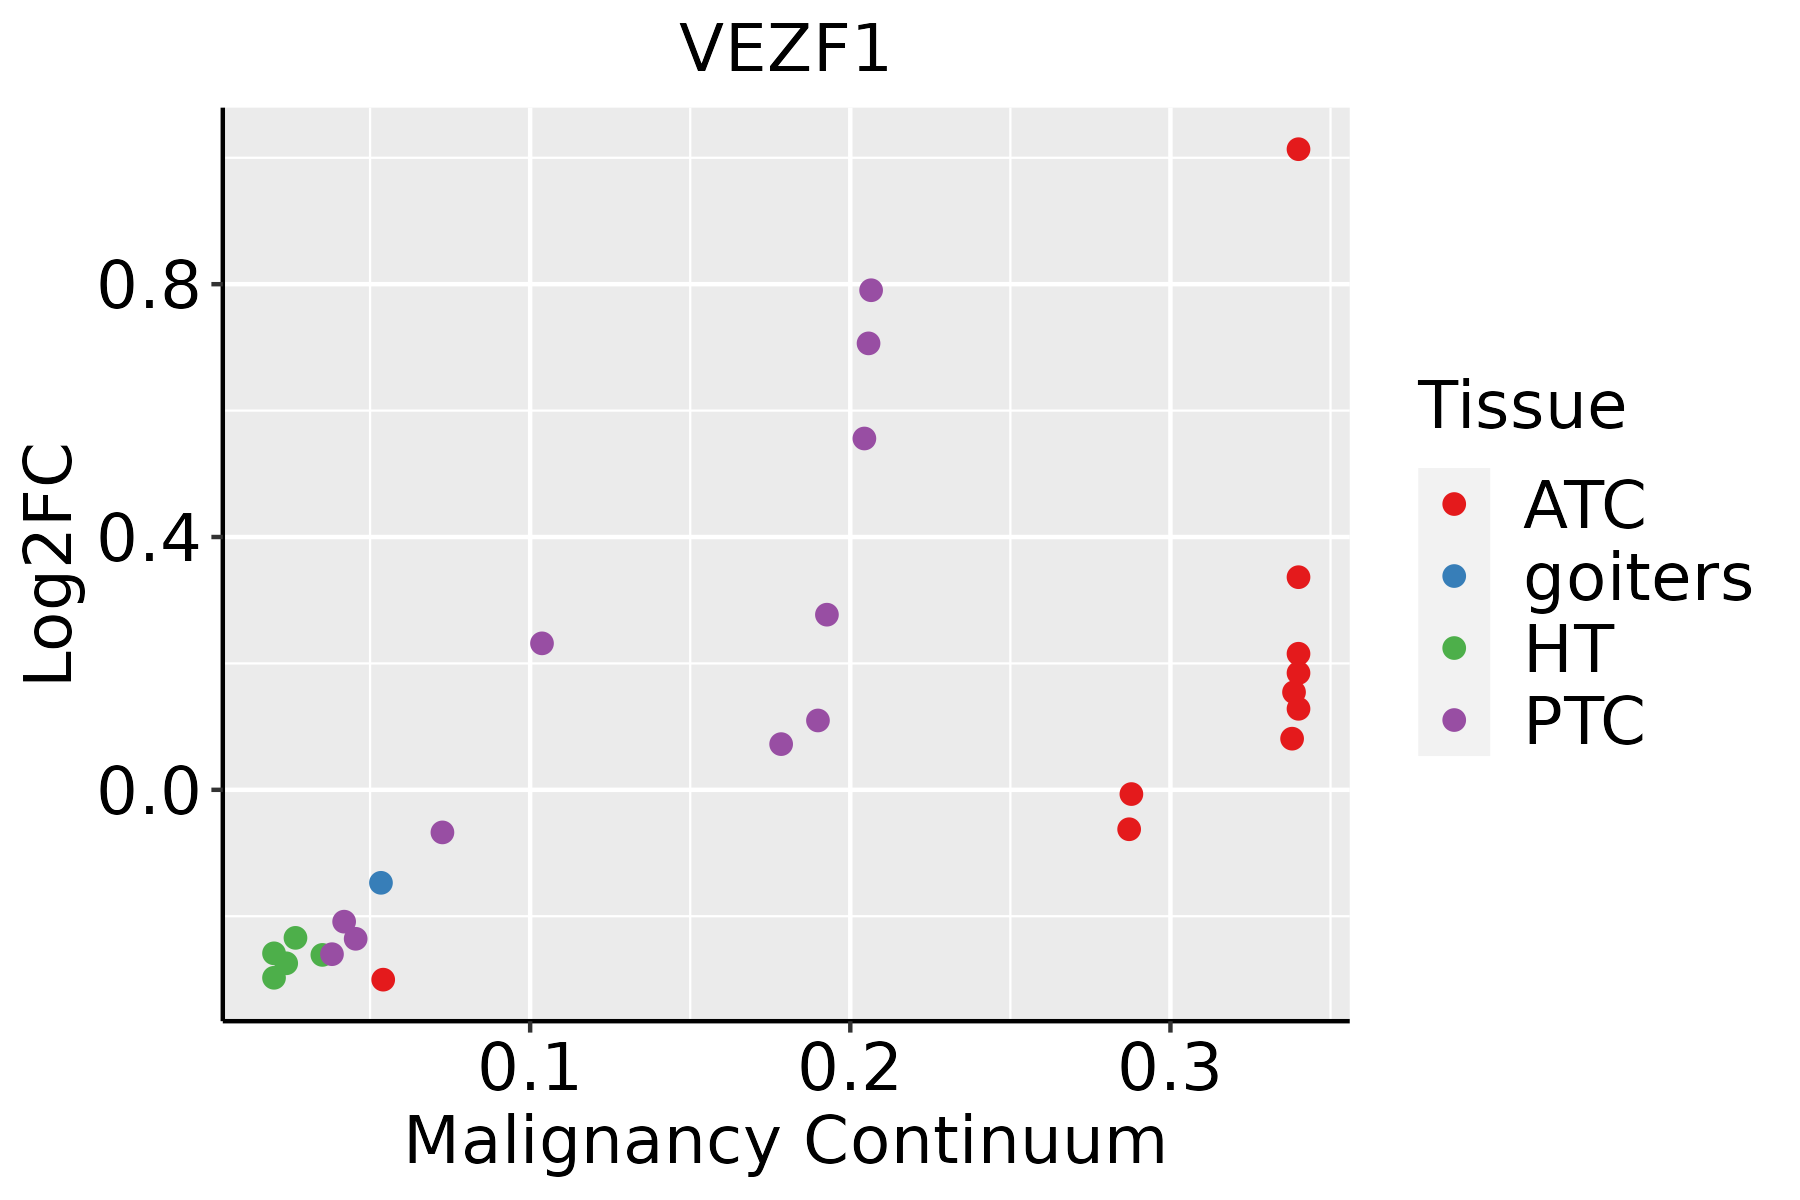 | ATC: Anaplastic thyroid cancer |
| HT: Hashimoto's thyroiditis | ||
| PTC: Papillary thyroid cancer |
| ∗log2FC in expression of this searched gene in stem-like cells from each diseased tissue sample relative to stem-like cells in normal samples in each tissue plotted against the malignancy continuum. Samples are colored based on if they are from different disease stage. |
Top |
Malignant transformation related pathway analysis |
| Find out the enriched GO biological processes and KEGG pathways involved in transition from healthy to precancer to cancer |
| Tissue | Disease Stage | Enriched GO biological Processes |
| Colorectum | AD |  |
| Colorectum | SER |  |
| Colorectum | MSS |  |
| Colorectum | MSI-H |  |
| Colorectum | FAP |  |
| ∗Top 15 enriched GO BP terms are showed in the bar plot of each disease state in each tissue. Each row represents a significant GO biological process which is colored according to the -log10(p.adjust). |
| Page: 1 2 3 4 5 6 7 8 9 |
| GO ID | Tissue | Disease Stage | Description | Gene Ratio | Bg Ratio | pvalue | p.adjust | Count |
| GO:000206420 | Esophagus | ESCC | epithelial cell development | 136/8552 | 220/18723 | 9.50e-07 | 1.21e-05 | 136 |
| GO:000188510 | Esophagus | ESCC | endothelial cell development | 44/8552 | 64/18723 | 1.59e-04 | 1.05e-03 | 44 |
| GO:004544610 | Esophagus | ESCC | endothelial cell differentiation | 67/8552 | 118/18723 | 9.86e-03 | 3.40e-02 | 67 |
| GO:000315818 | Esophagus | ESCC | endothelium development | 76/8552 | 136/18723 | 1.05e-02 | 3.59e-02 | 76 |
| GO:000206412 | Liver | Cirrhotic | epithelial cell development | 80/4634 | 220/18723 | 7.63e-05 | 8.44e-04 | 80 |
| GO:00018855 | Liver | Cirrhotic | endothelial cell development | 27/4634 | 64/18723 | 1.63e-03 | 1.05e-02 | 27 |
| GO:00031586 | Liver | Cirrhotic | endothelium development | 49/4634 | 136/18723 | 2.14e-03 | 1.32e-02 | 49 |
| GO:00454465 | Liver | Cirrhotic | endothelial cell differentiation | 43/4634 | 118/18723 | 3.03e-03 | 1.72e-02 | 43 |
| GO:000206422 | Liver | HCC | epithelial cell development | 114/7958 | 220/18723 | 3.19e-03 | 1.47e-02 | 114 |
| GO:000188512 | Liver | HCC | endothelial cell development | 37/7958 | 64/18723 | 9.63e-03 | 3.63e-02 | 37 |
| GO:000206419 | Oral cavity | OSCC | epithelial cell development | 116/7305 | 220/18723 | 2.34e-05 | 2.21e-04 | 116 |
| GO:00018859 | Oral cavity | OSCC | endothelial cell development | 40/7305 | 64/18723 | 1.20e-04 | 8.57e-04 | 40 |
| GO:000315816 | Oral cavity | OSCC | endothelium development | 71/7305 | 136/18723 | 1.18e-03 | 5.99e-03 | 71 |
| GO:00454469 | Oral cavity | OSCC | endothelial cell differentiation | 61/7305 | 118/18723 | 3.40e-03 | 1.44e-02 | 61 |
| GO:000206417 | Prostate | BPH | epithelial cell development | 85/3107 | 220/18723 | 3.16e-15 | 4.55e-13 | 85 |
| GO:000315814 | Prostate | BPH | endothelium development | 49/3107 | 136/18723 | 3.17e-08 | 9.07e-07 | 49 |
| GO:00454468 | Prostate | BPH | endothelial cell differentiation | 43/3107 | 118/18723 | 1.49e-07 | 3.46e-06 | 43 |
| GO:00018858 | Prostate | BPH | endothelial cell development | 28/3107 | 64/18723 | 2.93e-07 | 6.23e-06 | 28 |
| GO:00308565 | Prostate | BPH | regulation of epithelial cell differentiation | 49/3107 | 154/18723 | 2.28e-06 | 3.74e-05 | 49 |
| GO:000206418 | Prostate | Tumor | epithelial cell development | 88/3246 | 220/18723 | 1.30e-15 | 2.38e-13 | 88 |
| Page: 1 2 |
| Pathway ID | Tissue | Disease Stage | Description | Gene Ratio | Bg Ratio | pvalue | p.adjust | qvalue | Count |
| Page: 1 |
Top |
Cell-cell communication analysis |
| Identification of potential cell-cell interactions between two cell types and their ligand-receptor pairs for different disease states |
| Ligand | Receptor | LRpair | Pathway | Tissue | Disease Stage |
| Page: 1 |
Top |
Single-cell gene regulatory network inference analysis |
| Find out the significant the regulons (TFs) and the target genes of each regulon across cell types for different disease states |
| TF | Cell Type | Tissue | Disease Stage | Target Gene | RSS | Regulon Activity |
| VEZF1 | pDC | Breast | DCIS | TP53I3,TNRC18,LRRC8A, etc. | 3.14e-02 |  |
| VEZF1 | M2MAC | Breast | IDC | TP53I3,TNRC18,LRRC8A, etc. | 3.21e-02 |  |
| VEZF1 | MYOFIB | Colorectum | CRC | KIF3C,POC1A,ARAP2, etc. | 3.39e-02 |  |
| VEZF1 | GLIA | Colorectum | CRC | KIF3C,POC1A,ARAP2, etc. | 2.06e-02 | |
| VEZF1 | LYMEND | Colorectum | MSS | KIF3C,POC1A,ARAP2, etc. | 5.23e-02 |  |
| VEZF1 | ABP | Lung | Healthy | ADGRF5,ITGB6,FABP5, etc. | 4.58e-02 |  |
| VEZF1 | STM | Oral cavity | LP | CUEDC1,NNT-AS1,ANKRD10, etc. | 5.14e-01 |  |
| VEZF1 | INMON | Skin | ADJ | CCL3L1,IQCG,NRG1, etc. | 2.48e-01 |  |
| VEZF1 | INMON | Skin | Healthy | CCL3L1,IQCG,NRG1, etc. | 2.51e-02 |  |
| VEZF1 | BMEM | Stomach | Healthy | CRCP,GNLY,SNORA76, etc. | 5.08e-03 |  |
| ∗The dot plots of a searched regulon are shown for all cell subpopulations in each disease state of each tissue based on the regulon specific score inferred using pySCENIC and by calculating the average expression. |
| Page: 1 |
Top |
Somatic mutation of malignant transformation related genes |
| Annotation of somatic variants for genes involved in malignant transformation |
| Hugo Symbol | Variant Class | Variant Classification | dbSNP RS | HGVSc | HGVSp | HGVSp Short | SWISSPROT | BIOTYPE | SIFT | PolyPhen | Tumor Sample Barcode | Tissue | Histology | Sex | Age | Stage | Therapy Types | Drugs | Outcome |
| VEZF1 | SNV | Missense_Mutation | c.500N>C | p.Ser167Thr | p.S167T | Q14119 | protein_coding | tolerated(0.4) | benign(0.34) | TCGA-BH-A0HB-01 | Breast | breast invasive carcinoma | Female | <65 | I/II | Chemotherapy | docetaxel | SD | |
| VEZF1 | SNV | Missense_Mutation | c.249N>A | p.Phe83Leu | p.F83L | Q14119 | protein_coding | deleterious(0) | probably_damaging(0.966) | TCGA-C8-A1HM-01 | Breast | breast invasive carcinoma | Female | >=65 | I/II | Chemotherapy | doxorubicin | CR | |
| VEZF1 | insertion | Nonsense_Mutation | novel | c.1281_1282insACTGTTCTTATCCACAGTACAAAAATGGTTTGTTTTTAAT | p.Val428ThrfsTer13 | p.V428Tfs*13 | Q14119 | protein_coding | TCGA-BH-A0HF-01 | Breast | breast invasive carcinoma | Female | >=65 | I/II | Hormone Therapy | arimidex | SD | ||
| VEZF1 | SNV | Missense_Mutation | c.1463N>A | p.Leu488Gln | p.L488Q | Q14119 | protein_coding | deleterious_low_confidence(0) | probably_damaging(0.979) | TCGA-AD-6895-01 | Colorectum | colon adenocarcinoma | Male | >=65 | III/IV | Unknown | Unknown | SD | |
| VEZF1 | SNV | Missense_Mutation | novel | c.208N>A | p.Pro70Thr | p.P70T | Q14119 | protein_coding | tolerated(0.14) | benign(0.276) | TCGA-CA-6717-01 | Colorectum | colon adenocarcinoma | Male | <65 | I/II | Chemotherapy | oxaliplatin | CR |
| VEZF1 | SNV | Missense_Mutation | c.772G>A | p.Glu258Lys | p.E258K | Q14119 | protein_coding | deleterious(0) | possibly_damaging(0.906) | TCGA-CK-4951-01 | Colorectum | colon adenocarcinoma | Female | >=65 | I/II | Unknown | Unknown | PD | |
| VEZF1 | SNV | Missense_Mutation | c.893C>T | p.Ala298Val | p.A298V | Q14119 | protein_coding | deleterious(0.01) | benign(0.288) | TCGA-D5-6928-01 | Colorectum | colon adenocarcinoma | Male | >=65 | I/II | Unknown | Unknown | SD | |
| VEZF1 | SNV | Missense_Mutation | c.511A>G | p.Lys171Glu | p.K171E | Q14119 | protein_coding | tolerated(0.09) | benign(0.345) | TCGA-D5-6928-01 | Colorectum | colon adenocarcinoma | Male | >=65 | I/II | Unknown | Unknown | SD | |
| VEZF1 | SNV | Missense_Mutation | c.622A>G | p.Asn208Asp | p.N208D | Q14119 | protein_coding | tolerated(0.64) | possibly_damaging(0.807) | TCGA-F4-6856-01 | Colorectum | colon adenocarcinoma | Male | <65 | I/II | Ancillary | leucovorin | CR | |
| VEZF1 | SNV | Missense_Mutation | c.398C>T | p.Ala133Val | p.A133V | Q14119 | protein_coding | tolerated(0.06) | benign(0.201) | TCGA-G4-6588-01 | Colorectum | colon adenocarcinoma | Female | <65 | I/II | Unknown | Unknown | SD |
| Page: 1 2 3 4 5 |
Top |
Related drugs of malignant transformation related genes |
| Identification of chemicals and drugs interact with genes involved in malignant transfromation |
| (DGIdb 4.0) |
| Entrez ID | Symbol | Category | Interaction Types | Drug Claim Name | Drug Name | PMIDs |
| Page: 1 |

Copyright 2023-Present -The University of Texas Health Science Center at Houston |