
|
|||||
|
 | |
| |
| |
| |
| |
| |
|
Gene: VEGFD |
Gene summary for VEGFD |
| Gene information | Species | Human | Gene symbol | VEGFD | Gene ID | 2277 |
| Gene name | vascular endothelial growth factor D | |
| Gene Alias | FIGF | |
| Cytomap | Xp22.2 | |
| Gene Type | protein-coding | GO ID | GO:0001525 | UniProtAcc | O43915 |
Top |
Malignant transformation analysis |
| Identification of the aberrant gene expression in precancerous and cancerous lesions by comparing the gene expression of stem-like cells in diseased tissues with normal stem cells |
| Entrez ID | Symbol | Replicates | Species | Organ | Tissue | Adj P-value | Log2FC | Malignancy |
| 2277 | VEGFD | S014 | Human | Liver | HCC | 2.66e-13 | 5.74e-01 | 0.2254 |
| 2277 | VEGFD | S015 | Human | Liver | HCC | 6.11e-04 | 3.20e-01 | 0.2375 |
| 2277 | VEGFD | S016 | Human | Liver | HCC | 1.18e-15 | 5.08e-01 | 0.2243 |
| Page: 1 |
| Tissue | Expression Dynamics | Abbreviation |
| Liver | 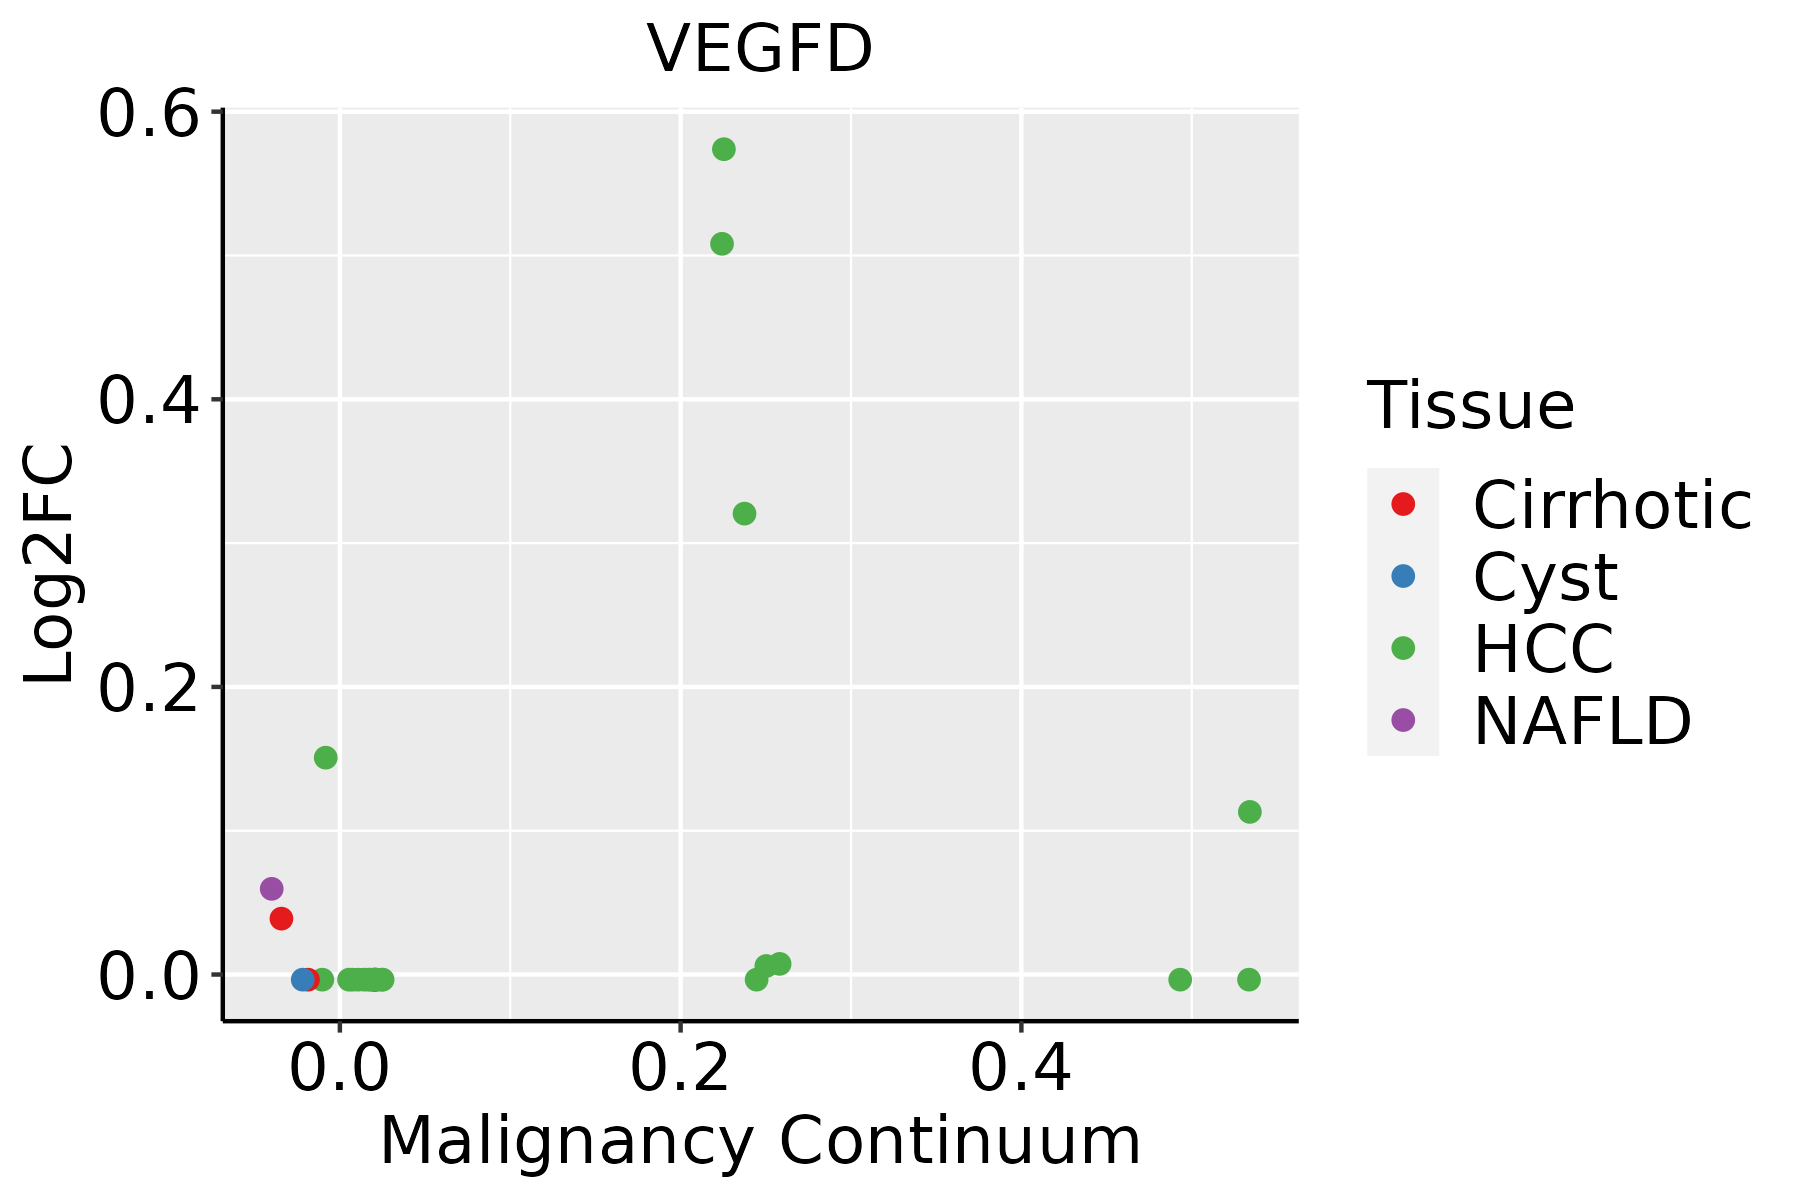 | HCC: Hepatocellular carcinoma |
| NAFLD: Non-alcoholic fatty liver disease |
| ∗log2FC in expression of this searched gene in stem-like cells from each diseased tissue sample relative to stem-like cells in normal samples in each tissue plotted against the malignancy continuum. Samples are colored based on if they are from different disease stage. |
Top |
Malignant transformation related pathway analysis |
| Find out the enriched GO biological processes and KEGG pathways involved in transition from healthy to precancer to cancer |
| Tissue | Disease Stage | Enriched GO biological Processes |
| Colorectum | AD |  |
| Colorectum | SER |  |
| Colorectum | MSS |  |
| Colorectum | MSI-H |  |
| Colorectum | FAP |  |
| ∗Top 15 enriched GO BP terms are showed in the bar plot of each disease state in each tissue. Each row represents a significant GO biological process which is colored according to the -log10(p.adjust). |
| Page: 1 2 3 4 5 6 7 8 9 |
| GO ID | Tissue | Disease Stage | Description | Gene Ratio | Bg Ratio | pvalue | p.adjust | Count |
| GO:000166612 | Liver | HCC | response to hypoxia | 172/7958 | 307/18723 | 1.06e-06 | 1.59e-05 | 172 |
| GO:003629312 | Liver | HCC | response to decreased oxygen levels | 179/7958 | 322/18723 | 1.29e-06 | 1.87e-05 | 179 |
| GO:007048212 | Liver | HCC | response to oxygen levels | 191/7958 | 347/18723 | 1.42e-06 | 2.03e-05 | 191 |
| Page: 1 |
| Pathway ID | Tissue | Disease Stage | Description | Gene Ratio | Bg Ratio | pvalue | p.adjust | qvalue | Count |
| hsa0451041 | Liver | HCC | Focal adhesion | 125/4020 | 203/8465 | 3.12e-05 | 1.88e-04 | 1.04e-04 | 125 |
| hsa0451051 | Liver | HCC | Focal adhesion | 125/4020 | 203/8465 | 3.12e-05 | 1.88e-04 | 1.04e-04 | 125 |
| Page: 1 |
Top |
Cell-cell communication analysis |
| Identification of potential cell-cell interactions between two cell types and their ligand-receptor pairs for different disease states |
| Ligand | Receptor | LRpair | Pathway | Tissue | Disease Stage |
| VEGFD | KDR | VEGFD_VEGFR2 | VEGF | Breast | ADJ |
| VEGFD | KDR | VEGFD_VEGFR2 | VEGF | Breast | Healthy |
| VEGFD | FLT4 | VEGFD_VEGFR3 | VEGF | Lung | MIAC |
| VEGFD | KDR | VEGFD_VEGFR2 | VEGF | Lung | MIAC |
| VEGFD | FLT4_KDR | VEGFD_VEGFR2R3 | VEGF | Lung | MIAC |
| Page: 1 |
Top |
Single-cell gene regulatory network inference analysis |
| Find out the significant the regulons (TFs) and the target genes of each regulon across cell types for different disease states |
| TF | Cell Type | Tissue | Disease Stage | Target Gene | RSS | Regulon Activity |
| ∗The dot plots of a searched regulon are shown for all cell subpopulations in each disease state of each tissue based on the regulon specific score inferred using pySCENIC and by calculating the average expression. |
| Page: 1 |
Top |
Somatic mutation of malignant transformation related genes |
| Annotation of somatic variants for genes involved in malignant transformation |
| Hugo Symbol | Variant Class | Variant Classification | dbSNP RS | HGVSc | HGVSp | HGVSp Short | SWISSPROT | BIOTYPE | SIFT | PolyPhen | Tumor Sample Barcode | Tissue | Histology | Sex | Age | Stage | Therapy Types | Drugs | Outcome |
| VEGFD | SNV | Missense_Mutation | rs150253418 | c.962N>G | p.His321Arg | p.H321R | O43915 | protein_coding | tolerated(0.48) | benign(0) | TCGA-A2-A0SW-01 | Breast | breast invasive carcinoma | Female | >=65 | III/IV | Hormone Therapy | arimidex | PD |
| VEGFD | SNV | Missense_Mutation | c.289N>A | p.Glu97Lys | p.E97K | O43915 | protein_coding | deleterious(0.03) | benign(0.012) | TCGA-AC-A23H-01 | Breast | breast invasive carcinoma | Female | >=65 | I/II | Unknown | Unknown | PD | |
| VEGFD | SNV | Missense_Mutation | c.323G>T | p.Arg108Ile | p.R108I | O43915 | protein_coding | deleterious(0) | possibly_damaging(0.501) | TCGA-AN-A046-01 | Breast | breast invasive carcinoma | Female | >=65 | I/II | Unknown | Unknown | SD | |
| VEGFD | SNV | Missense_Mutation | novel | c.305N>C | p.Ile102Thr | p.I102T | O43915 | protein_coding | deleterious(0.03) | probably_damaging(0.97) | TCGA-BH-A18G-01 | Breast | breast invasive carcinoma | Female | >=65 | I/II | Unknown | Unknown | SD |
| VEGFD | SNV | Missense_Mutation | c.275N>G | p.Thr92Ser | p.T92S | O43915 | protein_coding | deleterious(0.01) | benign(0.015) | TCGA-BH-A18V-01 | Breast | breast invasive carcinoma | Female | <65 | I/II | Unknown | Unknown | SD | |
| VEGFD | SNV | Missense_Mutation | novel | c.906N>C | p.Gln302His | p.Q302H | O43915 | protein_coding | tolerated(0.13) | benign(0.006) | TCGA-EW-A3E8-01 | Breast | breast invasive carcinoma | Female | <65 | I/II | Hormone Therapy | anastrozole | SD |
| VEGFD | insertion | Frame_Shift_Ins | novel | c.824_825insTGTAGTCTCTGAGTCCTTTGCTAATCGCAACTCTTGTGAATTAT | p.Pro276ValfsTer21 | p.P276Vfs*21 | O43915 | protein_coding | TCGA-B6-A0IE-01 | Breast | breast invasive carcinoma | Female | <65 | III/IV | Unknown | Unknown | PD | ||
| VEGFD | deletion | Frame_Shift_Del | novel | c.710delT | p.Leu237CysfsTer26 | p.L237Cfs*26 | O43915 | protein_coding | TCGA-EW-A2FV-01 | Breast | breast invasive carcinoma | Female | <65 | III/IV | Chemotherapy | docetaxel | SD | ||
| VEGFD | SNV | Missense_Mutation | c.393N>A | p.Phe131Leu | p.F131L | O43915 | protein_coding | deleterious(0.01) | probably_damaging(0.997) | TCGA-IR-A3LK-01 | Cervix | cervical & endocervical cancer | Female | >=65 | I/II | Chemotherapy | cisplatin | PD | |
| VEGFD | SNV | Missense_Mutation | rs776563381 | c.238N>T | p.Arg80Cys | p.R80C | O43915 | protein_coding | deleterious(0) | probably_damaging(0.95) | TCGA-AZ-6598-01 | Colorectum | colon adenocarcinoma | Female | >=65 | I/II | Unknown | Unknown | SD |
| Page: 1 2 3 4 5 |
Top |
Related drugs of malignant transformation related genes |
| Identification of chemicals and drugs interact with genes involved in malignant transfromation |
| (DGIdb 4.0) |
| Entrez ID | Symbol | Category | Interaction Types | Drug Claim Name | Drug Name | PMIDs |
| Page: 1 |

Copyright 2023-Present -The University of Texas Health Science Center at Houston |