| Tissue | Expression Dynamics | Abbreviation |
| Esophagus | 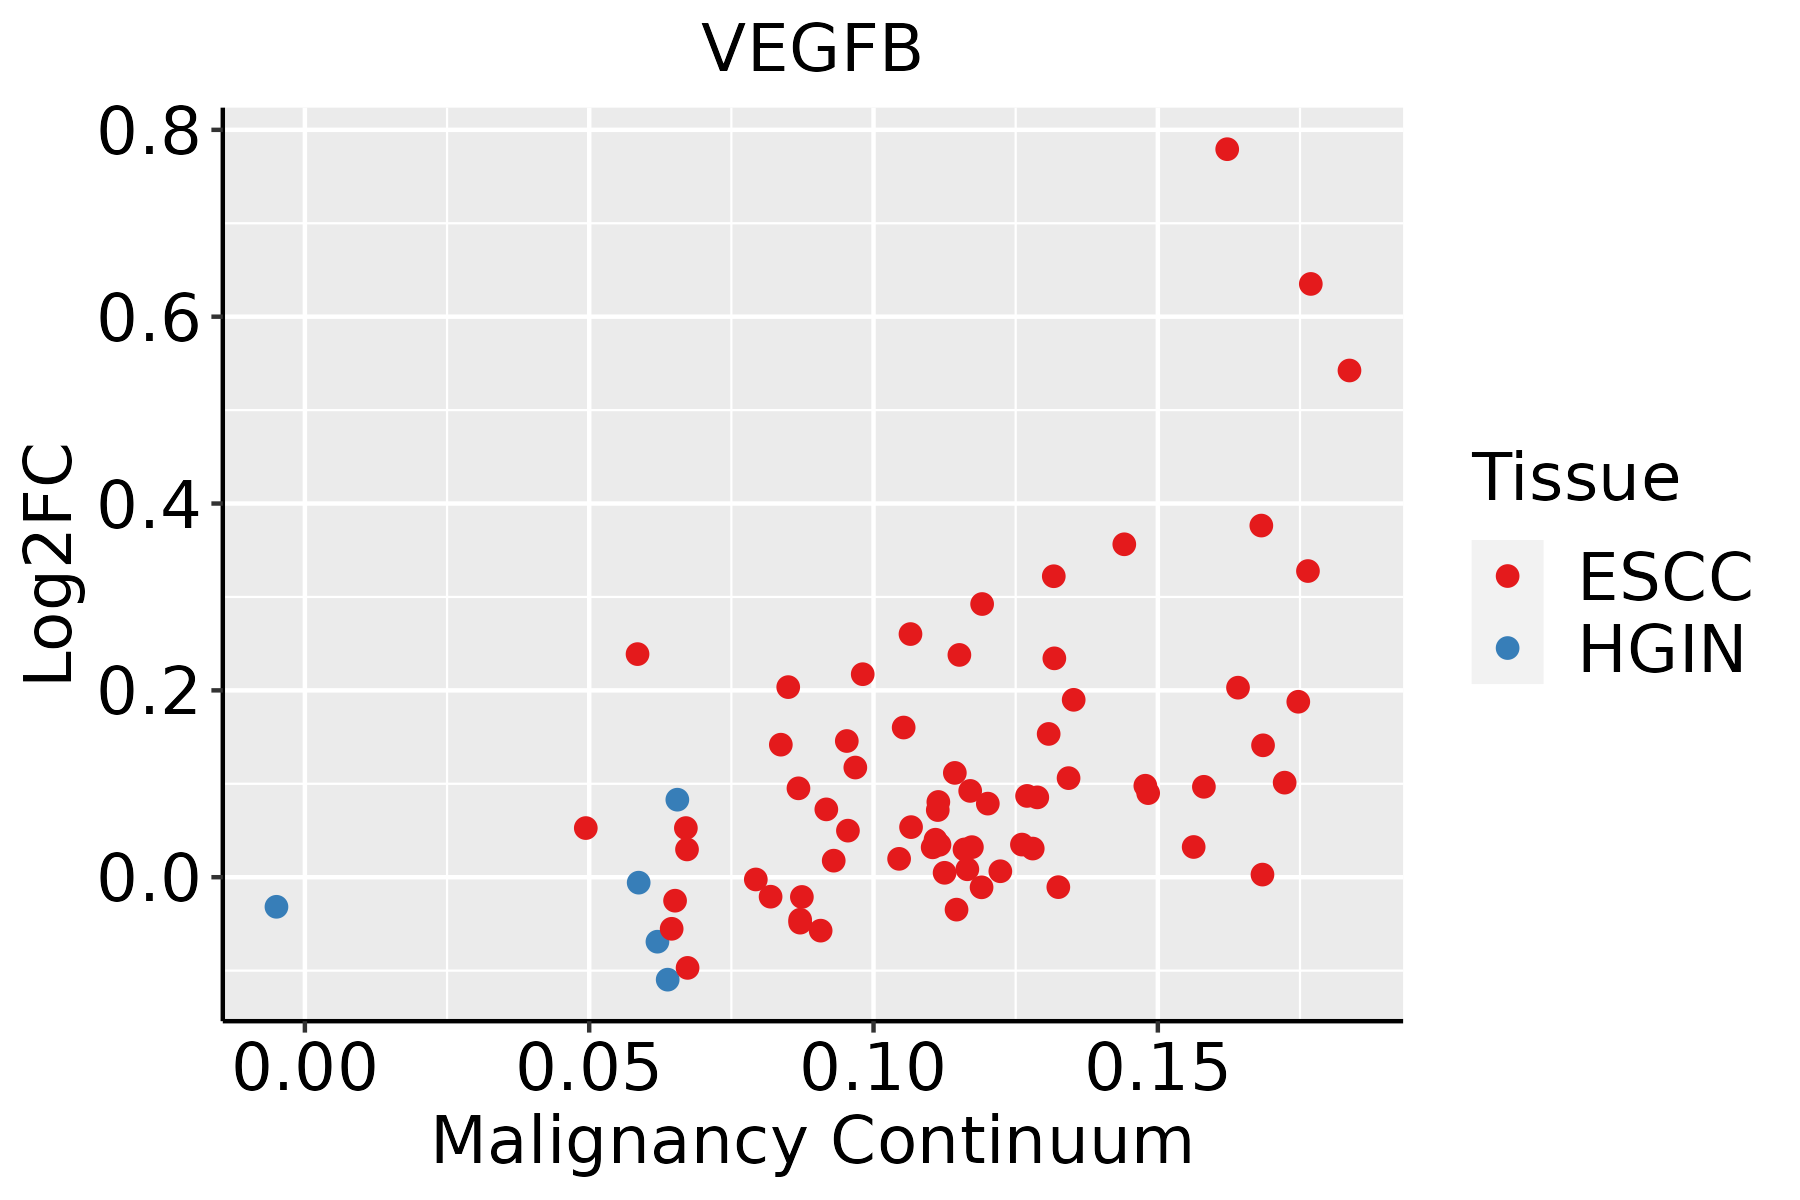 | ESCC: Esophageal squamous cell carcinoma |
| HGIN: High-grade intraepithelial neoplasias |
| LGIN: Low-grade intraepithelial neoplasias |
| Oral Cavity | 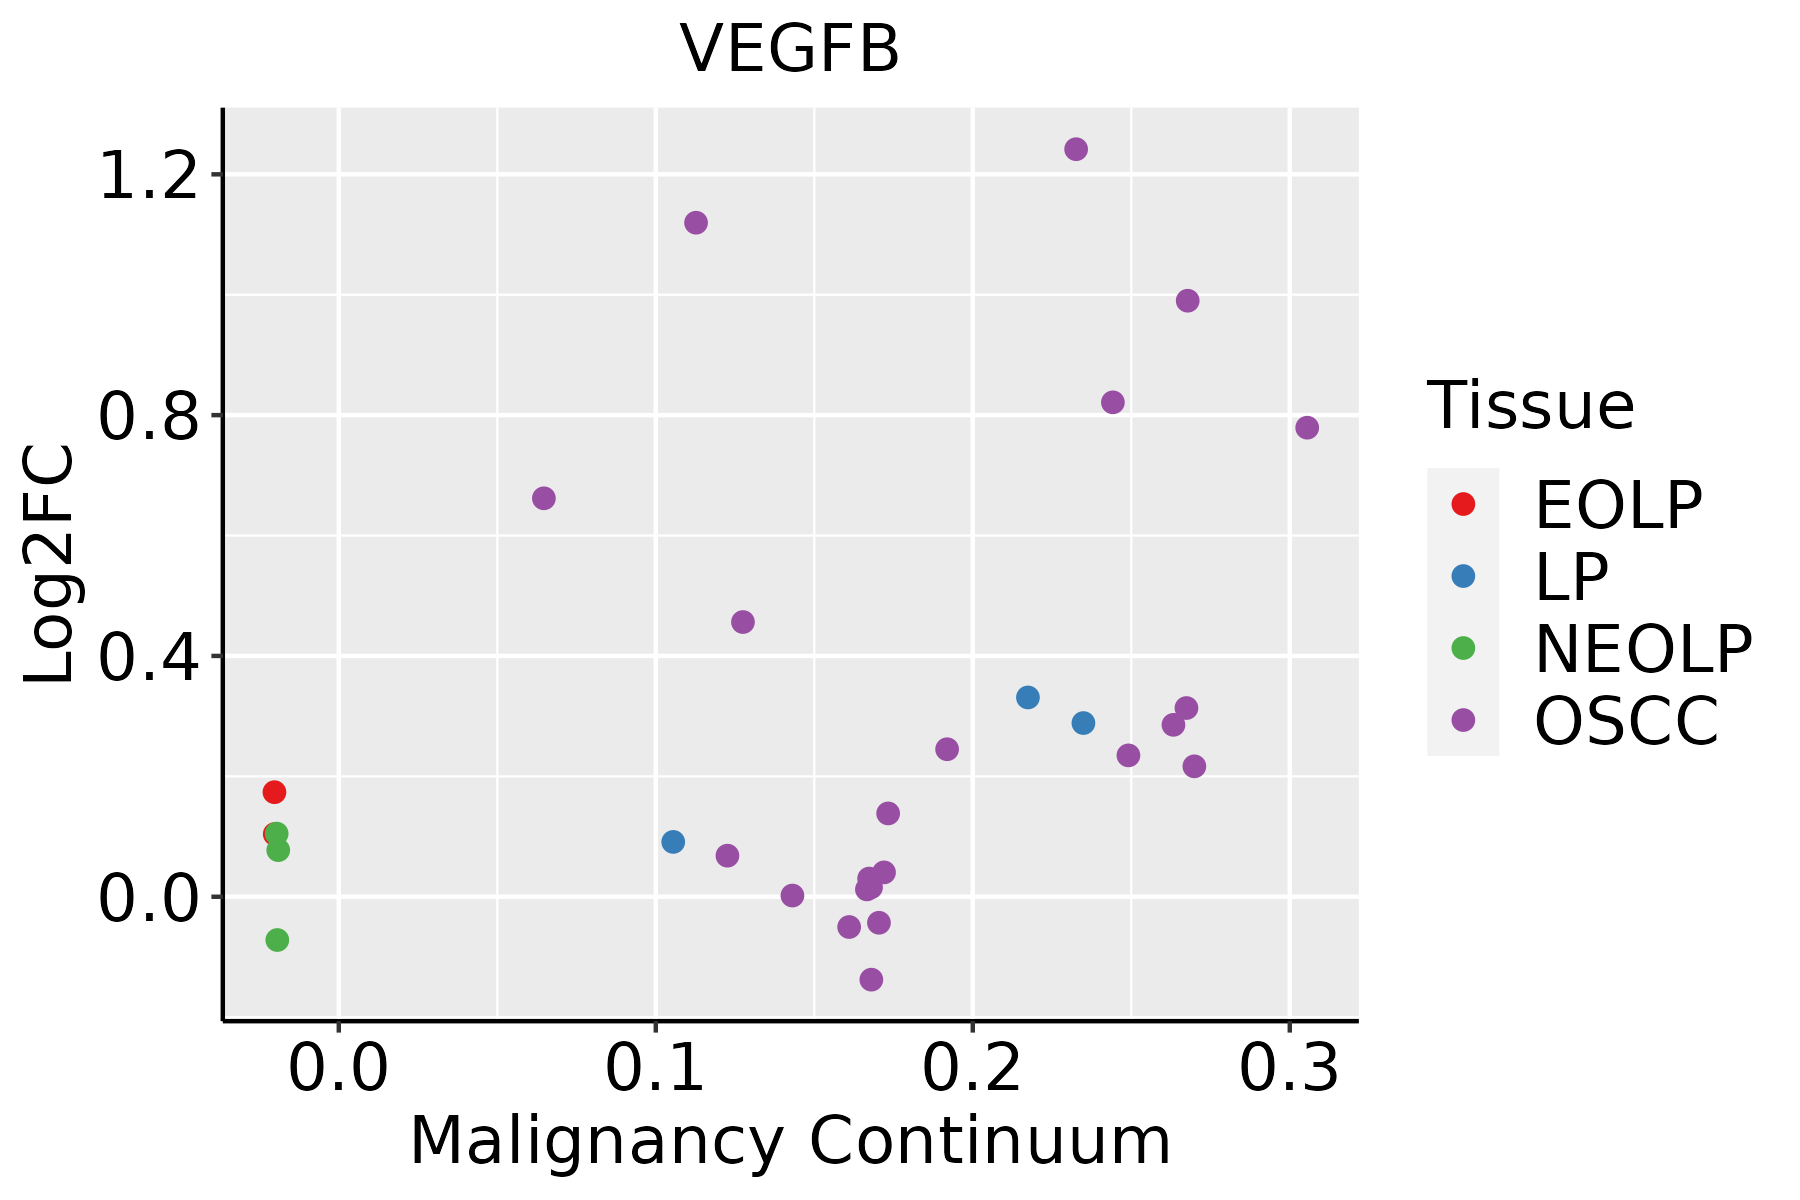 | EOLP: Erosive Oral lichen planus |
| LP: leukoplakia |
| NEOLP: Non-erosive oral lichen planus |
| OSCC: Oral squamous cell carcinoma |
| Thyroid | 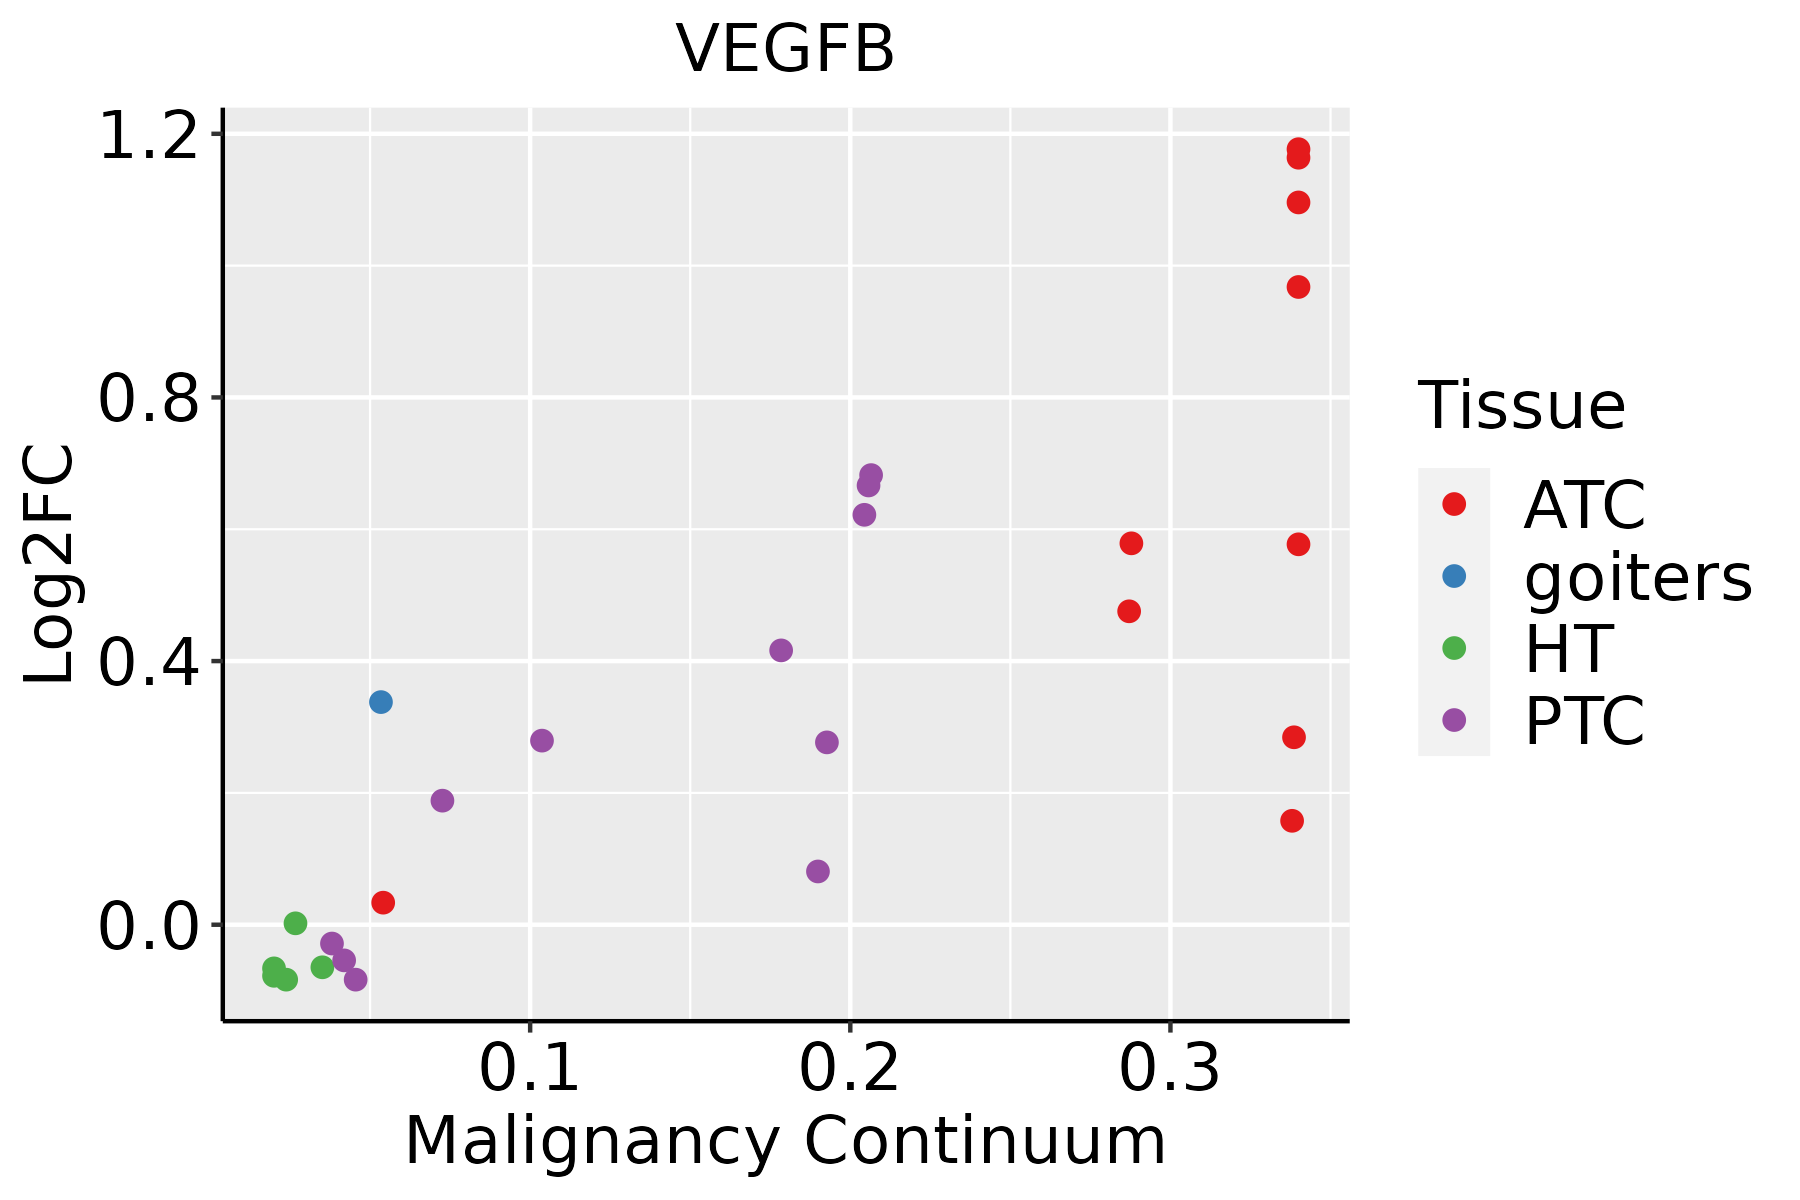 | ATC: Anaplastic thyroid cancer |
| HT: Hashimoto's thyroiditis |
| PTC: Papillary thyroid cancer |
| GO ID | Tissue | Disease Stage | Description | Gene Ratio | Bg Ratio | pvalue | p.adjust | Count |
| GO:0070482111 | Esophagus | ESCC | response to oxygen levels | 218/8552 | 347/18723 | 6.91e-11 | 2.17e-09 | 218 |
| GO:0036293111 | Esophagus | ESCC | response to decreased oxygen levels | 201/8552 | 322/18723 | 8.37e-10 | 2.04e-08 | 201 |
| GO:0001666111 | Esophagus | ESCC | response to hypoxia | 192/8552 | 307/18723 | 1.59e-09 | 3.69e-08 | 192 |
| GO:00091002 | Esophagus | ESCC | glycoprotein metabolic process | 226/8552 | 387/18723 | 2.64e-07 | 3.94e-06 | 226 |
| GO:00700854 | Esophagus | ESCC | glycosylation | 144/8552 | 240/18723 | 5.12e-06 | 5.38e-05 | 144 |
| GO:00064865 | Esophagus | ESCC | protein glycosylation | 135/8552 | 226/18723 | 1.36e-05 | 1.24e-04 | 135 |
| GO:00434135 | Esophagus | ESCC | macromolecule glycosylation | 135/8552 | 226/18723 | 1.36e-05 | 1.24e-04 | 135 |
| GO:00091012 | Esophagus | ESCC | glycoprotein biosynthetic process | 181/8552 | 317/18723 | 2.54e-05 | 2.15e-04 | 181 |
| GO:000941020 | Esophagus | ESCC | response to xenobiotic stimulus | 253/8552 | 462/18723 | 4.55e-05 | 3.58e-04 | 253 |
| GO:005067318 | Esophagus | ESCC | epithelial cell proliferation | 238/8552 | 437/18723 | 1.19e-04 | 8.20e-04 | 238 |
| GO:005067817 | Esophagus | ESCC | regulation of epithelial cell proliferation | 206/8552 | 381/18723 | 5.51e-04 | 3.02e-03 | 206 |
| GO:000268515 | Esophagus | ESCC | regulation of leukocyte migration | 114/8552 | 210/18723 | 7.26e-03 | 2.63e-02 | 114 |
| GO:00064931 | Esophagus | ESCC | protein O-linked glycosylation | 51/8552 | 86/18723 | 7.54e-03 | 2.70e-02 | 51 |
| GO:00513025 | Esophagus | ESCC | regulation of cell division | 97/8552 | 177/18723 | 8.93e-03 | 3.12e-02 | 97 |
| GO:007048219 | Oral cavity | OSCC | response to oxygen levels | 200/7305 | 347/18723 | 1.17e-12 | 5.13e-11 | 200 |
| GO:000166619 | Oral cavity | OSCC | response to hypoxia | 177/7305 | 307/18723 | 2.21e-11 | 7.50e-10 | 177 |
| GO:003629319 | Oral cavity | OSCC | response to decreased oxygen levels | 182/7305 | 322/18723 | 1.14e-10 | 3.41e-09 | 182 |
| GO:000268714 | Oral cavity | OSCC | positive regulation of leukocyte migration | 78/7305 | 135/18723 | 7.43e-06 | 8.08e-05 | 78 |
| GO:005067310 | Oral cavity | OSCC | epithelial cell proliferation | 212/7305 | 437/18723 | 2.82e-05 | 2.61e-04 | 212 |
| GO:000941018 | Oral cavity | OSCC | response to xenobiotic stimulus | 222/7305 | 462/18723 | 4.00e-05 | 3.48e-04 | 222 |
| Pathway ID | Tissue | Disease Stage | Description | Gene Ratio | Bg Ratio | pvalue | p.adjust | qvalue | Count |
| hsa0493310 | Esophagus | ESCC | AGE-RAGE signaling pathway in diabetic complications | 72/4205 | 100/8465 | 4.15e-06 | 2.28e-05 | 1.17e-05 | 72 |
| hsa0451020 | Esophagus | ESCC | Focal adhesion | 127/4205 | 203/8465 | 1.25e-04 | 4.99e-04 | 2.56e-04 | 127 |
| hsa049268 | Esophagus | ESCC | Relaxin signaling pathway | 81/4205 | 129/8465 | 1.72e-03 | 5.09e-03 | 2.61e-03 | 81 |
| hsa041517 | Esophagus | ESCC | PI3K-Akt signaling pathway | 197/4205 | 354/8465 | 1.24e-02 | 2.83e-02 | 1.45e-02 | 197 |
| hsa0493317 | Esophagus | ESCC | AGE-RAGE signaling pathway in diabetic complications | 72/4205 | 100/8465 | 4.15e-06 | 2.28e-05 | 1.17e-05 | 72 |
| hsa04510111 | Esophagus | ESCC | Focal adhesion | 127/4205 | 203/8465 | 1.25e-04 | 4.99e-04 | 2.56e-04 | 127 |
| hsa0492616 | Esophagus | ESCC | Relaxin signaling pathway | 81/4205 | 129/8465 | 1.72e-03 | 5.09e-03 | 2.61e-03 | 81 |
| hsa0415114 | Esophagus | ESCC | PI3K-Akt signaling pathway | 197/4205 | 354/8465 | 1.24e-02 | 2.83e-02 | 1.45e-02 | 197 |
| hsa0451019 | Oral cavity | OSCC | Focal adhesion | 128/3704 | 203/8465 | 1.71e-08 | 1.63e-07 | 8.31e-08 | 128 |
| hsa049339 | Oral cavity | OSCC | AGE-RAGE signaling pathway in diabetic complications | 69/3704 | 100/8465 | 2.61e-07 | 1.65e-06 | 8.41e-07 | 69 |
| hsa0401014 | Oral cavity | OSCC | MAPK signaling pathway | 165/3704 | 302/8465 | 7.11e-05 | 2.74e-04 | 1.40e-04 | 165 |
| hsa041516 | Oral cavity | OSCC | PI3K-Akt signaling pathway | 185/3704 | 354/8465 | 6.26e-04 | 1.86e-03 | 9.49e-04 | 185 |
| hsa049267 | Oral cavity | OSCC | Relaxin signaling pathway | 74/3704 | 129/8465 | 1.20e-03 | 3.37e-03 | 1.72e-03 | 74 |
| hsa0401518 | Oral cavity | OSCC | Rap1 signaling pathway | 107/3704 | 210/8465 | 2.01e-02 | 4.34e-02 | 2.21e-02 | 107 |
| hsa04510110 | Oral cavity | OSCC | Focal adhesion | 128/3704 | 203/8465 | 1.71e-08 | 1.63e-07 | 8.31e-08 | 128 |
| hsa0493316 | Oral cavity | OSCC | AGE-RAGE signaling pathway in diabetic complications | 69/3704 | 100/8465 | 2.61e-07 | 1.65e-06 | 8.41e-07 | 69 |
| hsa0401015 | Oral cavity | OSCC | MAPK signaling pathway | 165/3704 | 302/8465 | 7.11e-05 | 2.74e-04 | 1.40e-04 | 165 |
| hsa0415113 | Oral cavity | OSCC | PI3K-Akt signaling pathway | 185/3704 | 354/8465 | 6.26e-04 | 1.86e-03 | 9.49e-04 | 185 |
| hsa0492615 | Oral cavity | OSCC | Relaxin signaling pathway | 74/3704 | 129/8465 | 1.20e-03 | 3.37e-03 | 1.72e-03 | 74 |
| hsa0401519 | Oral cavity | OSCC | Rap1 signaling pathway | 107/3704 | 210/8465 | 2.01e-02 | 4.34e-02 | 2.21e-02 | 107 |
| Hugo Symbol | Variant Class | Variant Classification | dbSNP RS | HGVSc | HGVSp | HGVSp Short | SWISSPROT | BIOTYPE | SIFT | PolyPhen | Tumor Sample Barcode | Tissue | Histology | Sex | Age | Stage | Therapy Types | Drugs | Outcome |
| VEGFB | SNV | Missense_Mutation | novel | c.385N>C | p.Lys129Gln | p.K129Q | P49765 | protein_coding | tolerated(0.26) | benign(0.023) | TCGA-OL-A66O-01 | Breast | breast invasive carcinoma | Female | <65 | I/II | Chemotherapy | cytoxan | CR |
| VEGFB | SNV | Missense_Mutation | novel | c.406G>A | p.Asp136Asn | p.D136N | P49765 | protein_coding | tolerated(0.12) | benign(0.395) | TCGA-Q1-A73P-01 | Cervix | cervical & endocervical cancer | Female | <65 | I/II | Unknown | Unknown | SD |
| VEGFB | SNV | Missense_Mutation | novel | c.323N>A | p.Ser108Asn | p.S108N | P49765 | protein_coding | tolerated(0.17) | possibly_damaging(0.587) | TCGA-AA-A010-01 | Colorectum | colon adenocarcinoma | Female | <65 | I/II | Chemotherapy | folinic | CR |
| VEGFB | SNV | Missense_Mutation | novel | c.364N>C | p.Cys122Arg | p.C122R | P49765 | protein_coding | deleterious(0) | probably_damaging(0.959) | TCGA-A5-A1OF-01 | Endometrium | uterine corpus endometrioid carcinoma | Female | <65 | I/II | Unknown | Unknown | SD |
| VEGFB | SNV | Missense_Mutation | rs753557187 | c.131N>A | p.Arg44His | p.R44H | P49765 | protein_coding | deleterious(0.01) | probably_damaging(0.965) | TCGA-B5-A1MX-01 | Endometrium | uterine corpus endometrioid carcinoma | Female | <65 | I/II | Hormone Therapy | megace | SD |
| VEGFB | SNV | Missense_Mutation | novel | c.136A>C | p.Thr46Pro | p.T46P | P49765 | protein_coding | tolerated(0.2) | possibly_damaging(0.795) | TCGA-BG-A0VZ-01 | Endometrium | uterine corpus endometrioid carcinoma | Female | <65 | III/IV | Chemotherapy | cisplatin | CR |
| VEGFB | SNV | Missense_Mutation | rs200892426 | c.307N>C | p.Met103Leu | p.M103L | P49765 | protein_coding | tolerated(0.07) | benign(0.003) | TCGA-BS-A0UJ-01 | Endometrium | uterine corpus endometrioid carcinoma | Female | >=65 | I/II | Unknown | Unknown | SD |
| VEGFB | SNV | Missense_Mutation | novel | c.257G>T | p.Gly86Val | p.G86V | P49765 | protein_coding | deleterious(0.01) | possibly_damaging(0.895) | TCGA-D1-A175-01 | Endometrium | uterine corpus endometrioid carcinoma | Female | <65 | I/II | Chemotherapy | paclitaxel | SD |
| VEGFB | SNV | Missense_Mutation | novel | c.536N>T | p.Ala179Val | p.A179V | P49765 | protein_coding | tolerated(0.12) | benign(0.005) | TCGA-D1-A17Q-01 | Endometrium | uterine corpus endometrioid carcinoma | Female | <65 | I/II | Unknown | Unknown | SD |
| VEGFB | SNV | Missense_Mutation | novel | c.262N>C | p.Glu88Gln | p.E88Q | P49765 | protein_coding | tolerated(0.12) | probably_damaging(0.998) | TCGA-EY-A1GS-01 | Endometrium | uterine corpus endometrioid carcinoma | Female | >=65 | III/IV | Chemotherapy | taxol | PD |
| Entrez ID | Symbol | Category | Interaction Types | Drug Claim Name | Drug Name | PMIDs |
| 7423 | VEGFB | CLINICALLY ACTIONABLE, DRUGGABLE GENOME, GROWTH FACTOR | inhibitor | CHEMBL2108313 | CONBERCEPT | |
| 7423 | VEGFB | CLINICALLY ACTIONABLE, DRUGGABLE GENOME, GROWTH FACTOR | | VEGF-2 | | |
| 7423 | VEGFB | CLINICALLY ACTIONABLE, DRUGGABLE GENOME, GROWTH FACTOR | inhibitor | SORAFENIB TOSYLATE | | |
| 7423 | VEGFB | CLINICALLY ACTIONABLE, DRUGGABLE GENOME, GROWTH FACTOR | | bevacizumab | BEVACIZUMAB | 20124951 |
| 7423 | VEGFB | CLINICALLY ACTIONABLE, DRUGGABLE GENOME, GROWTH FACTOR | | BEVACIZUMAB | BEVACIZUMAB | |
| 7423 | VEGFB | CLINICALLY ACTIONABLE, DRUGGABLE GENOME, GROWTH FACTOR | antibody | ZIV-AFLIBERCEPT | AFLIBERCEPT | |
| 7423 | VEGFB | CLINICALLY ACTIONABLE, DRUGGABLE GENOME, GROWTH FACTOR | | aflibercept | AFLIBERCEPT | 20124951 |
| 7423 | VEGFB | CLINICALLY ACTIONABLE, DRUGGABLE GENOME, GROWTH FACTOR | | Aflibercept | AFLIBERCEPT | |
| 7423 | VEGFB | CLINICALLY ACTIONABLE, DRUGGABLE GENOME, GROWTH FACTOR | inhibitor | ENDOSTATIN (84-114)-NH2 (JKC367) | | |
| 7423 | VEGFB | CLINICALLY ACTIONABLE, DRUGGABLE GENOME, GROWTH FACTOR | | LENALIDOMIDE | LENALIDOMIDE | |


