
|
|||||
|
 | |
| |
| |
| |
| |
| |
|
Gene: VDR |
Gene summary for VDR |
| Gene information | Species | Human | Gene symbol | VDR | Gene ID | 7421 |
| Gene name | vitamin D receptor | |
| Gene Alias | NR1I1 | |
| Cytomap | 12q13.11 | |
| Gene Type | protein-coding | GO ID | GO:0000003 | UniProtAcc | F1D8P8 |
Top |
Malignant transformation analysis |
| Identification of the aberrant gene expression in precancerous and cancerous lesions by comparing the gene expression of stem-like cells in diseased tissues with normal stem cells |
| Entrez ID | Symbol | Replicates | Species | Organ | Tissue | Adj P-value | Log2FC | Malignancy |
| 7421 | VDR | HTA11_347_2000001011 | Human | Colorectum | AD | 1.62e-19 | 9.41e-01 | -0.1954 |
| 7421 | VDR | HTA11_83_2000001011 | Human | Colorectum | SER | 9.05e-04 | 6.76e-01 | -0.1526 |
| 7421 | VDR | HTA11_696_2000001011 | Human | Colorectum | AD | 1.55e-10 | 8.26e-01 | -0.1464 |
| 7421 | VDR | HTA11_1391_2000001011 | Human | Colorectum | AD | 1.15e-04 | 6.67e-01 | -0.059 |
| 7421 | VDR | HTA11_5212_2000001011 | Human | Colorectum | AD | 4.58e-06 | 9.41e-01 | -0.2061 |
| 7421 | VDR | HTA11_99999965104_69814 | Human | Colorectum | MSS | 3.94e-07 | 7.33e-01 | 0.281 |
| 7421 | VDR | A002-C-010 | Human | Colorectum | FAP | 2.13e-04 | -2.40e-01 | 0.242 |
| 7421 | VDR | A001-C-207 | Human | Colorectum | FAP | 6.67e-03 | -2.24e-01 | 0.1278 |
| 7421 | VDR | A015-C-203 | Human | Colorectum | FAP | 4.53e-16 | -2.39e-01 | -0.1294 |
| 7421 | VDR | A015-C-204 | Human | Colorectum | FAP | 8.35e-05 | -1.99e-01 | -0.0228 |
| 7421 | VDR | A002-C-201 | Human | Colorectum | FAP | 9.29e-12 | -2.84e-01 | 0.0324 |
| 7421 | VDR | A002-C-203 | Human | Colorectum | FAP | 1.86e-05 | -2.18e-01 | 0.2786 |
| 7421 | VDR | A001-C-119 | Human | Colorectum | FAP | 2.28e-05 | -3.35e-01 | -0.1557 |
| 7421 | VDR | A001-C-108 | Human | Colorectum | FAP | 2.62e-10 | -3.00e-01 | -0.0272 |
| 7421 | VDR | A002-C-205 | Human | Colorectum | FAP | 2.25e-20 | -4.15e-01 | -0.1236 |
| 7421 | VDR | A015-C-005 | Human | Colorectum | FAP | 3.10e-05 | -2.19e-01 | -0.0336 |
| 7421 | VDR | A015-C-006 | Human | Colorectum | FAP | 1.14e-11 | -3.37e-01 | -0.0994 |
| 7421 | VDR | A015-C-106 | Human | Colorectum | FAP | 1.92e-05 | -8.04e-02 | -0.0511 |
| 7421 | VDR | A002-C-114 | Human | Colorectum | FAP | 6.39e-16 | -3.33e-01 | -0.1561 |
| 7421 | VDR | A015-C-104 | Human | Colorectum | FAP | 3.28e-18 | -2.83e-01 | -0.1899 |
| Page: 1 2 3 |
| Tissue | Expression Dynamics | Abbreviation |
| Colorectum (GSE201348) |  | FAP: Familial adenomatous polyposis |
| CRC: Colorectal cancer | ||
| Colorectum (HTA11) |  | AD: Adenomas |
| SER: Sessile serrated lesions | ||
| MSI-H: Microsatellite-high colorectal cancer | ||
| MSS: Microsatellite stable colorectal cancer | ||
| Liver |  | HCC: Hepatocellular carcinoma |
| NAFLD: Non-alcoholic fatty liver disease | ||
| Oral Cavity | 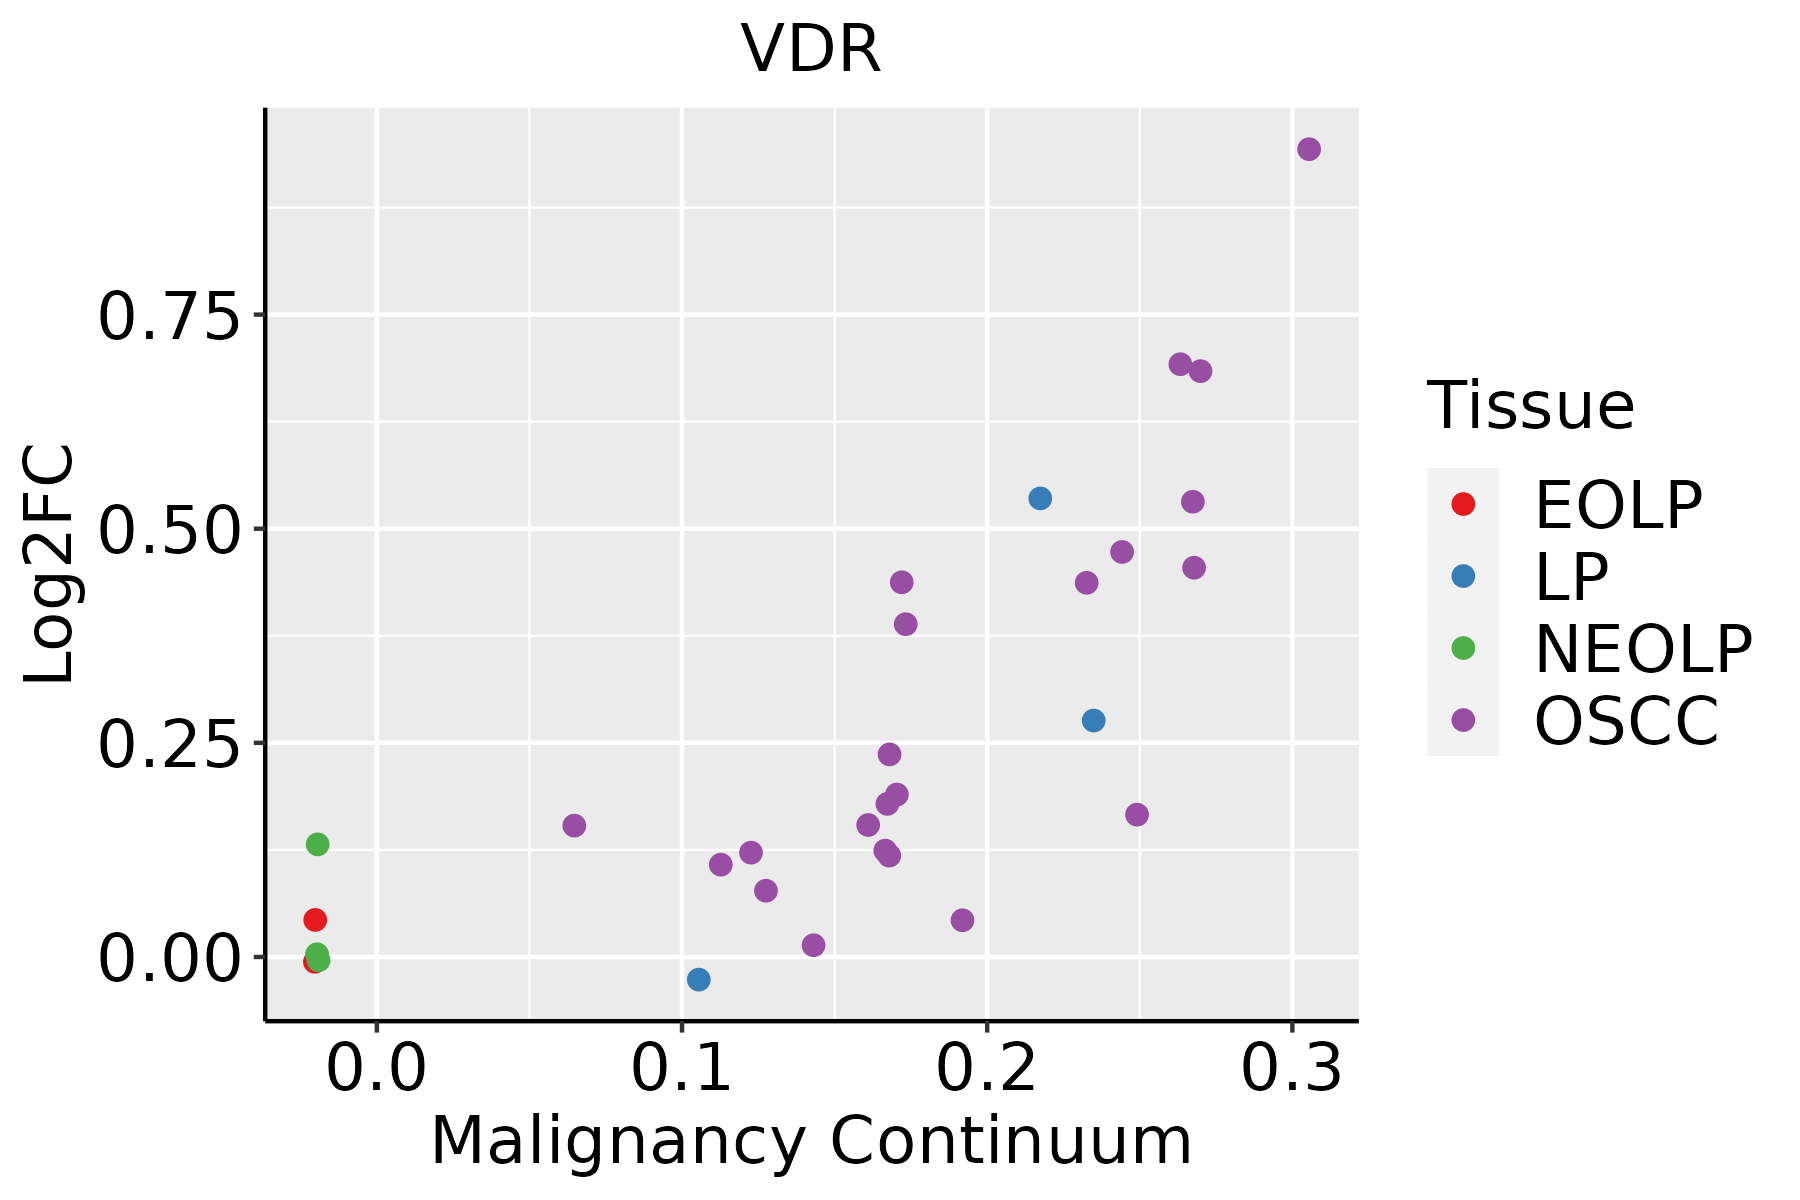 | EOLP: Erosive Oral lichen planus |
| LP: leukoplakia | ||
| NEOLP: Non-erosive oral lichen planus | ||
| OSCC: Oral squamous cell carcinoma |
| ∗log2FC in expression of this searched gene in stem-like cells from each diseased tissue sample relative to stem-like cells in normal samples in each tissue plotted against the malignancy continuum. Samples are colored based on if they are from different disease stage. |
Top |
Malignant transformation related pathway analysis |
| Find out the enriched GO biological processes and KEGG pathways involved in transition from healthy to precancer to cancer |
| Tissue | Disease Stage | Enriched GO biological Processes |
| Colorectum | AD |  |
| Colorectum | SER |  |
| Colorectum | MSS |  |
| Colorectum | MSI-H |  |
| Colorectum | FAP |  |
| ∗Top 15 enriched GO BP terms are showed in the bar plot of each disease state in each tissue. Each row represents a significant GO biological process which is colored according to the -log10(p.adjust). |
| Page: 1 2 3 4 5 6 7 8 9 |
| GO ID | Tissue | Disease Stage | Description | Gene Ratio | Bg Ratio | pvalue | p.adjust | Count |
| GO:0048732 | Colorectum | AD | gland development | 149/3918 | 436/18723 | 6.07e-11 | 6.33e-09 | 149 |
| GO:0030879 | Colorectum | AD | mammary gland development | 53/3918 | 137/18723 | 1.46e-06 | 4.58e-05 | 53 |
| GO:0030522 | Colorectum | AD | intracellular receptor signaling pathway | 87/3918 | 265/18723 | 3.69e-06 | 1.03e-04 | 87 |
| GO:0031667 | Colorectum | AD | response to nutrient levels | 138/3918 | 474/18723 | 1.22e-05 | 2.68e-04 | 138 |
| GO:0001890 | Colorectum | AD | placenta development | 51/3918 | 144/18723 | 3.99e-05 | 7.16e-04 | 51 |
| GO:0061180 | Colorectum | AD | mammary gland epithelium development | 28/3918 | 67/18723 | 8.74e-05 | 1.35e-03 | 28 |
| GO:0022612 | Colorectum | AD | gland morphogenesis | 42/3918 | 118/18723 | 1.62e-04 | 2.23e-03 | 42 |
| GO:0071496 | Colorectum | AD | cellular response to external stimulus | 94/3918 | 320/18723 | 1.98e-04 | 2.64e-03 | 94 |
| GO:0050878 | Colorectum | AD | regulation of body fluid levels | 108/3918 | 379/18723 | 2.54e-04 | 3.20e-03 | 108 |
| GO:0060562 | Colorectum | AD | epithelial tube morphogenesis | 93/3918 | 325/18723 | 5.65e-04 | 6.00e-03 | 93 |
| GO:0007589 | Colorectum | AD | body fluid secretion | 33/3918 | 93/18723 | 8.26e-04 | 8.13e-03 | 33 |
| GO:0050673 | Colorectum | AD | epithelial cell proliferation | 119/3918 | 437/18723 | 8.75e-04 | 8.51e-03 | 119 |
| GO:0061458 | Colorectum | AD | reproductive system development | 116/3918 | 427/18723 | 1.11e-03 | 1.01e-02 | 116 |
| GO:0043616 | Colorectum | AD | keratinocyte proliferation | 19/3918 | 46/18723 | 1.36e-03 | 1.19e-02 | 19 |
| GO:0060443 | Colorectum | AD | mammary gland morphogenesis | 18/3918 | 43/18723 | 1.51e-03 | 1.27e-02 | 18 |
| GO:0048608 | Colorectum | AD | reproductive structure development | 114/3918 | 424/18723 | 1.78e-03 | 1.47e-02 | 114 |
| GO:0031668 | Colorectum | AD | cellular response to extracellular stimulus | 71/3918 | 246/18723 | 1.86e-03 | 1.52e-02 | 71 |
| GO:0031669 | Colorectum | AD | cellular response to nutrient levels | 63/3918 | 215/18723 | 2.19e-03 | 1.73e-02 | 63 |
| GO:0010837 | Colorectum | AD | regulation of keratinocyte proliferation | 15/3918 | 35/18723 | 2.78e-03 | 2.09e-02 | 15 |
| GO:0007595 | Colorectum | AD | lactation | 18/3918 | 47/18723 | 4.81e-03 | 3.25e-02 | 18 |
| Page: 1 2 3 4 5 6 7 8 9 10 |
| Pathway ID | Tissue | Disease Stage | Description | Gene Ratio | Bg Ratio | pvalue | p.adjust | qvalue | Count |
| hsa049612 | Colorectum | SER | Endocrine and other factor-regulated calcium reabsorption | 19/1580 | 53/8465 | 2.32e-03 | 1.75e-02 | 1.27e-02 | 19 |
| hsa049282 | Colorectum | SER | Parathyroid hormone synthesis, secretion and action | 31/1580 | 106/8465 | 5.20e-03 | 3.28e-02 | 2.38e-02 | 31 |
| hsa049613 | Colorectum | SER | Endocrine and other factor-regulated calcium reabsorption | 19/1580 | 53/8465 | 2.32e-03 | 1.75e-02 | 1.27e-02 | 19 |
| hsa049283 | Colorectum | SER | Parathyroid hormone synthesis, secretion and action | 31/1580 | 106/8465 | 5.20e-03 | 3.28e-02 | 2.38e-02 | 31 |
| hsa049614 | Colorectum | MSS | Endocrine and other factor-regulated calcium reabsorption | 24/1875 | 53/8465 | 1.49e-04 | 1.24e-03 | 7.61e-04 | 24 |
| hsa049284 | Colorectum | MSS | Parathyroid hormone synthesis, secretion and action | 37/1875 | 106/8465 | 1.72e-03 | 9.13e-03 | 5.59e-03 | 37 |
| hsa049615 | Colorectum | MSS | Endocrine and other factor-regulated calcium reabsorption | 24/1875 | 53/8465 | 1.49e-04 | 1.24e-03 | 7.61e-04 | 24 |
| hsa049285 | Colorectum | MSS | Parathyroid hormone synthesis, secretion and action | 37/1875 | 106/8465 | 1.72e-03 | 9.13e-03 | 5.59e-03 | 37 |
| hsa049616 | Colorectum | FAP | Endocrine and other factor-regulated calcium reabsorption | 18/1404 | 53/8465 | 1.52e-03 | 7.94e-03 | 4.83e-03 | 18 |
| hsa049286 | Colorectum | FAP | Parathyroid hormone synthesis, secretion and action | 29/1404 | 106/8465 | 3.37e-03 | 1.44e-02 | 8.77e-03 | 29 |
| hsa049617 | Colorectum | FAP | Endocrine and other factor-regulated calcium reabsorption | 18/1404 | 53/8465 | 1.52e-03 | 7.94e-03 | 4.83e-03 | 18 |
| hsa049287 | Colorectum | FAP | Parathyroid hormone synthesis, secretion and action | 29/1404 | 106/8465 | 3.37e-03 | 1.44e-02 | 8.77e-03 | 29 |
| hsa049618 | Colorectum | CRC | Endocrine and other factor-regulated calcium reabsorption | 18/1091 | 53/8465 | 6.36e-05 | 1.12e-03 | 7.57e-04 | 18 |
| hsa05207 | Colorectum | CRC | Chemical carcinogenesis - receptor activation | 42/1091 | 212/8465 | 2.62e-03 | 1.75e-02 | 1.19e-02 | 42 |
| hsa049288 | Colorectum | CRC | Parathyroid hormone synthesis, secretion and action | 24/1091 | 106/8465 | 3.71e-03 | 2.29e-02 | 1.55e-02 | 24 |
| hsa049619 | Colorectum | CRC | Endocrine and other factor-regulated calcium reabsorption | 18/1091 | 53/8465 | 6.36e-05 | 1.12e-03 | 7.57e-04 | 18 |
| hsa052071 | Colorectum | CRC | Chemical carcinogenesis - receptor activation | 42/1091 | 212/8465 | 2.62e-03 | 1.75e-02 | 1.19e-02 | 42 |
| hsa049289 | Colorectum | CRC | Parathyroid hormone synthesis, secretion and action | 24/1091 | 106/8465 | 3.71e-03 | 2.29e-02 | 1.55e-02 | 24 |
| hsa051526 | Oral cavity | OSCC | Tuberculosis | 105/3704 | 180/8465 | 5.00e-05 | 2.04e-04 | 1.04e-04 | 105 |
| hsa0515211 | Oral cavity | OSCC | Tuberculosis | 105/3704 | 180/8465 | 5.00e-05 | 2.04e-04 | 1.04e-04 | 105 |
| Page: 1 2 |
Top |
Cell-cell communication analysis |
| Identification of potential cell-cell interactions between two cell types and their ligand-receptor pairs for different disease states |
| Ligand | Receptor | LRpair | Pathway | Tissue | Disease Stage |
| Page: 1 |
Top |
Single-cell gene regulatory network inference analysis |
| Find out the significant the regulons (TFs) and the target genes of each regulon across cell types for different disease states |
| TF | Cell Type | Tissue | Disease Stage | Target Gene | RSS | Regulon Activity |
| VDR | CD8TEXP | Breast | ADJ | TNFRSF4,OSCAR,RBPJ, etc. | 8.49e-02 |  |
| VDR | MAST | Breast | Precancer | TNFRSF4,OSCAR,RBPJ, etc. | 2.77e-02 |  |
| VDR | MES | Cervix | Healthy | TXNDC11,CCL4,TRAM2, etc. | 3.04e-01 |  |
| VDR | ABS | Colorectum | AD | CES2,MT-RNR2,FABP1, etc. | 2.81e-01 |  |
| VDR | IMENT | Colorectum | AD | CES2,MT-RNR2,FABP1, etc. | 1.61e-01 | |
| VDR | ABS | Colorectum | ADJ | SELENBP1,SLC26A2,ZBTB7A, etc. | 3.20e-01 |  |
| VDR | ABS | Colorectum | CRC | SELENBP1,SLC26A2,ZBTB7A, etc. | 5.21e-02 |  |
| VDR | ABS | Colorectum | FAP | SELENBP1,SLC26A2,ZBTB7A, etc. | 2.21e-01 |  |
| VDR | IMENT | Colorectum | FAP | SELENBP1,SLC26A2,ZBTB7A, etc. | 1.46e-01 | |
| VDR | IMENT | Colorectum | SER | CES2,MT-RNR2,FABP1, etc. | 1.98e-01 |  |
| ∗The dot plots of a searched regulon are shown for all cell subpopulations in each disease state of each tissue based on the regulon specific score inferred using pySCENIC and by calculating the average expression. |
| Page: 1 2 3 4 5 6 7 |
Top |
Somatic mutation of malignant transformation related genes |
| Annotation of somatic variants for genes involved in malignant transformation |
| Hugo Symbol | Variant Class | Variant Classification | dbSNP RS | HGVSc | HGVSp | HGVSp Short | SWISSPROT | BIOTYPE | SIFT | PolyPhen | Tumor Sample Barcode | Tissue | Histology | Sex | Age | Stage | Therapy Types | Drugs | Outcome |
| VDR | SNV | Missense_Mutation | rs371655308 | c.539G>A | p.Arg180His | p.R180H | P11473 | protein_coding | tolerated(0.3) | benign(0.003) | TCGA-AO-A128-01 | Breast | breast invasive carcinoma | Female | <65 | I/II | Chemotherapy | doxorubicin | SD |
| VDR | insertion | In_Frame_Ins | novel | c.607_608insCAC | p.Phe203delinsSerLeu | p.F203delinsSL | P11473 | protein_coding | TCGA-BH-A0B1-01 | Breast | breast invasive carcinoma | Female | >=65 | I/II | Chemotherapy | adriamycin | SD | ||
| VDR | insertion | Nonsense_Mutation | novel | c.606_607insAGCCAGGCCTAGAACTCCCAGCTCACTGCTGTGT | p.Phe203SerfsTer4 | p.F203Sfs*4 | P11473 | protein_coding | TCGA-BH-A0B1-01 | Breast | breast invasive carcinoma | Female | >=65 | I/II | Chemotherapy | adriamycin | SD | ||
| VDR | SNV | Missense_Mutation | novel | c.1375G>C | p.Glu459Gln | p.E459Q | P11473 | protein_coding | tolerated(0.32) | possibly_damaging(0.843) | TCGA-C5-A8XJ-01 | Cervix | cervical & endocervical cancer | Female | >=65 | I/II | Chemotherapy | cisplatin | SD |
| VDR | SNV | Missense_Mutation | c.468N>A | p.Met156Ile | p.M156I | P11473 | protein_coding | tolerated(0.08) | benign(0.047) | TCGA-EK-A2PM-01 | Cervix | cervical & endocervical cancer | Female | >=65 | I/II | Unknown | Unknown | SD | |
| VDR | SNV | Missense_Mutation | rs753383761 | c.350N>A | p.Arg117His | p.R117H | P11473 | protein_coding | tolerated(0.09) | benign(0.01) | TCGA-5M-AAT6-01 | Colorectum | colon adenocarcinoma | Female | <65 | III/IV | Unknown | Unknown | PD |
| VDR | SNV | Missense_Mutation | c.924N>A | p.Asp308Glu | p.D308E | P11473 | protein_coding | deleterious(0.03) | probably_damaging(0.962) | TCGA-A6-6781-01 | Colorectum | colon adenocarcinoma | Male | <65 | III/IV | Chemotherapy | oxaliplatin | SD | |
| VDR | SNV | Missense_Mutation | rs377423996 | c.1178G>A | p.Arg393His | p.R393H | P11473 | protein_coding | tolerated(0.06) | probably_damaging(0.984) | TCGA-AA-3710-01 | Colorectum | colon adenocarcinoma | Female | >=65 | I/II | Unknown | Unknown | SD |
| VDR | SNV | Missense_Mutation | c.1006N>C | p.Trp336Arg | p.W336R | P11473 | protein_coding | deleterious(0) | probably_damaging(0.988) | TCGA-AZ-6601-01 | Colorectum | colon adenocarcinoma | Male | >=65 | I/II | Unknown | Unknown | PD | |
| VDR | SNV | Missense_Mutation | rs770566299 | c.1258N>T | p.Arg420Cys | p.R420C | P11473 | protein_coding | tolerated(0.05) | probably_damaging(0.939) | TCGA-A5-A0G1-01 | Endometrium | uterine corpus endometrioid carcinoma | Female | >=65 | I/II | Unknown | Unknown | SD |
| Page: 1 2 3 4 5 |
Top |
Related drugs of malignant transformation related genes |
| Identification of chemicals and drugs interact with genes involved in malignant transfromation |
| (DGIdb 4.0) |
| Entrez ID | Symbol | Category | Interaction Types | Drug Claim Name | Drug Name | PMIDs |
| 7421 | VDR | NUCLEAR HORMONE RECEPTOR, DRUGGABLE GENOME, TRANSCRIPTION FACTOR | NIFEKALANT | NIFEKALANT | ||
| 7421 | VDR | NUCLEAR HORMONE RECEPTOR, DRUGGABLE GENOME, TRANSCRIPTION FACTOR | TANSHINONE IIA SULFONATE | TANSHINONE IIA SULFONATE | ||
| 7421 | VDR | NUCLEAR HORMONE RECEPTOR, DRUGGABLE GENOME, TRANSCRIPTION FACTOR | ISOLIQUIRITIGENIN | ISOLIQUIRITIGENIN | ||
| 7421 | VDR | NUCLEAR HORMONE RECEPTOR, DRUGGABLE GENOME, TRANSCRIPTION FACTOR | ISOPRENALINE | ISOPROTERENOL | ||
| 7421 | VDR | NUCLEAR HORMONE RECEPTOR, DRUGGABLE GENOME, TRANSCRIPTION FACTOR | BENSERAZIDE HYDROCHLORIDE | BENSERAZIDE HYDROCHLORIDE | ||
| 7421 | VDR | NUCLEAR HORMONE RECEPTOR, DRUGGABLE GENOME, TRANSCRIPTION FACTOR | SANGUINARIUM | SANGUINARIUM | ||
| 7421 | VDR | NUCLEAR HORMONE RECEPTOR, DRUGGABLE GENOME, TRANSCRIPTION FACTOR | 4-METHOXYDALBERGIONE | 4-METHOXYDALBERGIONE | ||
| 7421 | VDR | NUCLEAR HORMONE RECEPTOR, DRUGGABLE GENOME, TRANSCRIPTION FACTOR | FLUACIZINE | FLUACIZINE | ||
| 7421 | VDR | NUCLEAR HORMONE RECEPTOR, DRUGGABLE GENOME, TRANSCRIPTION FACTOR | ANTIOXIDANT | 16817236 | ||
| 7421 | VDR | NUCLEAR HORMONE RECEPTOR, DRUGGABLE GENOME, TRANSCRIPTION FACTOR | vitamin d and analogues | 21651652,15295697,15861036,15739035,17763859,20716226,20500803,15864137,19647104 |
| Page: 1 2 3 4 5 6 7 8 9 10 11 12 13 14 15 16 17 18 19 20 21 22 23 24 25 26 27 28 29 30 31 32 33 34 35 36 37 38 39 40 41 42 43 44 45 46 47 48 49 50 51 52 53 54 55 |

Copyright 2023-Present -The University of Texas Health Science Center at Houston |