
|
|||||
|
 | |
| |
| |
| |
| |
| |
|
Gene: VDAC3 |
Gene summary for VDAC3 |
| Gene information | Species | Human | Gene symbol | VDAC3 | Gene ID | 7419 |
| Gene name | voltage dependent anion channel 3 | |
| Gene Alias | HD-VDAC3 | |
| Cytomap | 8p11.21 | |
| Gene Type | protein-coding | GO ID | GO:0006810 | UniProtAcc | Q9Y277 |
Top |
Malignant transformation analysis |
| Identification of the aberrant gene expression in precancerous and cancerous lesions by comparing the gene expression of stem-like cells in diseased tissues with normal stem cells |
| Entrez ID | Symbol | Replicates | Species | Organ | Tissue | Adj P-value | Log2FC | Malignancy |
| 7419 | VDAC3 | HTA11_3410_2000001011 | Human | Colorectum | AD | 2.95e-05 | 1.93e-01 | 0.0155 |
| 7419 | VDAC3 | HTA11_2487_2000001011 | Human | Colorectum | SER | 1.47e-03 | 3.71e-01 | -0.1808 |
| 7419 | VDAC3 | HTA11_1938_2000001011 | Human | Colorectum | AD | 4.77e-17 | 6.63e-01 | -0.0811 |
| 7419 | VDAC3 | HTA11_78_2000001011 | Human | Colorectum | AD | 1.44e-24 | 7.99e-01 | -0.1088 |
| 7419 | VDAC3 | HTA11_347_2000001011 | Human | Colorectum | AD | 4.06e-24 | 6.80e-01 | -0.1954 |
| 7419 | VDAC3 | HTA11_411_2000001011 | Human | Colorectum | SER | 4.06e-02 | 5.62e-01 | -0.2602 |
| 7419 | VDAC3 | HTA11_83_2000001011 | Human | Colorectum | SER | 6.79e-09 | 5.12e-01 | -0.1526 |
| 7419 | VDAC3 | HTA11_696_2000001011 | Human | Colorectum | AD | 4.95e-05 | 3.30e-01 | -0.1464 |
| 7419 | VDAC3 | HTA11_1391_2000001011 | Human | Colorectum | AD | 1.55e-08 | 4.04e-01 | -0.059 |
| 7419 | VDAC3 | HTA11_5212_2000001011 | Human | Colorectum | AD | 7.35e-03 | 5.48e-01 | -0.2061 |
| 7419 | VDAC3 | HTA11_5216_2000001011 | Human | Colorectum | SER | 8.44e-03 | 5.94e-01 | -0.1462 |
| 7419 | VDAC3 | HTA11_546_2000001011 | Human | Colorectum | AD | 8.94e-05 | 3.83e-01 | -0.0842 |
| 7419 | VDAC3 | HTA11_7862_2000001011 | Human | Colorectum | AD | 3.52e-04 | 4.15e-01 | -0.0179 |
| 7419 | VDAC3 | HTA11_866_3004761011 | Human | Colorectum | AD | 1.37e-04 | 2.65e-01 | 0.096 |
| 7419 | VDAC3 | HTA11_4255_2000001011 | Human | Colorectum | SER | 4.00e-04 | 4.46e-01 | 0.0446 |
| 7419 | VDAC3 | HTA11_8622_2000001021 | Human | Colorectum | SER | 3.93e-02 | 3.09e-01 | 0.0528 |
| 7419 | VDAC3 | HTA11_7663_2000001011 | Human | Colorectum | SER | 7.27e-04 | 4.63e-01 | 0.0131 |
| 7419 | VDAC3 | HTA11_10623_2000001011 | Human | Colorectum | AD | 6.48e-09 | 6.39e-01 | -0.0177 |
| 7419 | VDAC3 | HTA11_6801_2000001011 | Human | Colorectum | SER | 4.26e-09 | 7.40e-01 | 0.0171 |
| 7419 | VDAC3 | HTA11_7696_3000711011 | Human | Colorectum | AD | 6.81e-04 | 3.68e-01 | 0.0674 |
| Page: 1 2 3 4 5 6 7 8 |
| Tissue | Expression Dynamics | Abbreviation |
| Colorectum (GSE201348) |  | FAP: Familial adenomatous polyposis |
| CRC: Colorectal cancer | ||
| Colorectum (HTA11) |  | AD: Adenomas |
| SER: Sessile serrated lesions | ||
| MSI-H: Microsatellite-high colorectal cancer | ||
| MSS: Microsatellite stable colorectal cancer | ||
| Esophagus | 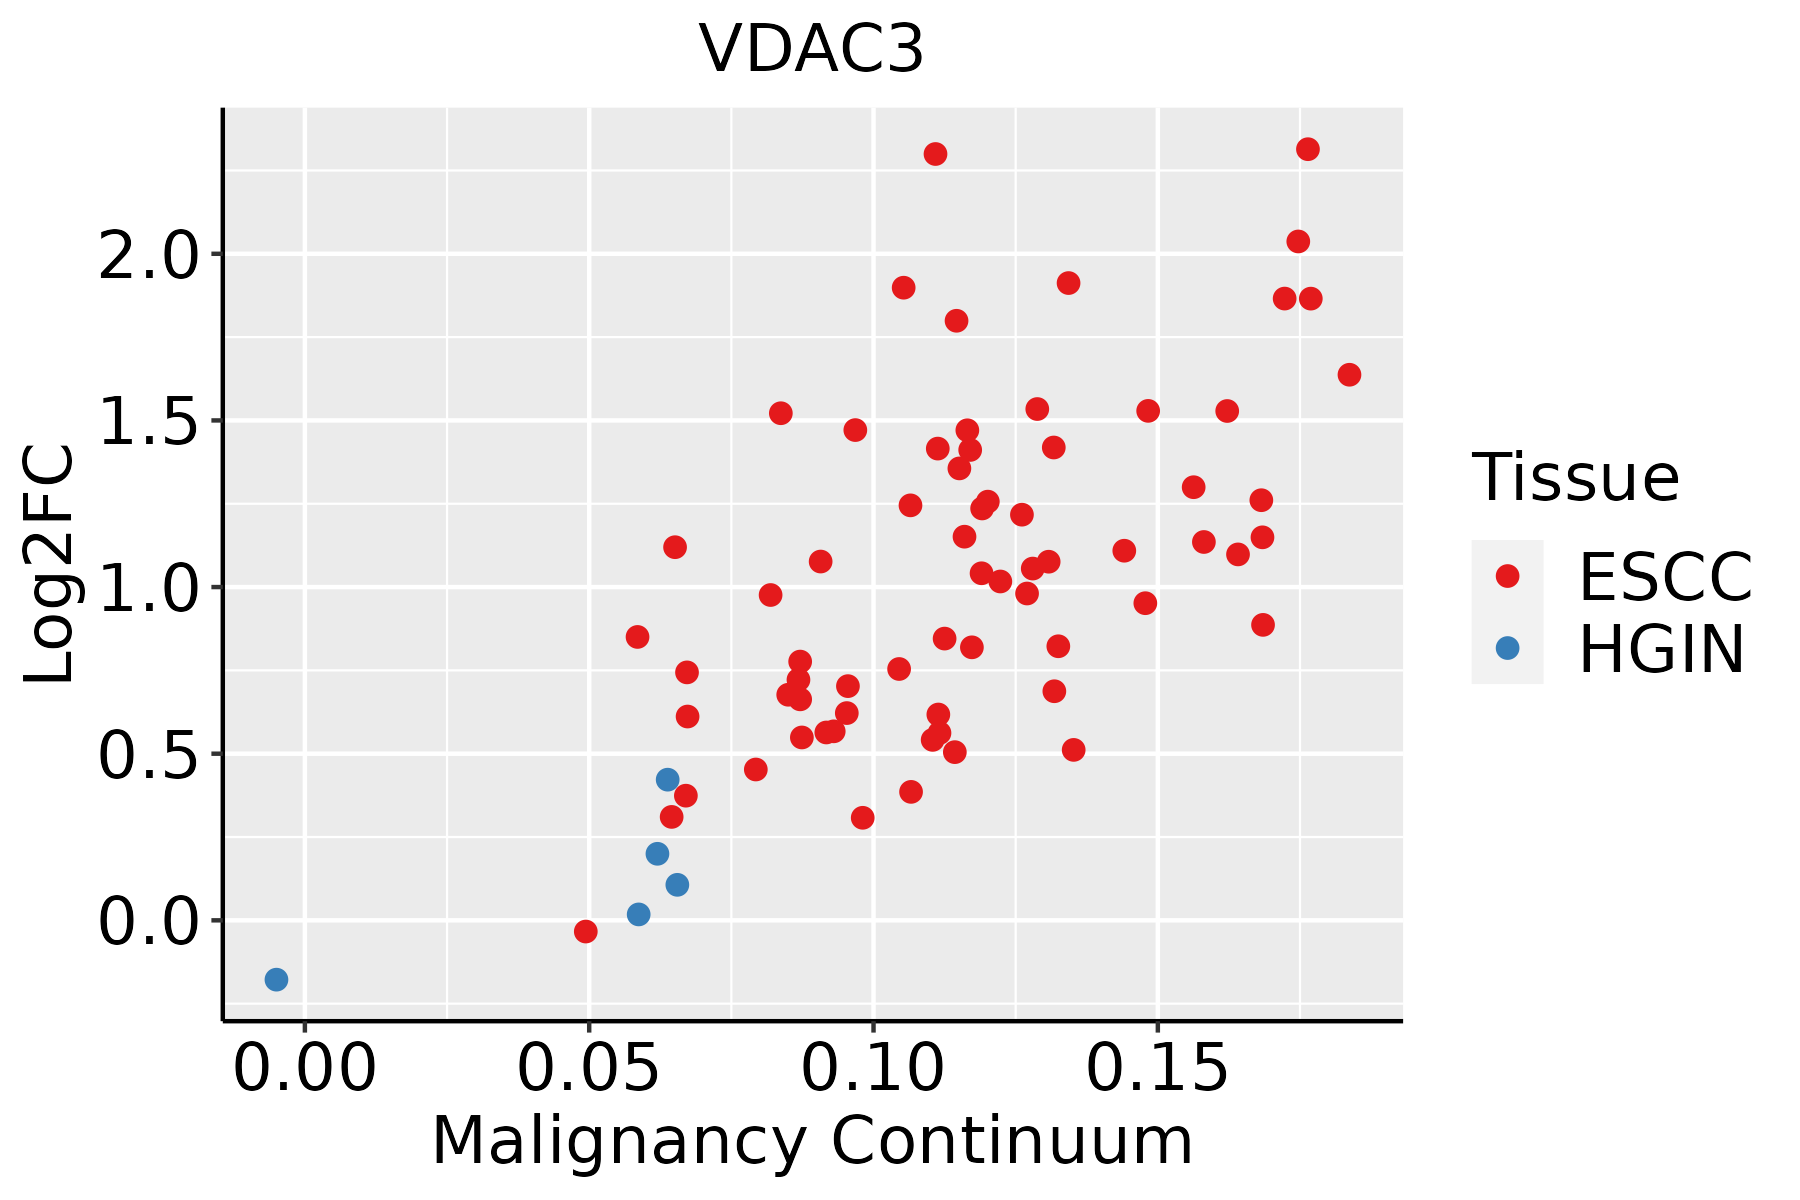 | ESCC: Esophageal squamous cell carcinoma |
| HGIN: High-grade intraepithelial neoplasias | ||
| LGIN: Low-grade intraepithelial neoplasias | ||
| Liver | 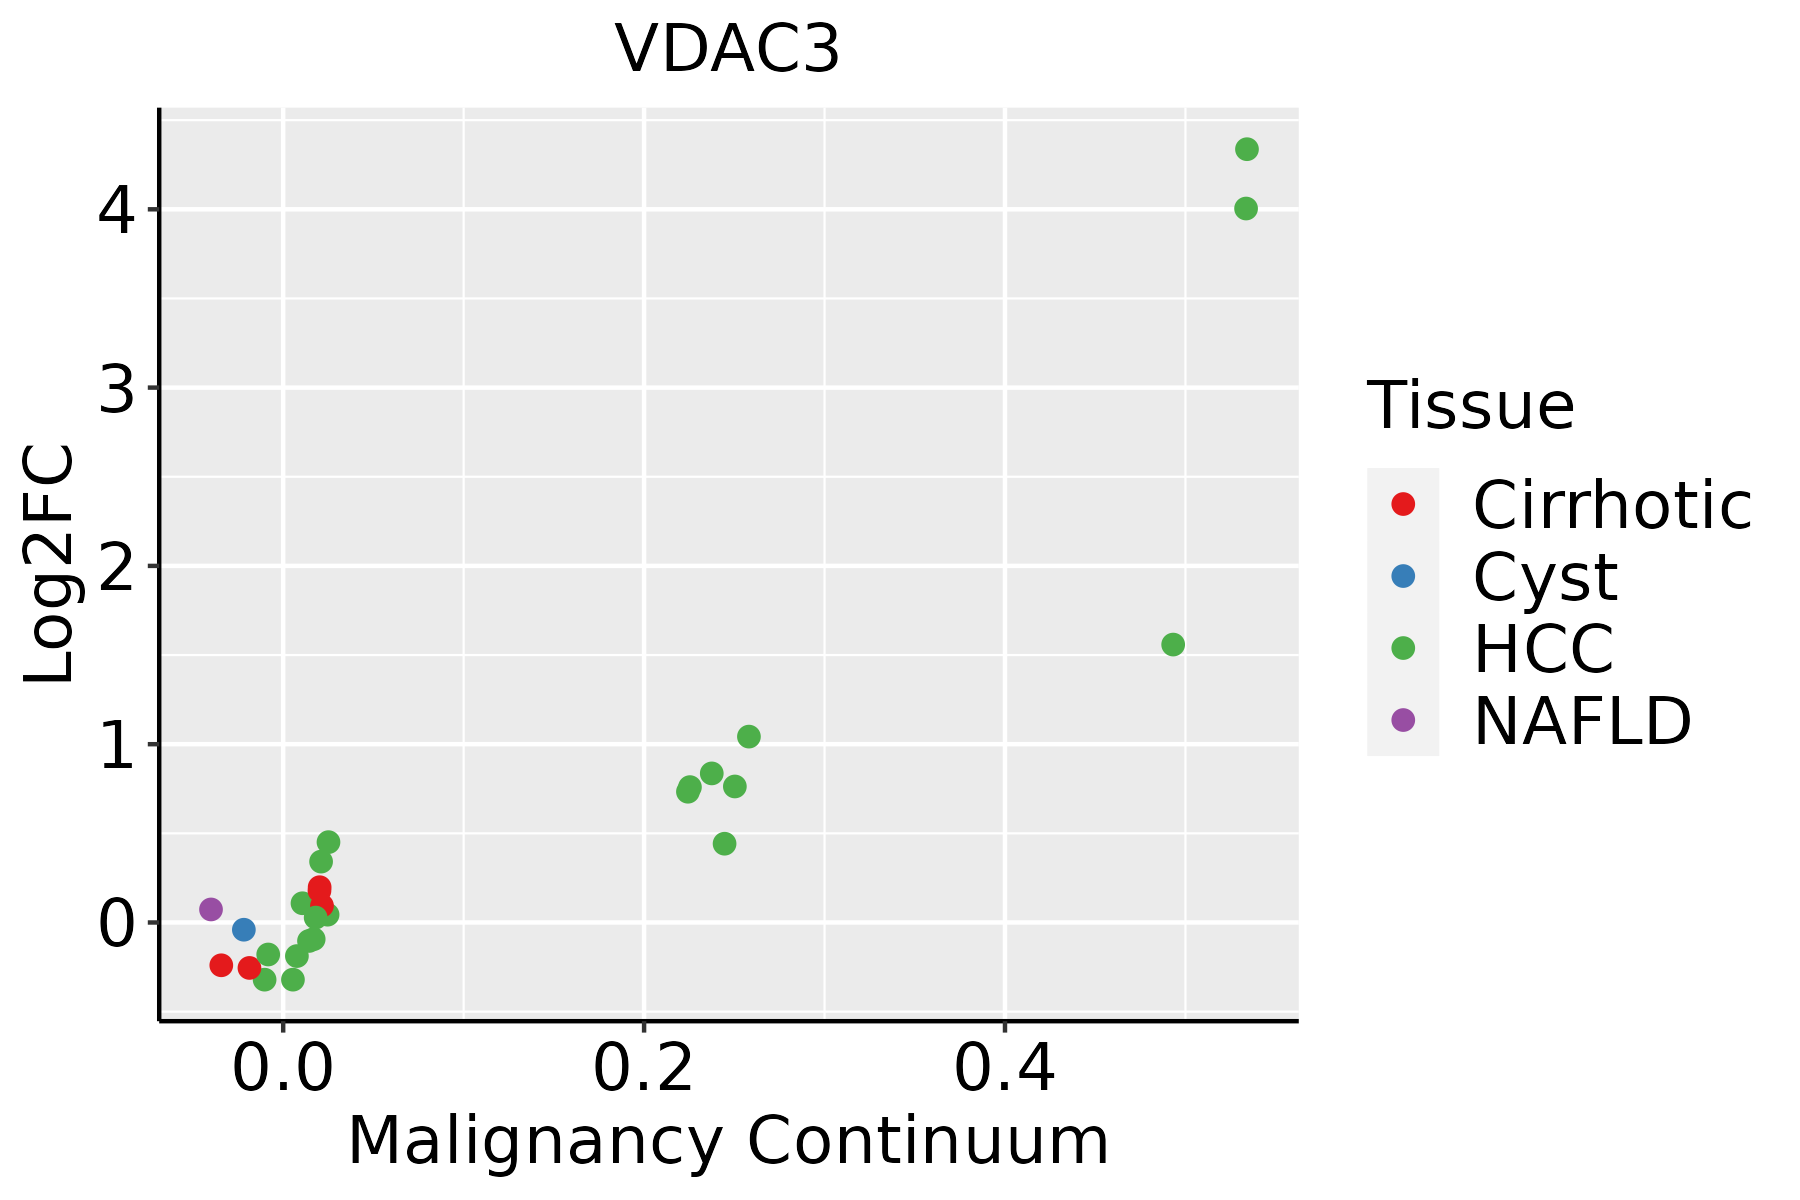 | HCC: Hepatocellular carcinoma |
| NAFLD: Non-alcoholic fatty liver disease | ||
| Oral Cavity | 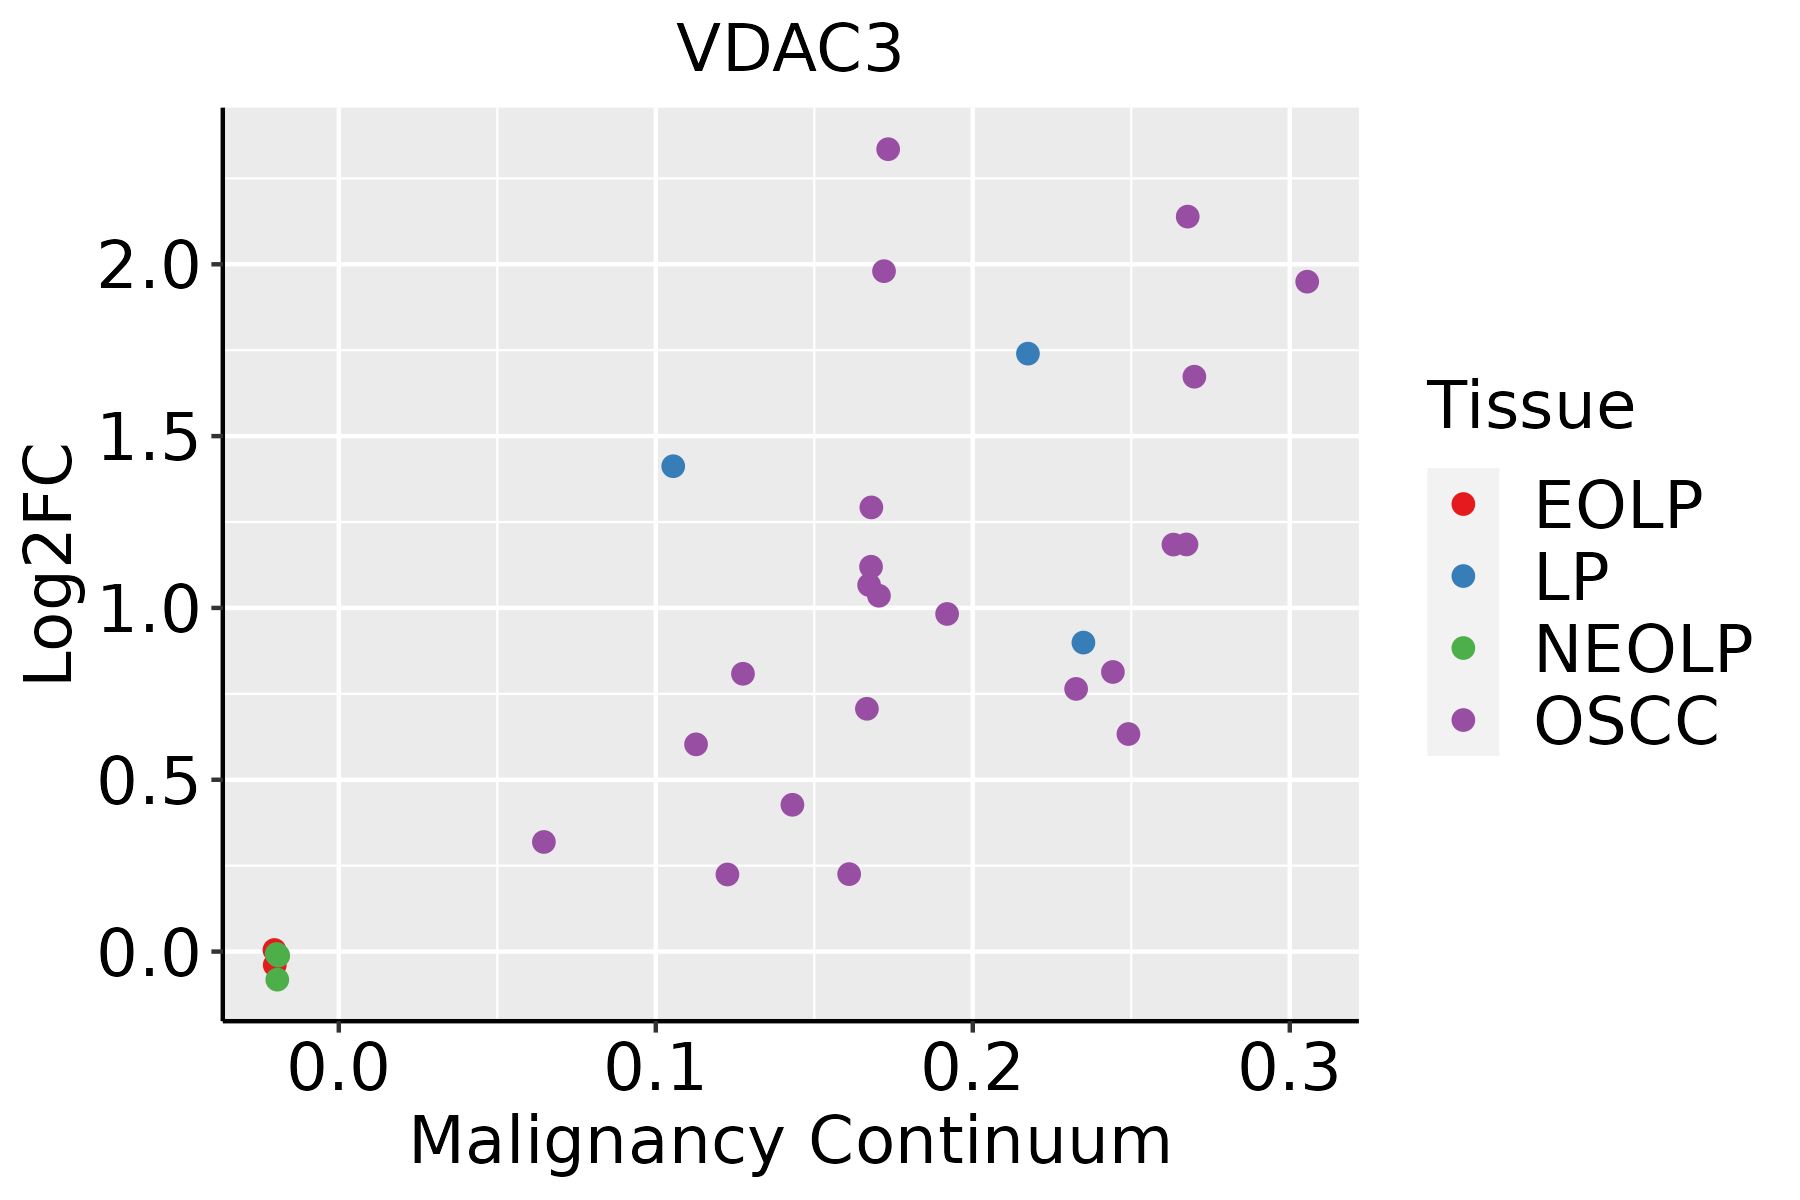 | EOLP: Erosive Oral lichen planus |
| LP: leukoplakia | ||
| NEOLP: Non-erosive oral lichen planus | ||
| OSCC: Oral squamous cell carcinoma | ||
| Skin | 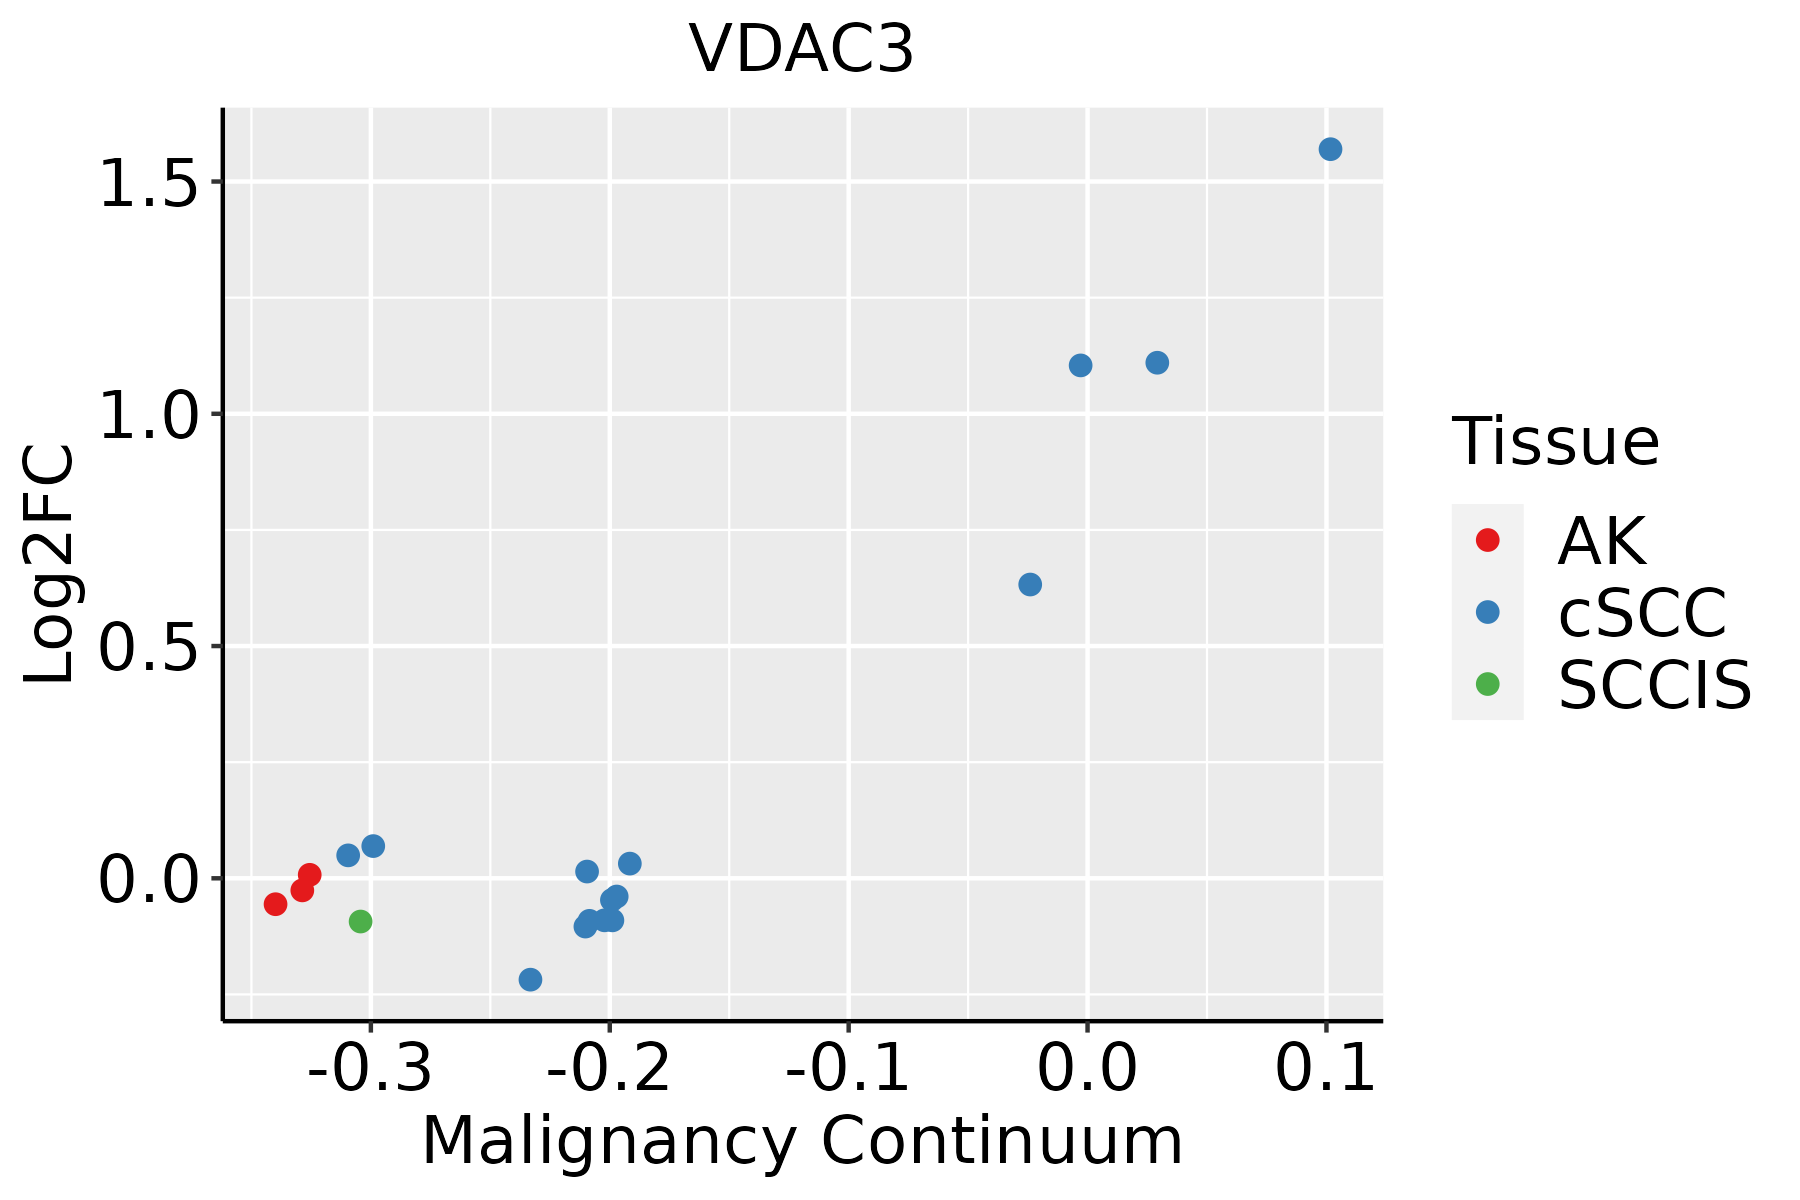 | AK: Actinic keratosis |
| cSCC: Cutaneous squamous cell carcinoma | ||
| SCCIS:squamous cell carcinoma in situ | ||
| Thyroid | 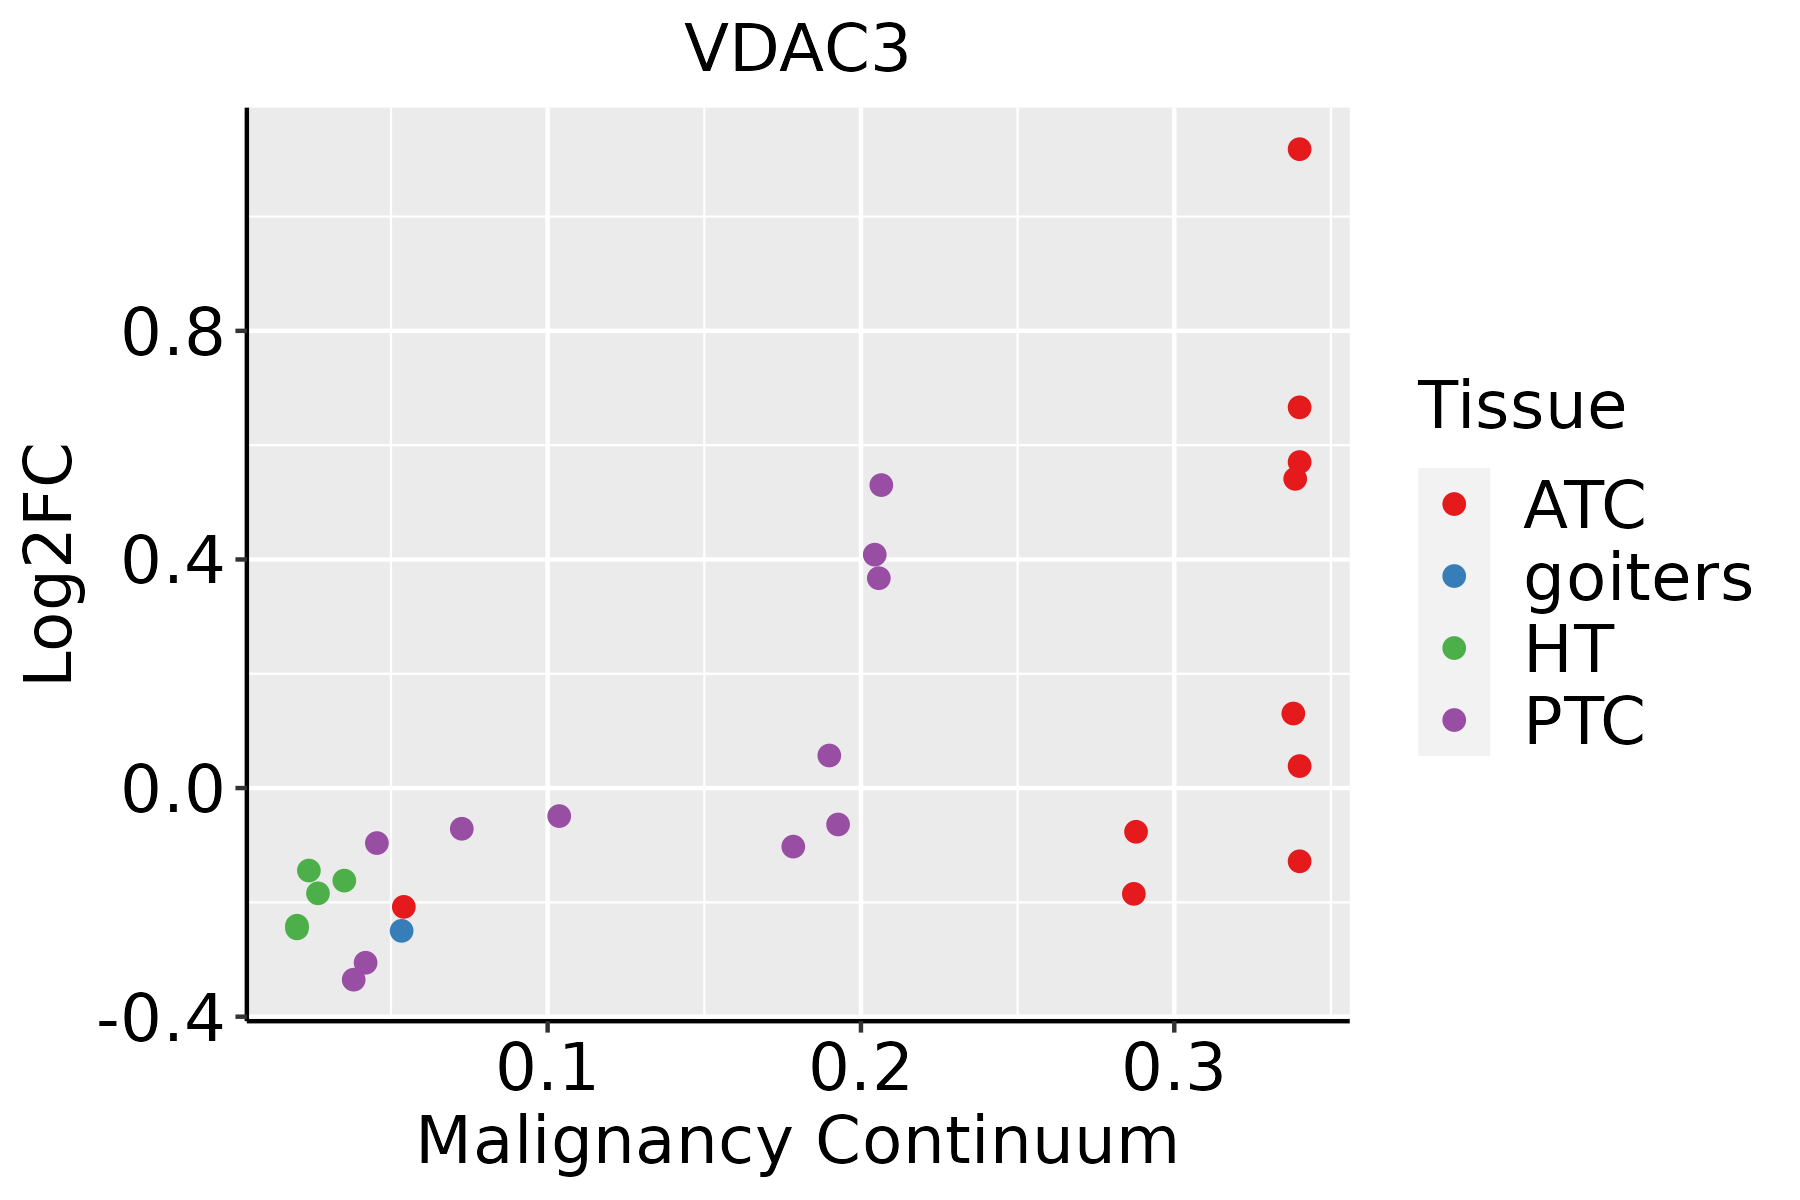 | ATC: Anaplastic thyroid cancer |
| HT: Hashimoto's thyroiditis | ||
| PTC: Papillary thyroid cancer |
| ∗log2FC in expression of this searched gene in stem-like cells from each diseased tissue sample relative to stem-like cells in normal samples in each tissue plotted against the malignancy continuum. Samples are colored based on if they are from different disease stage. |
Top |
Malignant transformation related pathway analysis |
| Find out the enriched GO biological processes and KEGG pathways involved in transition from healthy to precancer to cancer |
| Tissue | Disease Stage | Enriched GO biological Processes |
| Colorectum | AD |  |
| Colorectum | SER |  |
| Colorectum | MSS |  |
| Colorectum | MSI-H |  |
| Colorectum | FAP |  |
| ∗Top 15 enriched GO BP terms are showed in the bar plot of each disease state in each tissue. Each row represents a significant GO biological process which is colored according to the -log10(p.adjust). |
| Page: 1 2 3 4 5 6 7 8 9 |
| GO ID | Tissue | Disease Stage | Description | Gene Ratio | Bg Ratio | pvalue | p.adjust | Count |
| GO:0015698 | Colorectum | AD | inorganic anion transport | 52/3918 | 180/18723 | 6.83e-03 | 4.22e-02 | 52 |
| GO:0120032 | Colorectum | AD | regulation of plasma membrane bounded cell projection assembly | 53/3918 | 186/18723 | 8.51e-03 | 4.97e-02 | 53 |
| GO:01200321 | Colorectum | SER | regulation of plasma membrane bounded cell projection assembly | 43/2897 | 186/18723 | 3.82e-03 | 3.16e-02 | 43 |
| GO:0060491 | Colorectum | SER | regulation of cell projection assembly | 43/2897 | 188/18723 | 4.68e-03 | 3.70e-02 | 43 |
| GO:01200322 | Colorectum | MSS | regulation of plasma membrane bounded cell projection assembly | 51/3467 | 186/18723 | 1.78e-03 | 1.58e-02 | 51 |
| GO:00604911 | Colorectum | MSS | regulation of cell projection assembly | 51/3467 | 188/18723 | 2.28e-03 | 1.87e-02 | 51 |
| GO:00156981 | Colorectum | FAP | inorganic anion transport | 38/2622 | 180/18723 | 5.73e-03 | 3.67e-02 | 38 |
| GO:01200323 | Colorectum | FAP | regulation of plasma membrane bounded cell projection assembly | 39/2622 | 186/18723 | 5.84e-03 | 3.73e-02 | 39 |
| GO:00604912 | Colorectum | FAP | regulation of cell projection assembly | 39/2622 | 188/18723 | 7.01e-03 | 4.29e-02 | 39 |
| GO:190211514 | Esophagus | ESCC | regulation of organelle assembly | 116/8552 | 186/18723 | 3.15e-06 | 3.53e-05 | 116 |
| GO:006049118 | Esophagus | ESCC | regulation of cell projection assembly | 110/8552 | 188/18723 | 2.60e-04 | 1.58e-03 | 110 |
| GO:012003218 | Esophagus | ESCC | regulation of plasma membrane bounded cell projection assembly | 108/8552 | 186/18723 | 4.37e-04 | 2.46e-03 | 108 |
| GO:1902115 | Liver | Cirrhotic | regulation of organelle assembly | 66/4634 | 186/18723 | 6.66e-04 | 5.04e-03 | 66 |
| GO:01200326 | Liver | Cirrhotic | regulation of plasma membrane bounded cell projection assembly | 63/4634 | 186/18723 | 3.16e-03 | 1.78e-02 | 63 |
| GO:00604915 | Liver | Cirrhotic | regulation of cell projection assembly | 63/4634 | 188/18723 | 4.17e-03 | 2.22e-02 | 63 |
| GO:19021151 | Liver | HCC | regulation of organelle assembly | 110/7958 | 186/18723 | 3.30e-06 | 4.34e-05 | 110 |
| GO:006049112 | Liver | HCC | regulation of cell projection assembly | 101/7958 | 188/18723 | 1.20e-03 | 6.69e-03 | 101 |
| GO:012003212 | Liver | HCC | regulation of plasma membrane bounded cell projection assembly | 100/7958 | 186/18723 | 1.23e-03 | 6.81e-03 | 100 |
| GO:19021155 | Oral cavity | OSCC | regulation of organelle assembly | 109/7305 | 186/18723 | 4.54e-08 | 8.45e-07 | 109 |
| GO:006049110 | Oral cavity | OSCC | regulation of cell projection assembly | 100/7305 | 188/18723 | 5.27e-05 | 4.38e-04 | 100 |
| Page: 1 2 |
| Pathway ID | Tissue | Disease Stage | Description | Gene Ratio | Bg Ratio | pvalue | p.adjust | qvalue | Count |
| hsa05012 | Colorectum | AD | Parkinson disease | 147/2092 | 266/8465 | 2.53e-27 | 8.48e-25 | 5.41e-25 | 147 |
| hsa05208 | Colorectum | AD | Chemical carcinogenesis - reactive oxygen species | 126/2092 | 223/8465 | 1.01e-24 | 1.68e-22 | 1.07e-22 | 126 |
| hsa05415 | Colorectum | AD | Diabetic cardiomyopathy | 114/2092 | 203/8465 | 3.65e-22 | 3.06e-20 | 1.95e-20 | 114 |
| hsa05010 | Colorectum | AD | Alzheimer disease | 174/2092 | 384/8465 | 1.82e-19 | 9.26e-18 | 5.91e-18 | 174 |
| hsa05016 | Colorectum | AD | Huntington disease | 147/2092 | 306/8465 | 1.93e-19 | 9.26e-18 | 5.91e-18 | 147 |
| hsa05020 | Colorectum | AD | Prion disease | 133/2092 | 273/8465 | 2.47e-18 | 8.29e-17 | 5.29e-17 | 133 |
| hsa05022 | Colorectum | AD | Pathways of neurodegeneration - multiple diseases | 201/2092 | 476/8465 | 4.54e-18 | 1.27e-16 | 8.09e-17 | 201 |
| hsa05017 | Colorectum | AD | Spinocerebellar ataxia | 60/2092 | 143/8465 | 3.78e-06 | 4.35e-05 | 2.78e-05 | 60 |
| hsa04216 | Colorectum | AD | Ferroptosis | 21/2092 | 41/8465 | 2.23e-04 | 1.78e-03 | 1.13e-03 | 21 |
| hsa05166 | Colorectum | AD | Human T-cell leukemia virus 1 infection | 72/2092 | 222/8465 | 5.24e-03 | 2.44e-02 | 1.55e-02 | 72 |
| hsa04218 | Colorectum | AD | Cellular senescence | 53/2092 | 156/8465 | 5.55e-03 | 2.48e-02 | 1.58e-02 | 53 |
| hsa050121 | Colorectum | AD | Parkinson disease | 147/2092 | 266/8465 | 2.53e-27 | 8.48e-25 | 5.41e-25 | 147 |
| hsa052081 | Colorectum | AD | Chemical carcinogenesis - reactive oxygen species | 126/2092 | 223/8465 | 1.01e-24 | 1.68e-22 | 1.07e-22 | 126 |
| hsa054151 | Colorectum | AD | Diabetic cardiomyopathy | 114/2092 | 203/8465 | 3.65e-22 | 3.06e-20 | 1.95e-20 | 114 |
| hsa050101 | Colorectum | AD | Alzheimer disease | 174/2092 | 384/8465 | 1.82e-19 | 9.26e-18 | 5.91e-18 | 174 |
| hsa050161 | Colorectum | AD | Huntington disease | 147/2092 | 306/8465 | 1.93e-19 | 9.26e-18 | 5.91e-18 | 147 |
| hsa050201 | Colorectum | AD | Prion disease | 133/2092 | 273/8465 | 2.47e-18 | 8.29e-17 | 5.29e-17 | 133 |
| hsa050221 | Colorectum | AD | Pathways of neurodegeneration - multiple diseases | 201/2092 | 476/8465 | 4.54e-18 | 1.27e-16 | 8.09e-17 | 201 |
| hsa050171 | Colorectum | AD | Spinocerebellar ataxia | 60/2092 | 143/8465 | 3.78e-06 | 4.35e-05 | 2.78e-05 | 60 |
| hsa042161 | Colorectum | AD | Ferroptosis | 21/2092 | 41/8465 | 2.23e-04 | 1.78e-03 | 1.13e-03 | 21 |
| Page: 1 2 3 4 5 6 7 8 9 10 11 12 |
Top |
Cell-cell communication analysis |
| Identification of potential cell-cell interactions between two cell types and their ligand-receptor pairs for different disease states |
| Ligand | Receptor | LRpair | Pathway | Tissue | Disease Stage |
| Page: 1 |
Top |
Single-cell gene regulatory network inference analysis |
| Find out the significant the regulons (TFs) and the target genes of each regulon across cell types for different disease states |
| TF | Cell Type | Tissue | Disease Stage | Target Gene | RSS | Regulon Activity |
| ∗The dot plots of a searched regulon are shown for all cell subpopulations in each disease state of each tissue based on the regulon specific score inferred using pySCENIC and by calculating the average expression. |
| Page: 1 |
Top |
Somatic mutation of malignant transformation related genes |
| Annotation of somatic variants for genes involved in malignant transformation |
| Hugo Symbol | Variant Class | Variant Classification | dbSNP RS | HGVSc | HGVSp | HGVSp Short | SWISSPROT | BIOTYPE | SIFT | PolyPhen | Tumor Sample Barcode | Tissue | Histology | Sex | Age | Stage | Therapy Types | Drugs | Outcome |
| VDAC3 | SNV | Missense_Mutation | rs551923370 | c.353N>T | p.Ser118Phe | p.S118F | Q9Y277 | protein_coding | deleterious(0.01) | possibly_damaging(0.66) | TCGA-AR-A5QP-01 | Breast | breast invasive carcinoma | Female | <65 | I/II | Hormone Therapy | tamoxiphen | SD |
| VDAC3 | SNV | Missense_Mutation | rs752791425 | c.511N>A | p.Ala171Thr | p.A171T | Q9Y277 | protein_coding | tolerated(0.07) | benign(0.02) | TCGA-A6-5665-01 | Colorectum | colon adenocarcinoma | Female | >=65 | I/II | Unknown | Unknown | PD |
| VDAC3 | SNV | Missense_Mutation | c.673N>G | p.Lys225Glu | p.K225E | Q9Y277 | protein_coding | deleterious(0) | possibly_damaging(0.551) | TCGA-AA-3941-01 | Colorectum | colon adenocarcinoma | Female | >=65 | I/II | Unknown | Unknown | SD | |
| VDAC3 | SNV | Missense_Mutation | novel | c.104N>A | p.Ser35Tyr | p.S35Y | Q9Y277 | protein_coding | deleterious(0.03) | benign(0.015) | TCGA-A5-A0G1-01 | Endometrium | uterine corpus endometrioid carcinoma | Female | >=65 | I/II | Unknown | Unknown | SD |
| VDAC3 | SNV | Missense_Mutation | novel | c.170N>A | p.Gly57Asp | p.G57D | Q9Y277 | protein_coding | deleterious(0.02) | probably_damaging(0.999) | TCGA-A5-A0G1-01 | Endometrium | uterine corpus endometrioid carcinoma | Female | >=65 | I/II | Unknown | Unknown | SD |
| VDAC3 | SNV | Missense_Mutation | novel | c.104N>A | p.Ser35Tyr | p.S35Y | Q9Y277 | protein_coding | deleterious(0.03) | benign(0.015) | TCGA-A5-A0GG-01 | Endometrium | uterine corpus endometrioid carcinoma | Female | >=65 | I/II | Unknown | Unknown | SD |
| VDAC3 | SNV | Missense_Mutation | novel | c.391N>A | p.Asp131Asn | p.D131N | Q9Y277 | protein_coding | tolerated(0.08) | possibly_damaging(0.635) | TCGA-A5-A2K7-01 | Endometrium | uterine corpus endometrioid carcinoma | Female | <65 | I/II | Chemotherapy | taxol | SD |
| VDAC3 | SNV | Missense_Mutation | rs775234791 | c.442N>A | p.Glu148Lys | p.E148K | Q9Y277 | protein_coding | tolerated(0.25) | benign(0.175) | TCGA-B5-A11N-01 | Endometrium | uterine corpus endometrioid carcinoma | Female | >=65 | I/II | Unknown | Unknown | SD |
| VDAC3 | SNV | Missense_Mutation | novel | c.104C>A | p.Ser35Tyr | p.S35Y | Q9Y277 | protein_coding | deleterious(0.03) | benign(0.015) | TCGA-EO-A3AV-01 | Endometrium | uterine corpus endometrioid carcinoma | Female | <65 | III/IV | Chemotherapy | carboplatin | CR |
| VDAC3 | SNV | Missense_Mutation | novel | c.485N>C | p.Lys162Thr | p.K162T | Q9Y277 | protein_coding | deleterious(0.01) | possibly_damaging(0.769) | TCGA-EO-A3AY-01 | Endometrium | uterine corpus endometrioid carcinoma | Female | <65 | I/II | Unknown | Unknown | PD |
| Page: 1 2 3 |
Top |
Related drugs of malignant transformation related genes |
| Identification of chemicals and drugs interact with genes involved in malignant transfromation |
| (DGIdb 4.0) |
| Entrez ID | Symbol | Category | Interaction Types | Drug Claim Name | Drug Name | PMIDs |
| 7419 | VDAC3 | KINASE | OLESOXIME | OLESOXIME | ||
| 7419 | VDAC3 | KINASE | PRLX93936 |
| Page: 1 |

Copyright 2023-Present -The University of Texas Health Science Center at Houston |