
|
|||||
|
 | |
| |
| |
| |
| |
| |
|
Gene: VDAC2 |
Gene summary for VDAC2 |
| Gene information | Species | Human | Gene symbol | VDAC2 | Gene ID | 7417 |
| Gene name | voltage dependent anion channel 2 | |
| Gene Alias | POR | |
| Cytomap | 10q22.2 | |
| Gene Type | protein-coding | GO ID | GO:0000003 | UniProtAcc | P45880 |
Top |
Malignant transformation analysis |
| Identification of the aberrant gene expression in precancerous and cancerous lesions by comparing the gene expression of stem-like cells in diseased tissues with normal stem cells |
| Entrez ID | Symbol | Replicates | Species | Organ | Tissue | Adj P-value | Log2FC | Malignancy |
| 7417 | VDAC2 | GSM4909282 | Human | Breast | IDC | 1.20e-17 | 4.51e-01 | -0.0288 |
| 7417 | VDAC2 | GSM4909285 | Human | Breast | IDC | 7.38e-21 | 5.65e-01 | 0.21 |
| 7417 | VDAC2 | GSM4909287 | Human | Breast | IDC | 2.78e-02 | -1.87e-01 | 0.2057 |
| 7417 | VDAC2 | GSM4909288 | Human | Breast | IDC | 2.87e-02 | -1.26e-01 | 0.0988 |
| 7417 | VDAC2 | GSM4909294 | Human | Breast | IDC | 8.59e-07 | -1.91e-01 | 0.2022 |
| 7417 | VDAC2 | GSM4909295 | Human | Breast | IDC | 1.95e-04 | -4.33e-01 | 0.0898 |
| 7417 | VDAC2 | GSM4909296 | Human | Breast | IDC | 9.62e-14 | -4.67e-02 | 0.1524 |
| 7417 | VDAC2 | GSM4909297 | Human | Breast | IDC | 5.68e-25 | -2.34e-01 | 0.1517 |
| 7417 | VDAC2 | GSM4909301 | Human | Breast | IDC | 8.21e-24 | -5.13e-01 | 0.1577 |
| 7417 | VDAC2 | GSM4909302 | Human | Breast | IDC | 1.22e-03 | -2.34e-01 | 0.1545 |
| 7417 | VDAC2 | GSM4909309 | Human | Breast | IDC | 4.21e-04 | -1.79e-01 | 0.0483 |
| 7417 | VDAC2 | GSM4909311 | Human | Breast | IDC | 4.96e-47 | -5.51e-01 | 0.1534 |
| 7417 | VDAC2 | GSM4909312 | Human | Breast | IDC | 2.65e-18 | 6.76e-02 | 0.1552 |
| 7417 | VDAC2 | GSM4909313 | Human | Breast | IDC | 3.18e-06 | -1.79e-01 | 0.0391 |
| 7417 | VDAC2 | GSM4909315 | Human | Breast | IDC | 2.27e-13 | 3.46e-01 | 0.21 |
| 7417 | VDAC2 | GSM4909316 | Human | Breast | IDC | 2.54e-09 | 2.74e-01 | 0.21 |
| 7417 | VDAC2 | GSM4909318 | Human | Breast | IDC | 4.22e-06 | 3.05e-01 | 0.2031 |
| 7417 | VDAC2 | GSM4909319 | Human | Breast | IDC | 4.10e-66 | -4.58e-01 | 0.1563 |
| 7417 | VDAC2 | GSM4909320 | Human | Breast | IDC | 6.94e-12 | -5.62e-01 | 0.1575 |
| 7417 | VDAC2 | GSM4909321 | Human | Breast | IDC | 2.15e-28 | -9.56e-02 | 0.1559 |
| Page: 1 2 3 4 5 6 7 8 9 10 11 12 13 |
| Tissue | Expression Dynamics | Abbreviation |
| Breast |  | IDC: Invasive ductal carcinoma |
| DCIS: Ductal carcinoma in situ | ||
| Precancer(BRCA1-mut): Precancerous lesion from BRCA1 mutation carriers | ||
| Cervix | 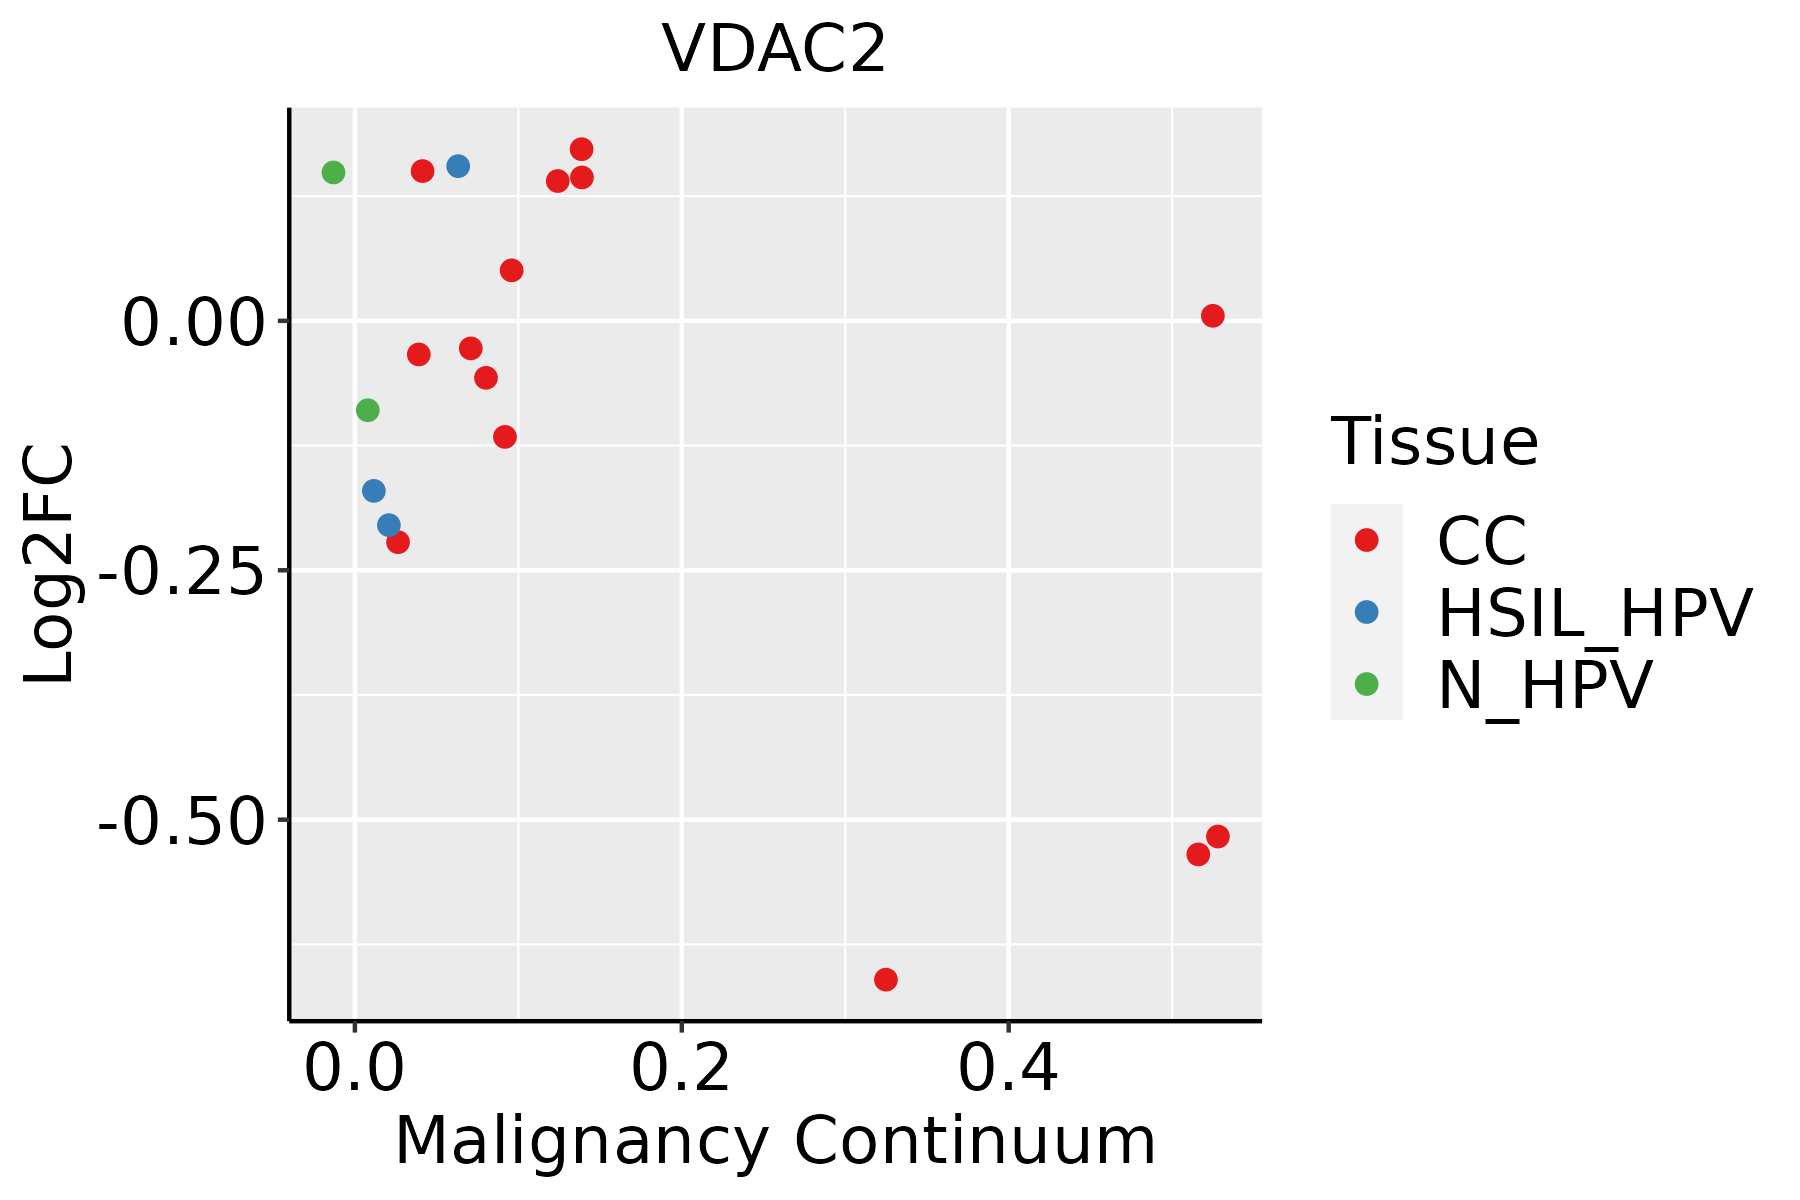 | CC: Cervix cancer |
| HSIL_HPV: HPV-infected high-grade squamous intraepithelial lesions | ||
| N_HPV: HPV-infected normal cervix | ||
| Colorectum (GSE201348) |  | FAP: Familial adenomatous polyposis |
| CRC: Colorectal cancer | ||
| Colorectum (HTA11) | 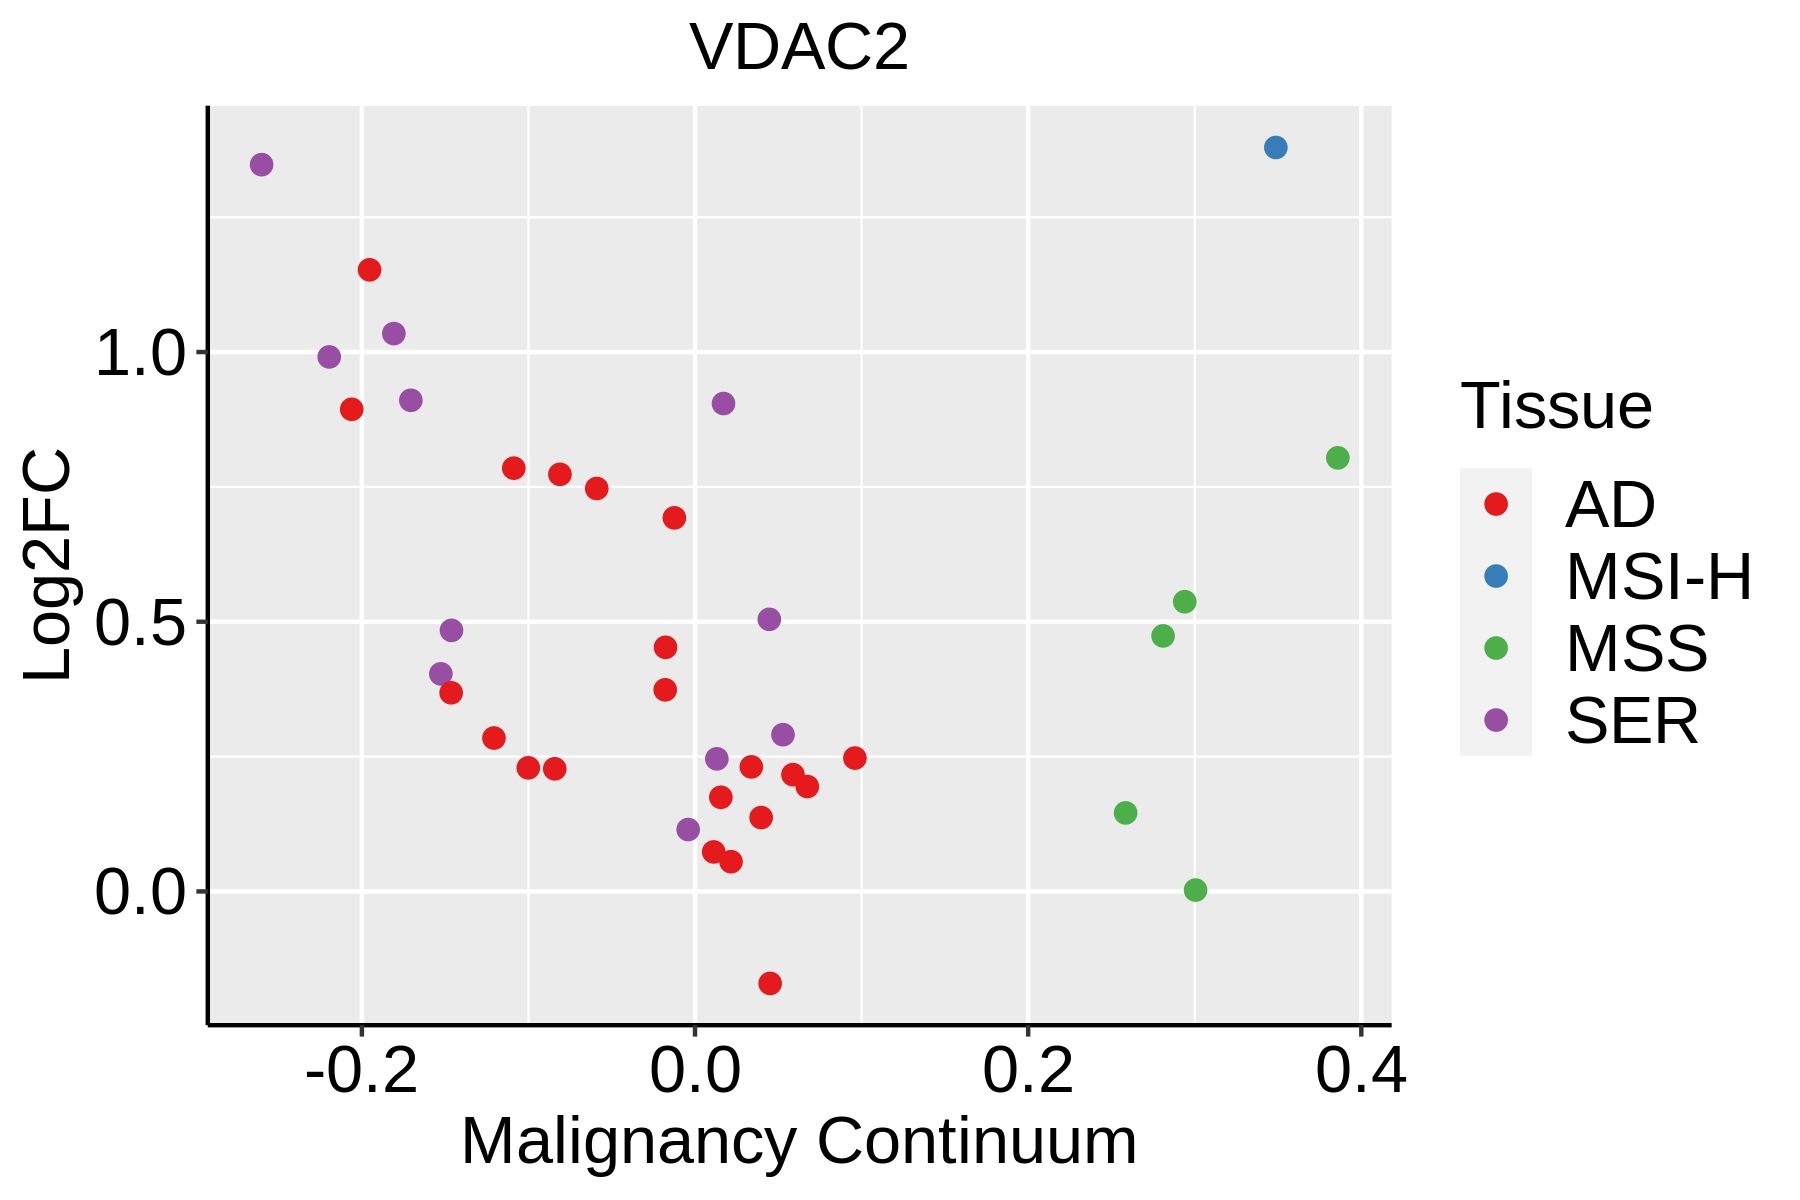 | AD: Adenomas |
| SER: Sessile serrated lesions | ||
| MSI-H: Microsatellite-high colorectal cancer | ||
| MSS: Microsatellite stable colorectal cancer | ||
| Endometrium | 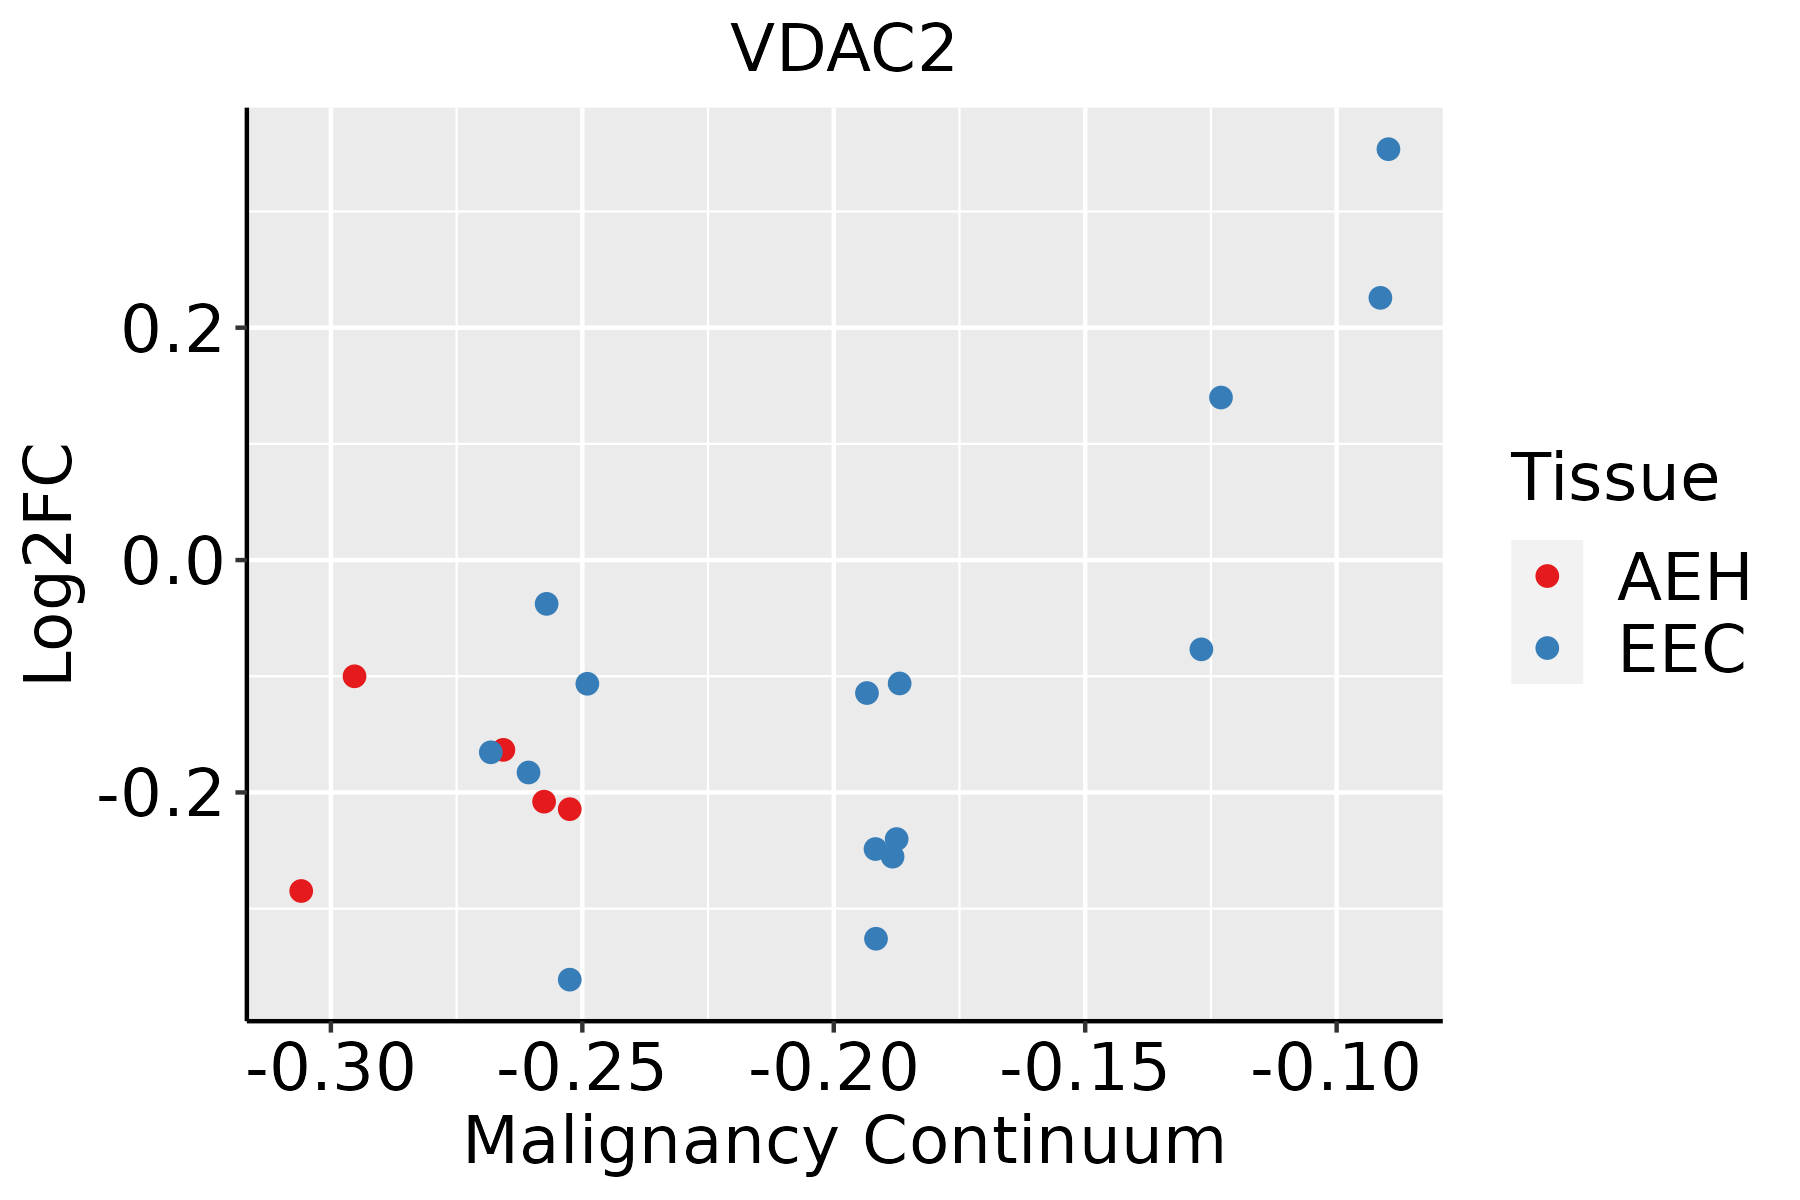 | AEH: Atypical endometrial hyperplasia |
| EEC: Endometrioid Cancer | ||
| Esophagus | 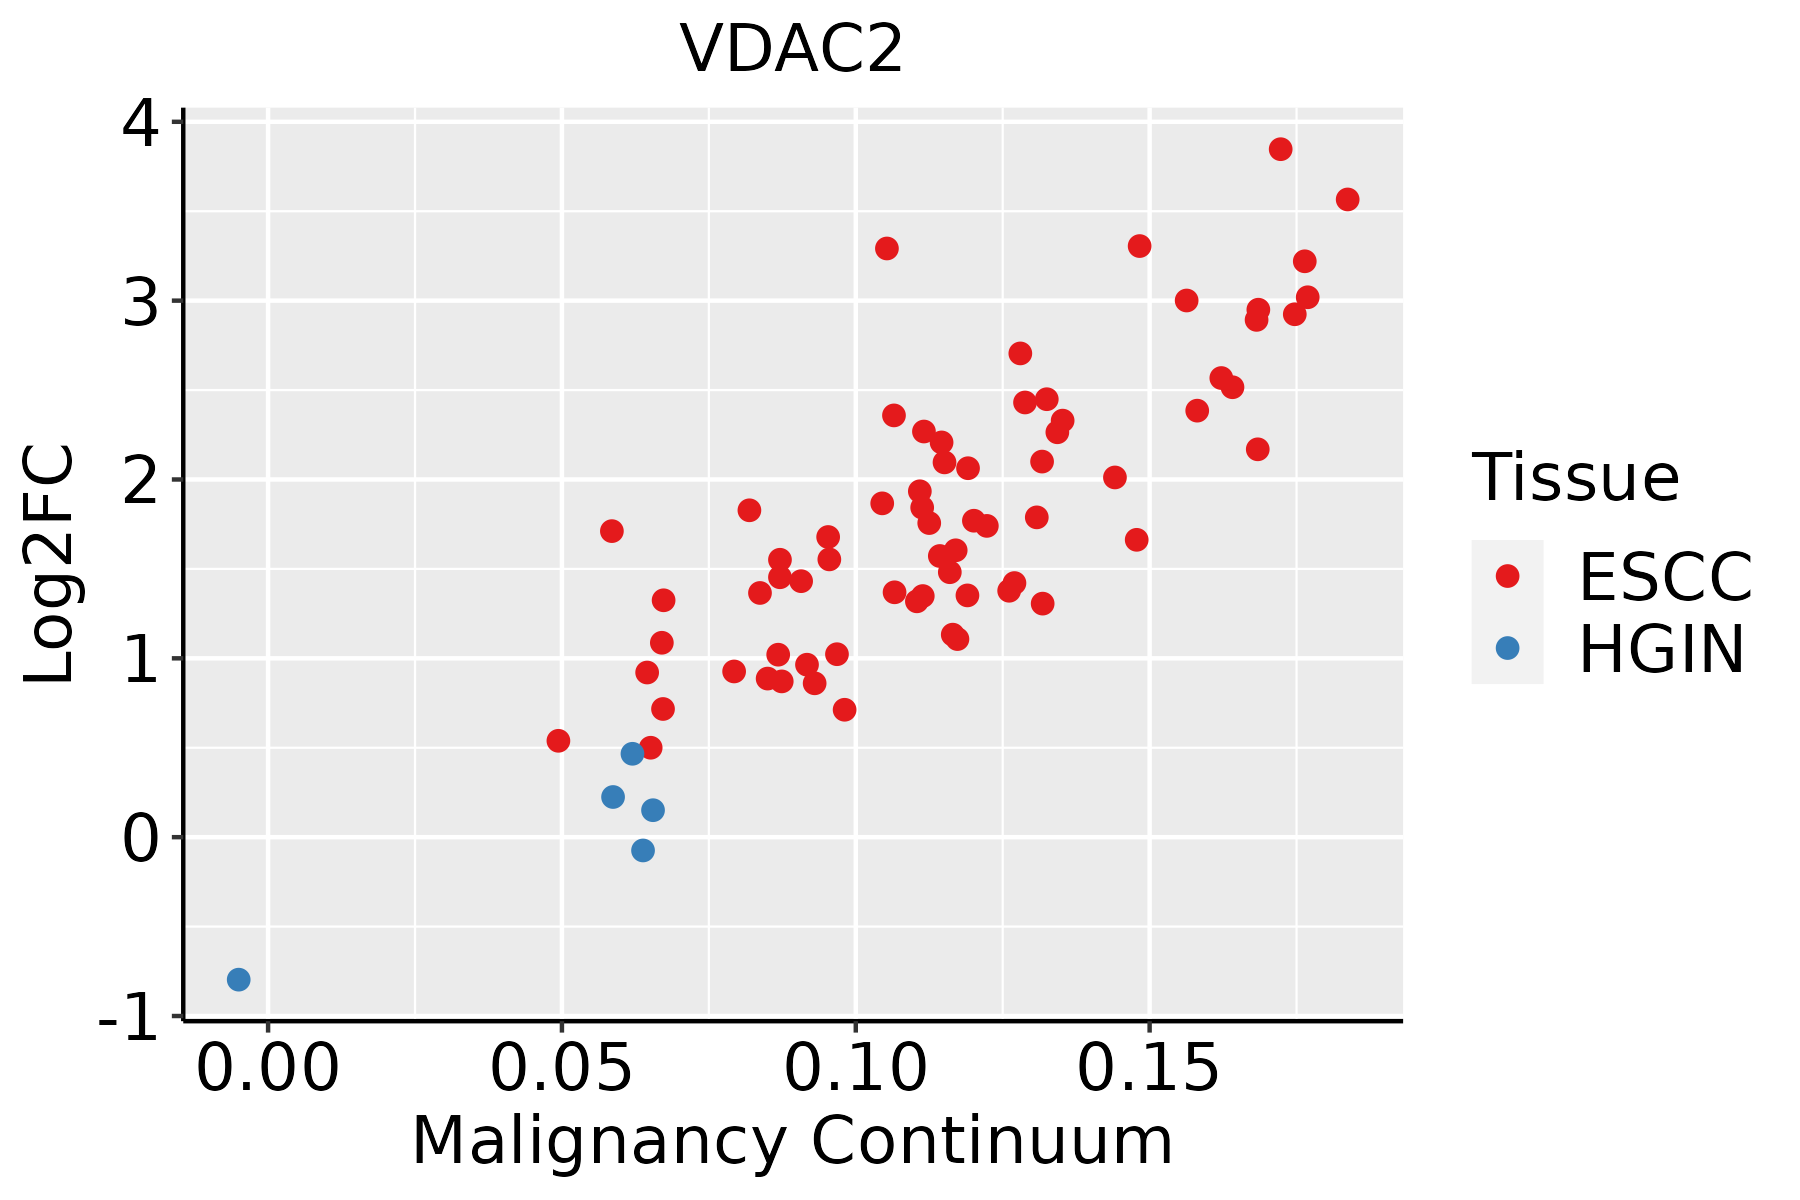 | ESCC: Esophageal squamous cell carcinoma |
| HGIN: High-grade intraepithelial neoplasias | ||
| LGIN: Low-grade intraepithelial neoplasias | ||
| Liver | 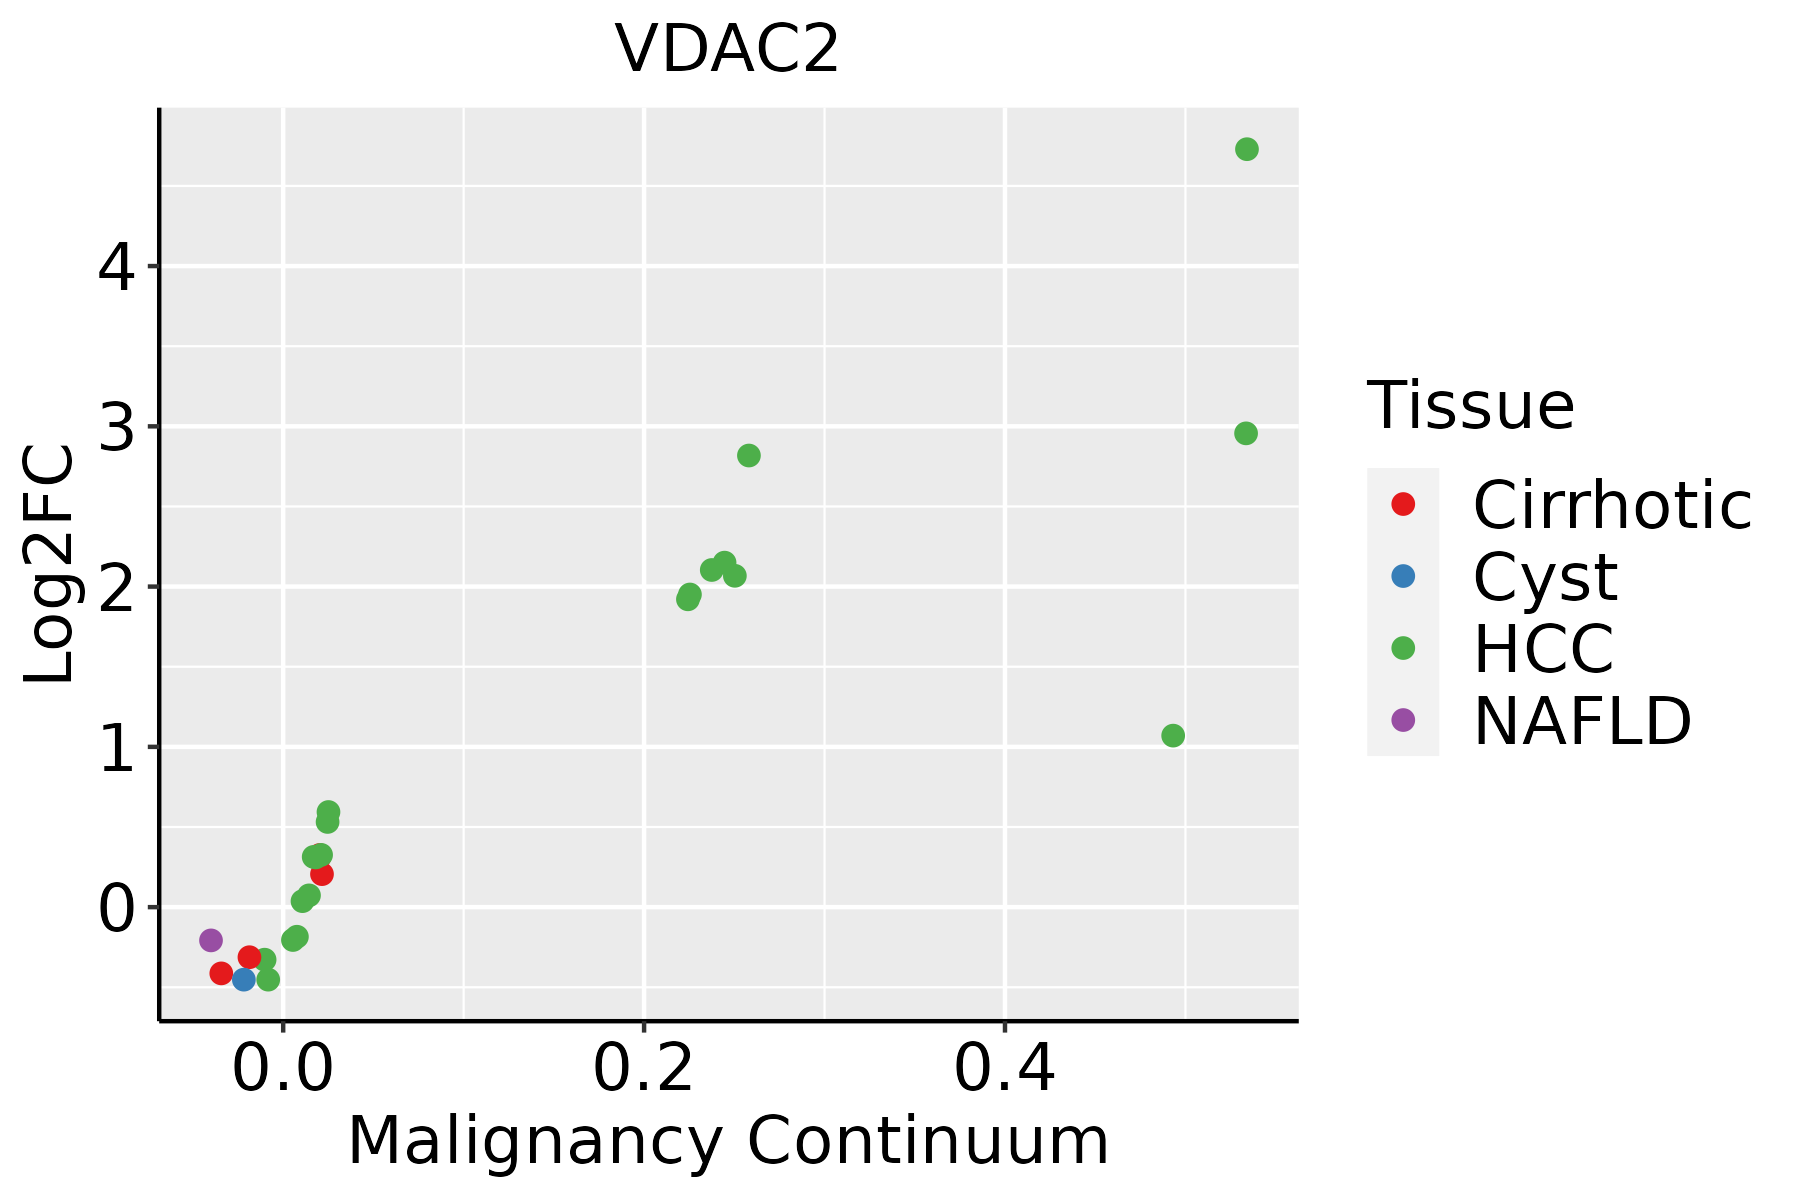 | HCC: Hepatocellular carcinoma |
| NAFLD: Non-alcoholic fatty liver disease | ||
| Oral Cavity |  | EOLP: Erosive Oral lichen planus |
| LP: leukoplakia | ||
| NEOLP: Non-erosive oral lichen planus | ||
| OSCC: Oral squamous cell carcinoma | ||
| Prostate | 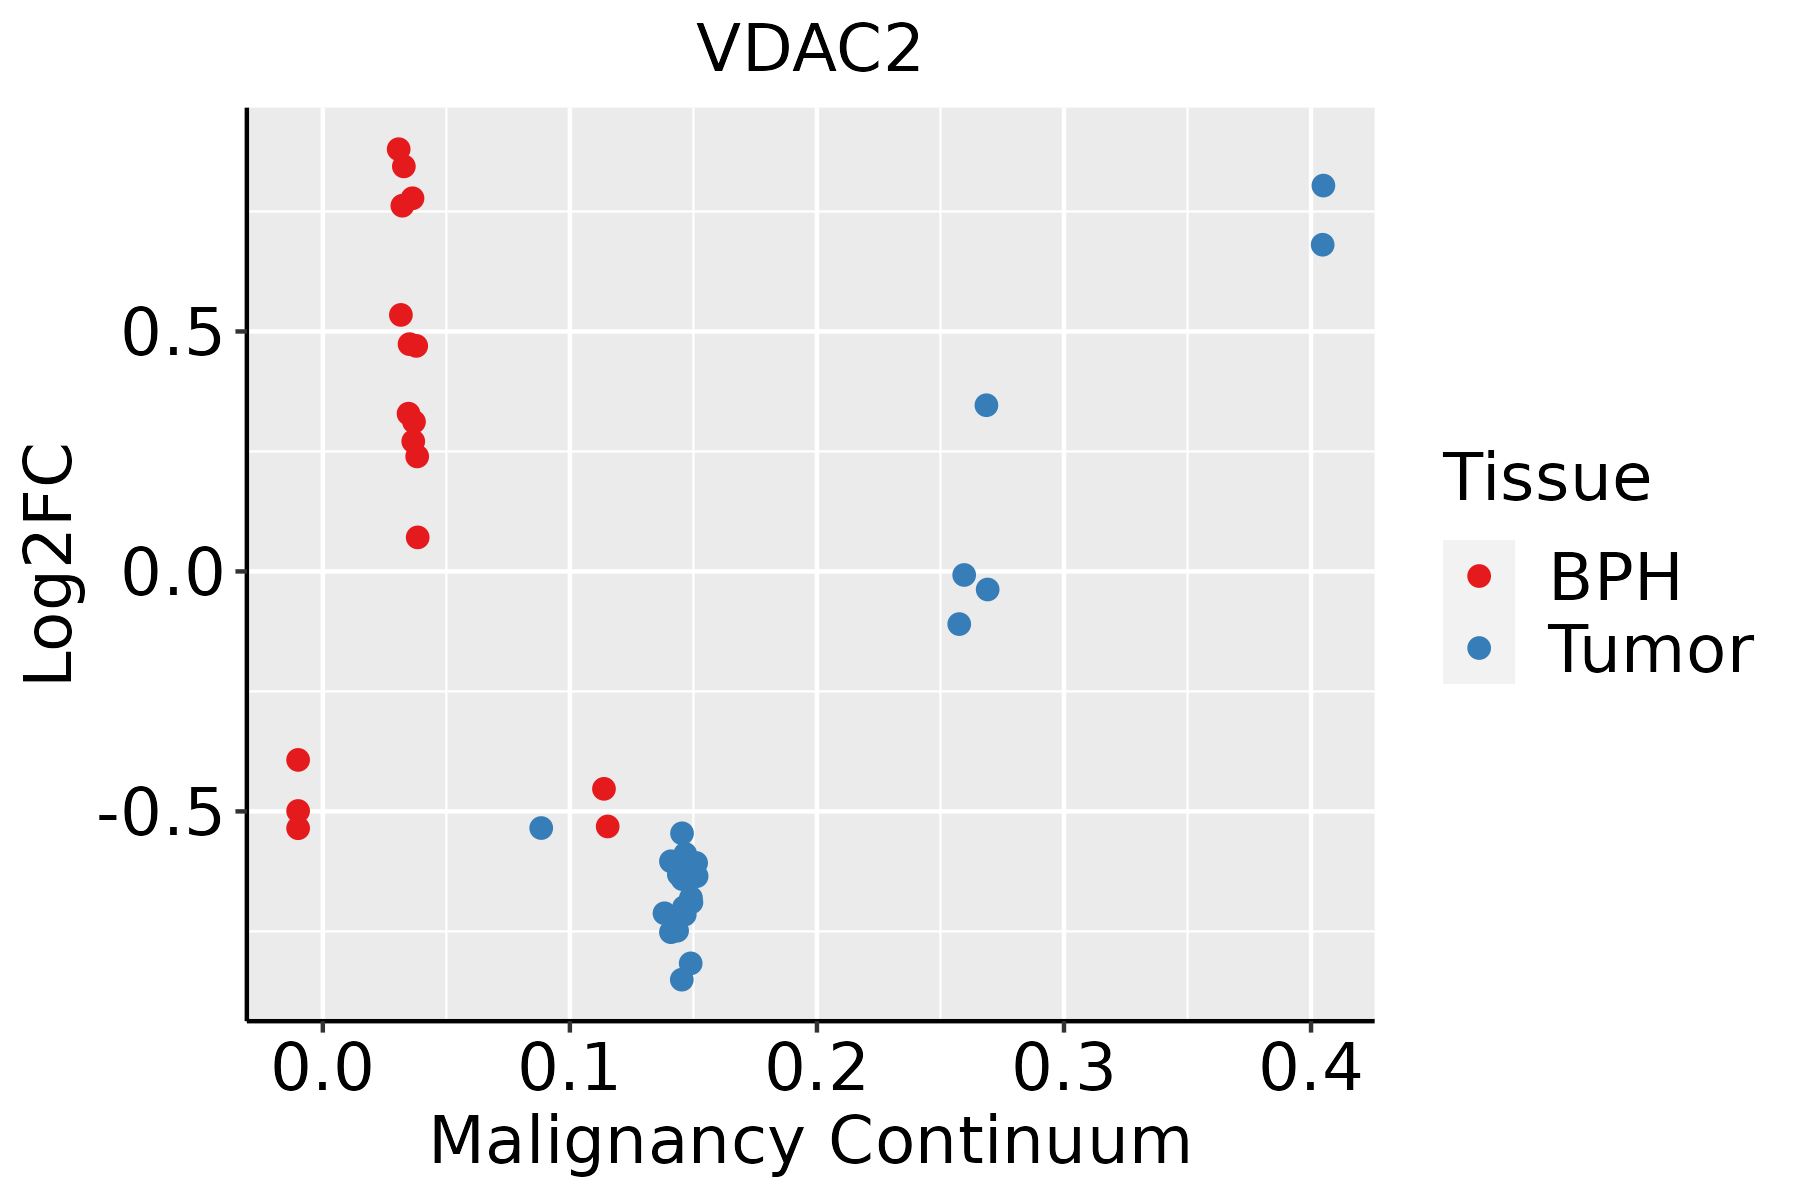 | BPH: Benign Prostatic Hyperplasia |
| Skin | 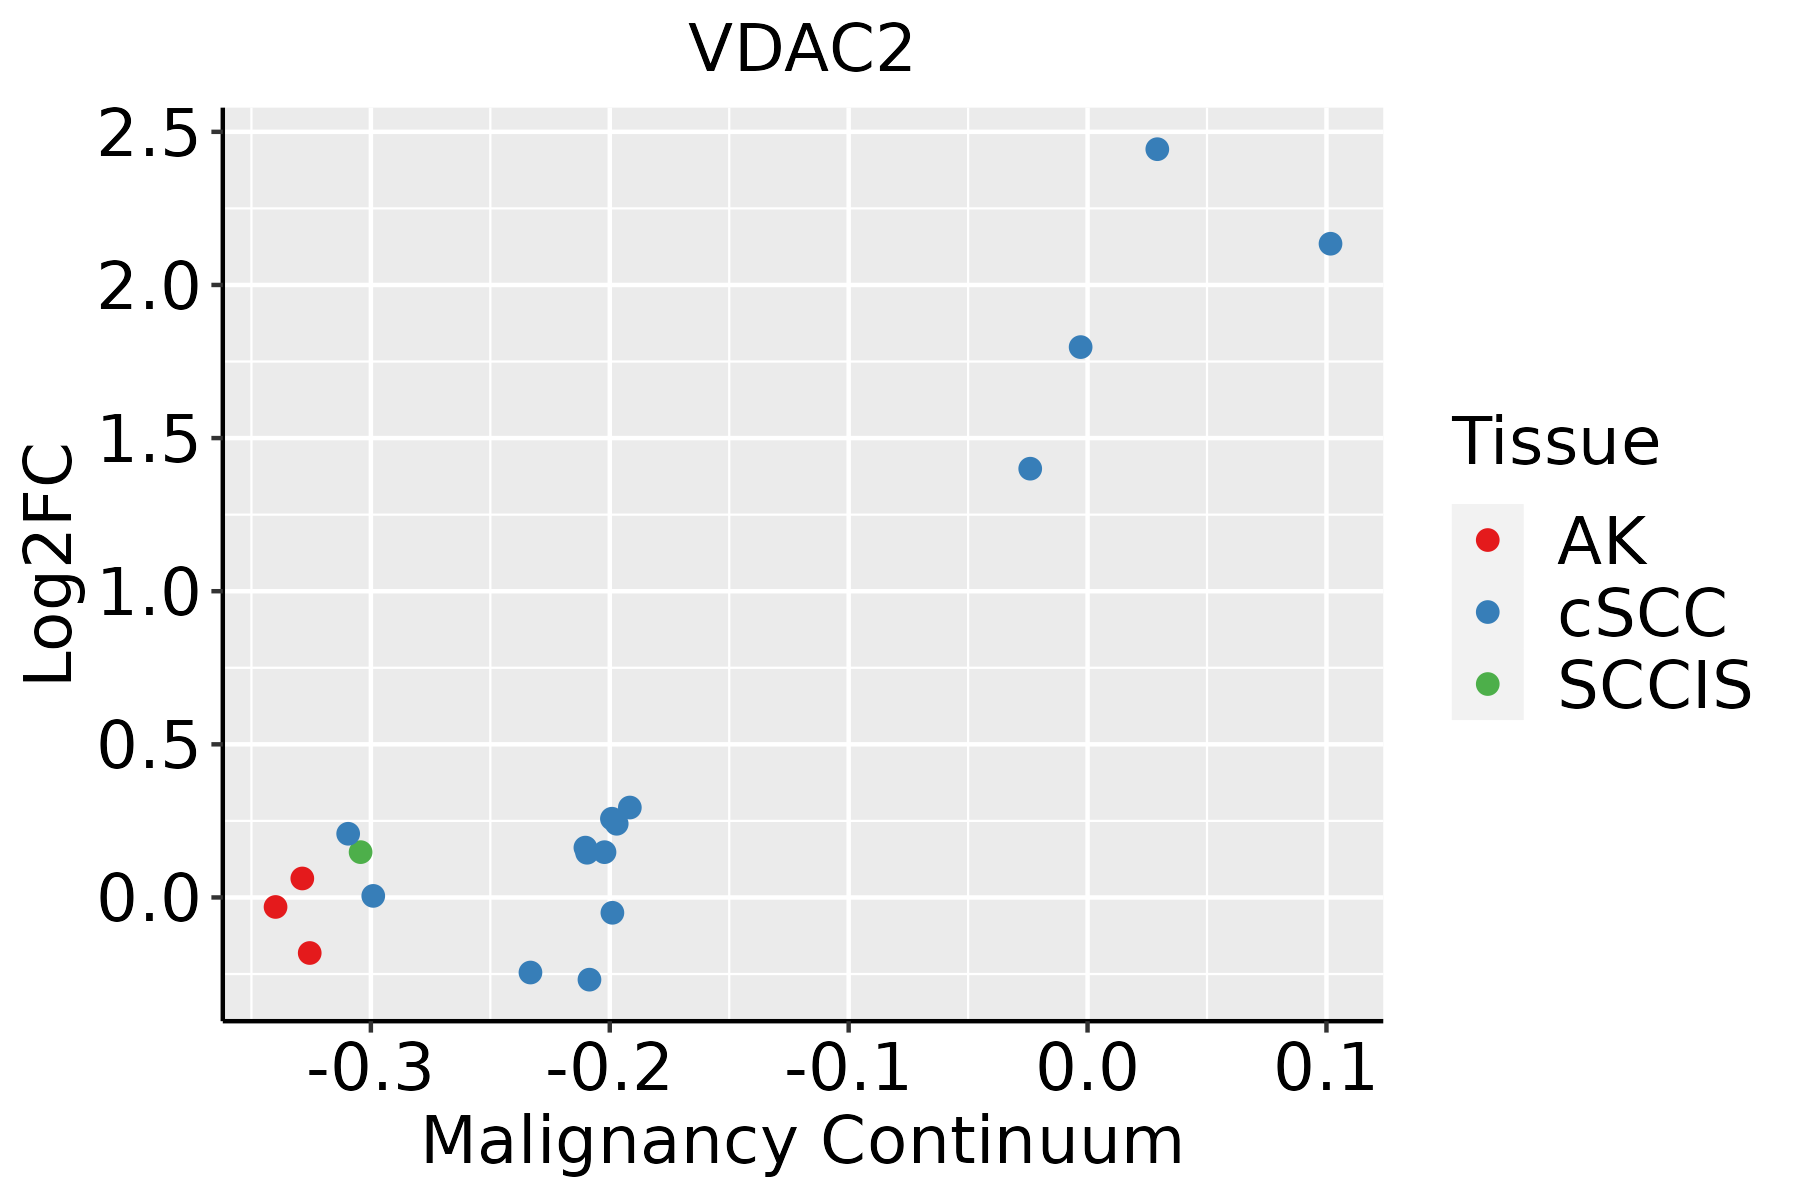 | AK: Actinic keratosis |
| cSCC: Cutaneous squamous cell carcinoma | ||
| SCCIS:squamous cell carcinoma in situ | ||
| Thyroid |  | ATC: Anaplastic thyroid cancer |
| HT: Hashimoto's thyroiditis | ||
| PTC: Papillary thyroid cancer |
| ∗log2FC in expression of this searched gene in stem-like cells from each diseased tissue sample relative to stem-like cells in normal samples in each tissue plotted against the malignancy continuum. Samples are colored based on if they are from different disease stage. |
Top |
Malignant transformation related pathway analysis |
| Find out the enriched GO biological processes and KEGG pathways involved in transition from healthy to precancer to cancer |
| Tissue | Disease Stage | Enriched GO biological Processes |
| Colorectum | AD |  |
| Colorectum | SER |  |
| Colorectum | MSS |  |
| Colorectum | MSI-H |  |
| Colorectum | FAP |  |
| ∗Top 15 enriched GO BP terms are showed in the bar plot of each disease state in each tissue. Each row represents a significant GO biological process which is colored according to the -log10(p.adjust). |
| Page: 1 2 3 4 5 6 7 8 9 |
| GO ID | Tissue | Disease Stage | Description | Gene Ratio | Bg Ratio | pvalue | p.adjust | Count |
| GO:00971939 | Breast | Precancer | intrinsic apoptotic signaling pathway | 59/1080 | 288/18723 | 8.07e-18 | 3.60e-15 | 59 |
| GO:20012339 | Breast | Precancer | regulation of apoptotic signaling pathway | 65/1080 | 356/18723 | 7.70e-17 | 3.17e-14 | 65 |
| GO:20012429 | Breast | Precancer | regulation of intrinsic apoptotic signaling pathway | 41/1080 | 164/18723 | 6.48e-16 | 2.31e-13 | 41 |
| GO:00068398 | Breast | Precancer | mitochondrial transport | 45/1080 | 254/18723 | 1.37e-11 | 1.88e-09 | 45 |
| GO:20012349 | Breast | Precancer | negative regulation of apoptotic signaling pathway | 39/1080 | 224/18723 | 5.35e-10 | 4.77e-08 | 39 |
| GO:20012439 | Breast | Precancer | negative regulation of intrinsic apoptotic signaling pathway | 23/1080 | 98/18723 | 5.82e-09 | 4.45e-07 | 23 |
| GO:00086378 | Breast | Precancer | apoptotic mitochondrial changes | 23/1080 | 107/18723 | 3.44e-08 | 2.12e-06 | 23 |
| GO:00432549 | Breast | Precancer | regulation of protein-containing complex assembly | 50/1080 | 428/18723 | 1.63e-06 | 5.97e-05 | 50 |
| GO:00070066 | Breast | Precancer | mitochondrial membrane organization | 20/1080 | 116/18723 | 9.88e-06 | 2.61e-04 | 20 |
| GO:00905595 | Breast | Precancer | regulation of membrane permeability | 15/1080 | 78/18723 | 3.35e-05 | 7.29e-04 | 15 |
| GO:00469025 | Breast | Precancer | regulation of mitochondrial membrane permeability | 13/1080 | 63/18723 | 5.13e-05 | 1.07e-03 | 13 |
| GO:0035036 | Breast | Precancer | sperm-egg recognition | 10/1080 | 48/18723 | 3.43e-04 | 4.81e-03 | 10 |
| GO:00973456 | Breast | Precancer | mitochondrial outer membrane permeabilization | 8/1080 | 32/18723 | 3.62e-04 | 5.00e-03 | 8 |
| GO:0007339 | Breast | Precancer | binding of sperm to zona pellucida | 9/1080 | 40/18723 | 3.69e-04 | 5.03e-03 | 9 |
| GO:0009988 | Breast | Precancer | cell-cell recognition | 12/1080 | 68/18723 | 4.63e-04 | 6.12e-03 | 12 |
| GO:00357945 | Breast | Precancer | positive regulation of mitochondrial membrane permeability | 9/1080 | 43/18723 | 6.51e-04 | 7.99e-03 | 9 |
| GO:19021084 | Breast | Precancer | regulation of mitochondrial membrane permeability involved in apoptotic process | 9/1080 | 45/18723 | 9.22e-04 | 1.05e-02 | 9 |
| GO:19021105 | Breast | Precancer | positive regulation of mitochondrial membrane permeability involved in apoptotic process | 8/1080 | 38/18723 | 1.24e-03 | 1.32e-02 | 8 |
| GO:00313338 | Breast | Precancer | negative regulation of protein-containing complex assembly | 18/1080 | 141/18723 | 1.27e-03 | 1.35e-02 | 18 |
| GO:19057105 | Breast | Precancer | positive regulation of membrane permeability | 9/1080 | 48/18723 | 1.49e-03 | 1.54e-02 | 9 |
| Page: 1 2 3 4 5 6 7 8 9 10 11 12 13 14 15 16 17 18 19 20 21 22 |
| Pathway ID | Tissue | Disease Stage | Description | Gene Ratio | Bg Ratio | pvalue | p.adjust | qvalue | Count |
| hsa0501218 | Breast | Precancer | Parkinson disease | 99/684 | 266/8465 | 3.58e-42 | 5.65e-40 | 4.33e-40 | 99 |
| hsa0502016 | Breast | Precancer | Prion disease | 95/684 | 273/8465 | 1.39e-37 | 1.46e-35 | 1.12e-35 | 95 |
| hsa0501616 | Breast | Precancer | Huntington disease | 98/684 | 306/8465 | 2.85e-35 | 2.25e-33 | 1.72e-33 | 98 |
| hsa0501016 | Breast | Precancer | Alzheimer disease | 103/684 | 384/8465 | 1.03e-29 | 4.66e-28 | 3.57e-28 | 103 |
| hsa0502216 | Breast | Precancer | Pathways of neurodegeneration - multiple diseases | 112/684 | 476/8465 | 6.96e-27 | 2.44e-25 | 1.87e-25 | 112 |
| hsa0520818 | Breast | Precancer | Chemical carcinogenesis - reactive oxygen species | 68/684 | 223/8465 | 3.61e-23 | 1.14e-21 | 8.73e-22 | 68 |
| hsa0541518 | Breast | Precancer | Diabetic cardiomyopathy | 63/684 | 203/8465 | 5.63e-22 | 1.48e-20 | 1.14e-20 | 63 |
| hsa0501714 | Breast | Precancer | Spinocerebellar ataxia | 29/684 | 143/8465 | 2.79e-06 | 3.83e-05 | 2.94e-05 | 29 |
| hsa042189 | Breast | Precancer | Cellular senescence | 29/684 | 156/8465 | 1.66e-05 | 1.69e-04 | 1.30e-04 | 29 |
| hsa0421610 | Breast | Precancer | Ferroptosis | 11/684 | 41/8465 | 2.95e-04 | 2.45e-03 | 1.88e-03 | 11 |
| hsa0516618 | Breast | Precancer | Human T-cell leukemia virus 1 infection | 33/684 | 222/8465 | 4.29e-04 | 3.31e-03 | 2.53e-03 | 33 |
| hsa0501219 | Breast | Precancer | Parkinson disease | 99/684 | 266/8465 | 3.58e-42 | 5.65e-40 | 4.33e-40 | 99 |
| hsa0502017 | Breast | Precancer | Prion disease | 95/684 | 273/8465 | 1.39e-37 | 1.46e-35 | 1.12e-35 | 95 |
| hsa0501617 | Breast | Precancer | Huntington disease | 98/684 | 306/8465 | 2.85e-35 | 2.25e-33 | 1.72e-33 | 98 |
| hsa0501017 | Breast | Precancer | Alzheimer disease | 103/684 | 384/8465 | 1.03e-29 | 4.66e-28 | 3.57e-28 | 103 |
| hsa0502217 | Breast | Precancer | Pathways of neurodegeneration - multiple diseases | 112/684 | 476/8465 | 6.96e-27 | 2.44e-25 | 1.87e-25 | 112 |
| hsa0520819 | Breast | Precancer | Chemical carcinogenesis - reactive oxygen species | 68/684 | 223/8465 | 3.61e-23 | 1.14e-21 | 8.73e-22 | 68 |
| hsa0541519 | Breast | Precancer | Diabetic cardiomyopathy | 63/684 | 203/8465 | 5.63e-22 | 1.48e-20 | 1.14e-20 | 63 |
| hsa0501715 | Breast | Precancer | Spinocerebellar ataxia | 29/684 | 143/8465 | 2.79e-06 | 3.83e-05 | 2.94e-05 | 29 |
| hsa0421814 | Breast | Precancer | Cellular senescence | 29/684 | 156/8465 | 1.66e-05 | 1.69e-04 | 1.30e-04 | 29 |
| Page: 1 2 3 4 5 6 7 8 9 10 11 12 13 14 15 16 17 18 19 20 21 22 |
Top |
Cell-cell communication analysis |
| Identification of potential cell-cell interactions between two cell types and their ligand-receptor pairs for different disease states |
| Ligand | Receptor | LRpair | Pathway | Tissue | Disease Stage |
| Page: 1 |
Top |
Single-cell gene regulatory network inference analysis |
| Find out the significant the regulons (TFs) and the target genes of each regulon across cell types for different disease states |
| TF | Cell Type | Tissue | Disease Stage | Target Gene | RSS | Regulon Activity |
| ∗The dot plots of a searched regulon are shown for all cell subpopulations in each disease state of each tissue based on the regulon specific score inferred using pySCENIC and by calculating the average expression. |
| Page: 1 |
Top |
Somatic mutation of malignant transformation related genes |
| Annotation of somatic variants for genes involved in malignant transformation |
| Hugo Symbol | Variant Class | Variant Classification | dbSNP RS | HGVSc | HGVSp | HGVSp Short | SWISSPROT | BIOTYPE | SIFT | PolyPhen | Tumor Sample Barcode | Tissue | Histology | Sex | Age | Stage | Therapy Types | Drugs | Outcome |
| VDAC2 | SNV | Missense_Mutation | novel | c.731N>A | p.Arg244His | p.R244H | P45880 | protein_coding | tolerated(0.13) | benign(0.007) | TCGA-AN-A046-01 | Breast | breast invasive carcinoma | Female | >=65 | I/II | Unknown | Unknown | SD |
| VDAC2 | SNV | Missense_Mutation | c.698N>T | p.Asn233Ile | p.N233I | P45880 | protein_coding | deleterious(0.01) | possibly_damaging(0.582) | TCGA-AN-A0FD-01 | Breast | breast invasive carcinoma | Female | >=65 | I/II | Unknown | Unknown | SD | |
| VDAC2 | SNV | Missense_Mutation | novel | c.862C>G | p.Leu288Val | p.L288V | P45880 | protein_coding | tolerated(0.06) | benign(0.027) | TCGA-BH-A0B6-01 | Breast | breast invasive carcinoma | Female | <65 | I/II | Unknown | Unknown | SD |
| VDAC2 | SNV | Missense_Mutation | novel | c.311A>C | p.Asp104Ala | p.D104A | P45880 | protein_coding | deleterious(0) | benign(0.14) | TCGA-EA-A3HS-01 | Cervix | cervical & endocervical cancer | Female | <65 | I/II | Unknown | Unknown | SD |
| VDAC2 | SNV | Missense_Mutation | rs759303647 | c.910G>A | p.Ala304Thr | p.A304T | P45880 | protein_coding | deleterious(0.02) | benign(0.221) | TCGA-D5-6930-01 | Colorectum | colon adenocarcinoma | Male | >=65 | I/II | Unknown | Unknown | SD |
| VDAC2 | SNV | Missense_Mutation | c.223N>G | p.Thr75Ala | p.T75A | P45880 | protein_coding | tolerated(0.09) | benign(0.003) | TCGA-RU-A8FL-01 | Colorectum | colon adenocarcinoma | Male | <65 | III/IV | Chemotherapy | folfox | PD | |
| VDAC2 | SNV | Missense_Mutation | rs759303647 | c.910G>A | p.Ala304Thr | p.A304T | P45880 | protein_coding | deleterious(0.02) | benign(0.221) | TCGA-WS-AB45-01 | Colorectum | colon adenocarcinoma | Female | <65 | I/II | Unknown | Unknown | SD |
| VDAC2 | deletion | Frame_Shift_Del | c.177_178delNN | p.Lys60ValfsTer14 | p.K60Vfs*14 | P45880 | protein_coding | TCGA-G4-6628-01 | Colorectum | colon adenocarcinoma | Male | >=65 | I/II | Unknown | Unknown | SD | |||
| VDAC2 | SNV | Missense_Mutation | novel | c.83N>A | p.Cys28Tyr | p.C28Y | P45880 | protein_coding | deleterious(0) | benign(0.245) | TCGA-A5-A0G2-01 | Endometrium | uterine corpus endometrioid carcinoma | Female | <65 | III/IV | Unknown | Unknown | SD |
| VDAC2 | SNV | Missense_Mutation | novel | c.157G>T | p.Val53Leu | p.V53L | P45880 | protein_coding | tolerated(0.16) | benign(0.01) | TCGA-AJ-A23O-01 | Endometrium | uterine corpus endometrioid carcinoma | Female | >=65 | I/II | Unknown | Unknown | SD |
| Page: 1 2 |
Top |
Related drugs of malignant transformation related genes |
| Identification of chemicals and drugs interact with genes involved in malignant transfromation |
| (DGIdb 4.0) |
| Entrez ID | Symbol | Category | Interaction Types | Drug Claim Name | Drug Name | PMIDs |
| 7417 | VDAC2 | NA | OLESOXIME | OLESOXIME | ||
| 7417 | VDAC2 | NA | TCDD | 17998243 |
| Page: 1 |

Copyright 2023-Present -The University of Texas Health Science Center at Houston |