
|
|||||
|
 | |
| |
| |
| |
| |
| |
|
Gene: VDAC1 |
Gene summary for VDAC1 |
| Gene information | Species | Human | Gene symbol | VDAC1 | Gene ID | 7416 |
| Gene name | voltage dependent anion channel 1 | |
| Gene Alias | PORIN | |
| Cytomap | 5q31.1 | |
| Gene Type | protein-coding | GO ID | GO:0000422 | UniProtAcc | A0A1L1UHR1 |
Top |
Malignant transformation analysis |
| Identification of the aberrant gene expression in precancerous and cancerous lesions by comparing the gene expression of stem-like cells in diseased tissues with normal stem cells |
| Entrez ID | Symbol | Replicates | Species | Organ | Tissue | Adj P-value | Log2FC | Malignancy |
| 7416 | VDAC1 | CA_HPV_1 | Human | Cervix | CC | 2.67e-10 | -1.82e-02 | 0.0264 |
| 7416 | VDAC1 | N_HPV_1 | Human | Cervix | N_HPV | 7.10e-03 | -1.18e-02 | 0.0079 |
| 7416 | VDAC1 | CCI_1 | Human | Cervix | CC | 8.90e-09 | -5.91e-01 | 0.528 |
| 7416 | VDAC1 | CCI_3 | Human | Cervix | CC | 1.03e-08 | -5.21e-01 | 0.516 |
| 7416 | VDAC1 | CCII_1 | Human | Cervix | CC | 2.02e-20 | -6.26e-01 | 0.3249 |
| 7416 | VDAC1 | L1 | Human | Cervix | CC | 2.49e-11 | -2.24e-01 | 0.0802 |
| 7416 | VDAC1 | T1 | Human | Cervix | CC | 9.21e-04 | -2.57e-01 | 0.0918 |
| 7416 | VDAC1 | HTA11_3410_2000001011 | Human | Colorectum | AD | 1.85e-09 | 3.25e-01 | 0.0155 |
| 7416 | VDAC1 | HTA11_2487_2000001011 | Human | Colorectum | SER | 7.39e-11 | 6.42e-01 | -0.1808 |
| 7416 | VDAC1 | HTA11_1938_2000001011 | Human | Colorectum | AD | 2.29e-18 | 9.87e-01 | -0.0811 |
| 7416 | VDAC1 | HTA11_78_2000001011 | Human | Colorectum | AD | 9.07e-31 | 1.31e+00 | -0.1088 |
| 7416 | VDAC1 | HTA11_347_2000001011 | Human | Colorectum | AD | 6.55e-30 | 8.34e-01 | -0.1954 |
| 7416 | VDAC1 | HTA11_411_2000001011 | Human | Colorectum | SER | 2.15e-03 | 7.58e-01 | -0.2602 |
| 7416 | VDAC1 | HTA11_83_2000001011 | Human | Colorectum | SER | 5.90e-06 | 4.93e-01 | -0.1526 |
| 7416 | VDAC1 | HTA11_696_2000001011 | Human | Colorectum | AD | 9.16e-05 | 4.72e-01 | -0.1464 |
| 7416 | VDAC1 | HTA11_1391_2000001011 | Human | Colorectum | AD | 1.29e-11 | 5.05e-01 | -0.059 |
| 7416 | VDAC1 | HTA11_2992_2000001011 | Human | Colorectum | SER | 2.24e-09 | 9.31e-01 | -0.1706 |
| 7416 | VDAC1 | HTA11_5212_2000001011 | Human | Colorectum | AD | 4.01e-09 | 7.31e-01 | -0.2061 |
| 7416 | VDAC1 | HTA11_5216_2000001011 | Human | Colorectum | SER | 1.88e-04 | 7.18e-01 | -0.1462 |
| 7416 | VDAC1 | HTA11_7862_2000001011 | Human | Colorectum | AD | 8.38e-08 | 6.36e-01 | -0.0179 |
| Page: 1 2 3 4 5 6 7 8 9 10 11 |
| Tissue | Expression Dynamics | Abbreviation |
| Cervix |  | CC: Cervix cancer |
| HSIL_HPV: HPV-infected high-grade squamous intraepithelial lesions | ||
| N_HPV: HPV-infected normal cervix | ||
| Colorectum (GSE201348) |  | FAP: Familial adenomatous polyposis |
| CRC: Colorectal cancer | ||
| Colorectum (HTA11) |  | AD: Adenomas |
| SER: Sessile serrated lesions | ||
| MSI-H: Microsatellite-high colorectal cancer | ||
| MSS: Microsatellite stable colorectal cancer | ||
| Endometrium | 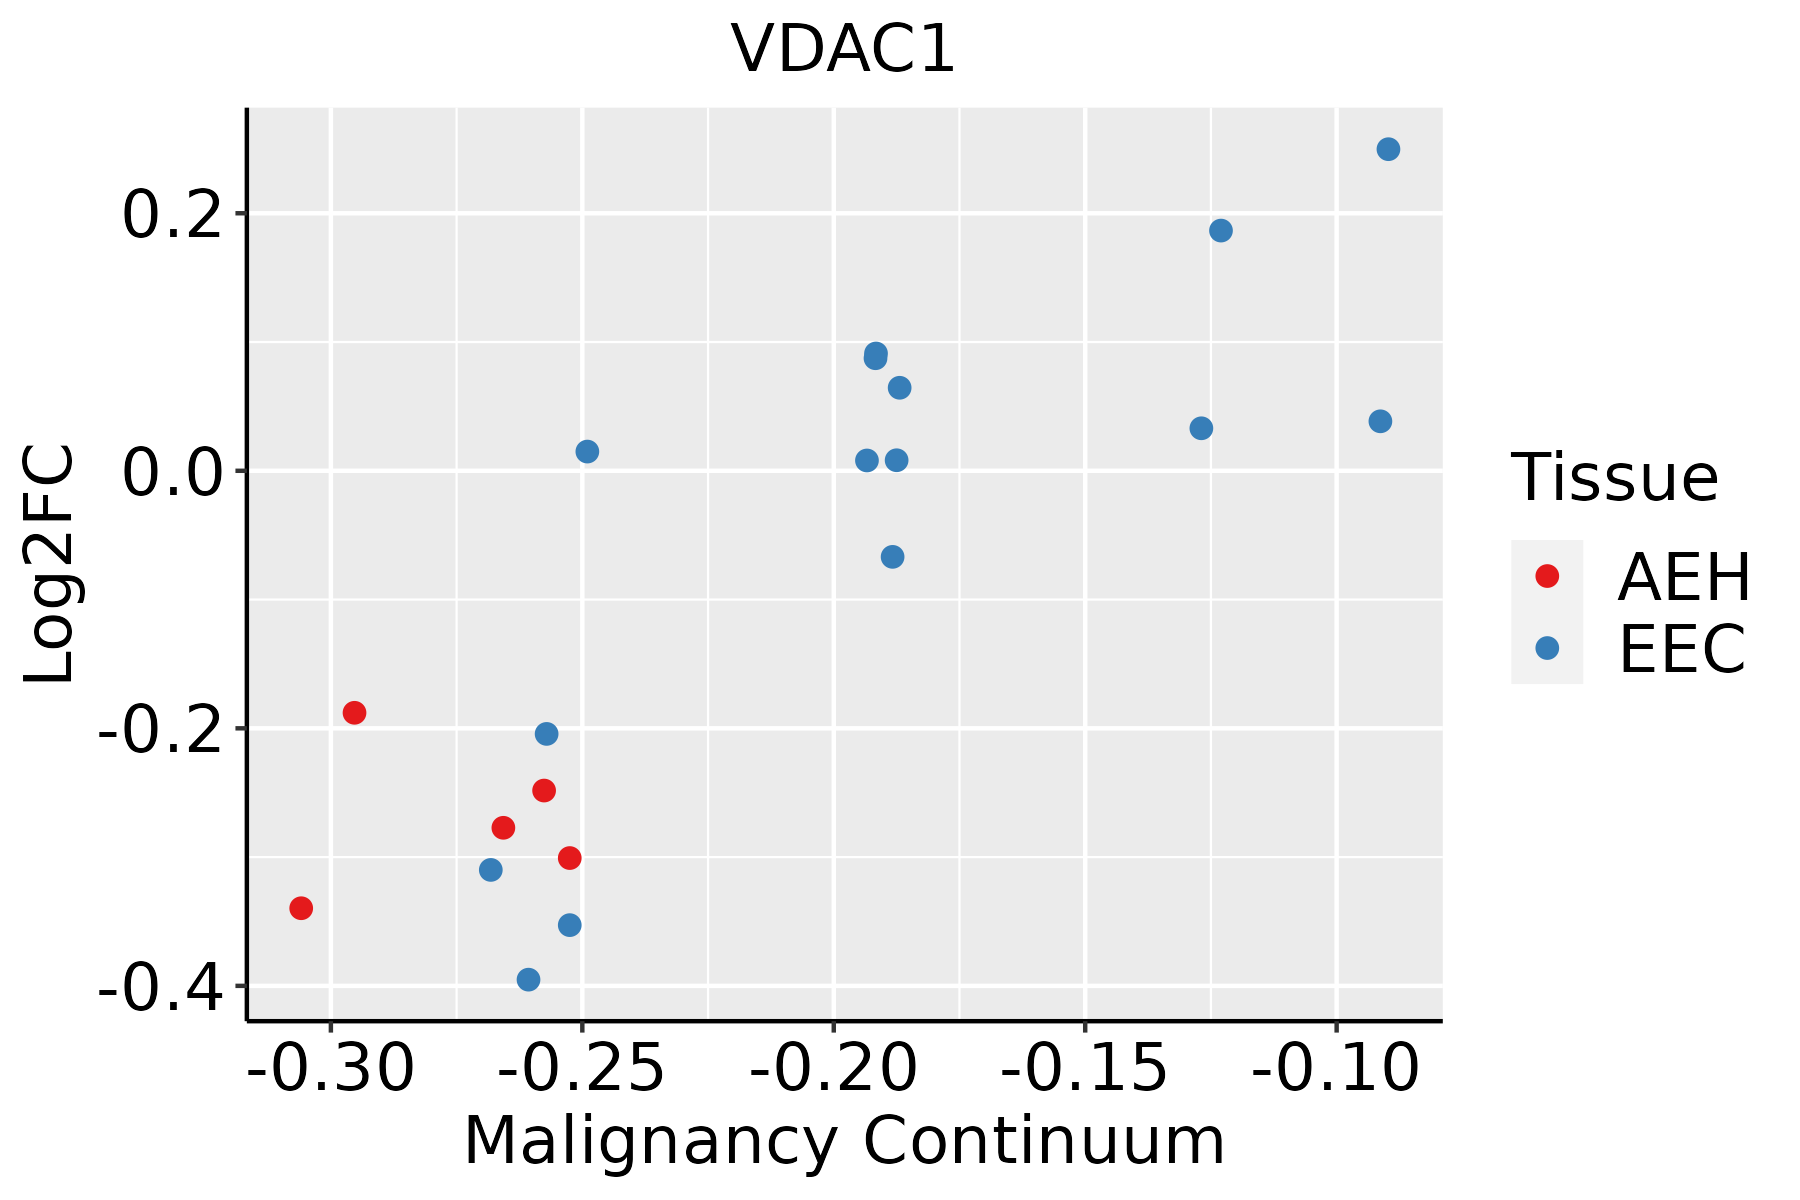 | AEH: Atypical endometrial hyperplasia |
| EEC: Endometrioid Cancer | ||
| Esophagus |  | ESCC: Esophageal squamous cell carcinoma |
| HGIN: High-grade intraepithelial neoplasias | ||
| LGIN: Low-grade intraepithelial neoplasias | ||
| Liver | 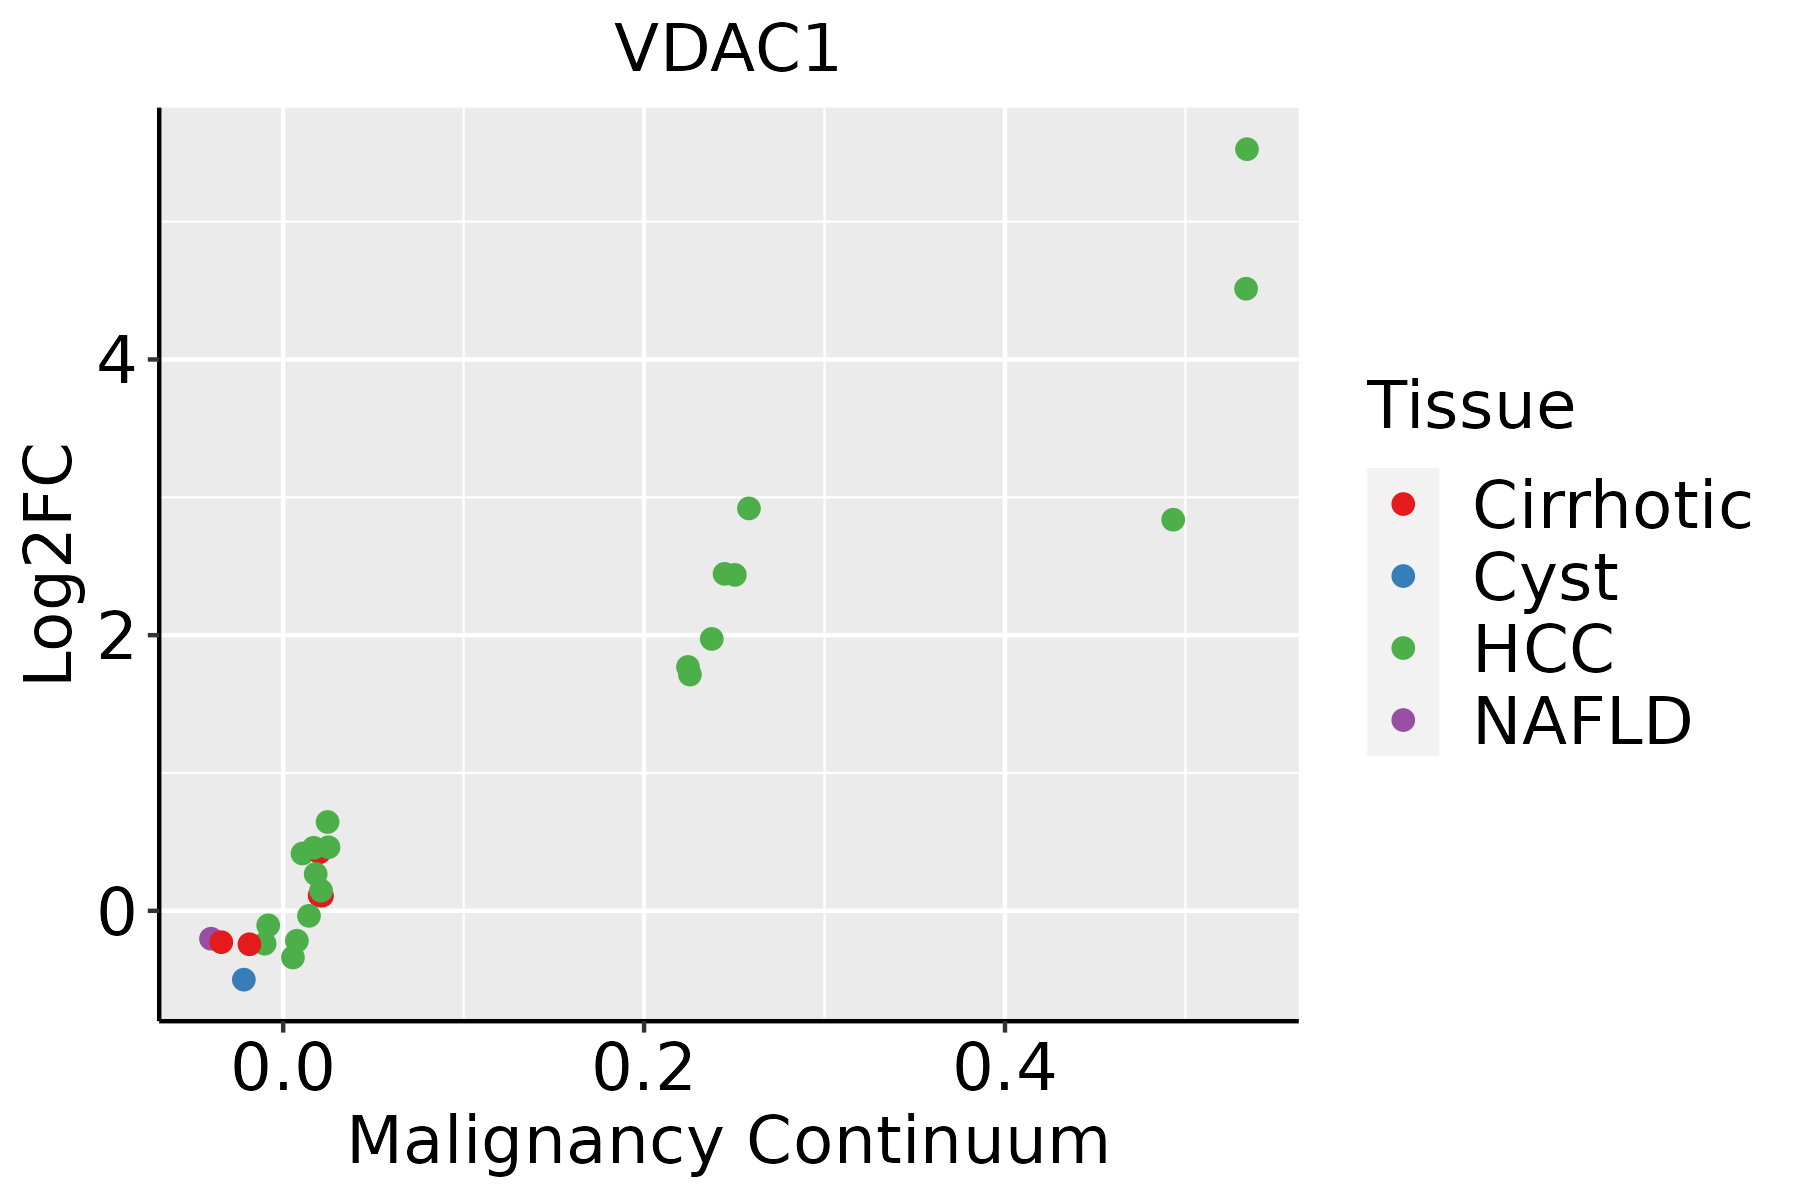 | HCC: Hepatocellular carcinoma |
| NAFLD: Non-alcoholic fatty liver disease | ||
| Oral Cavity | 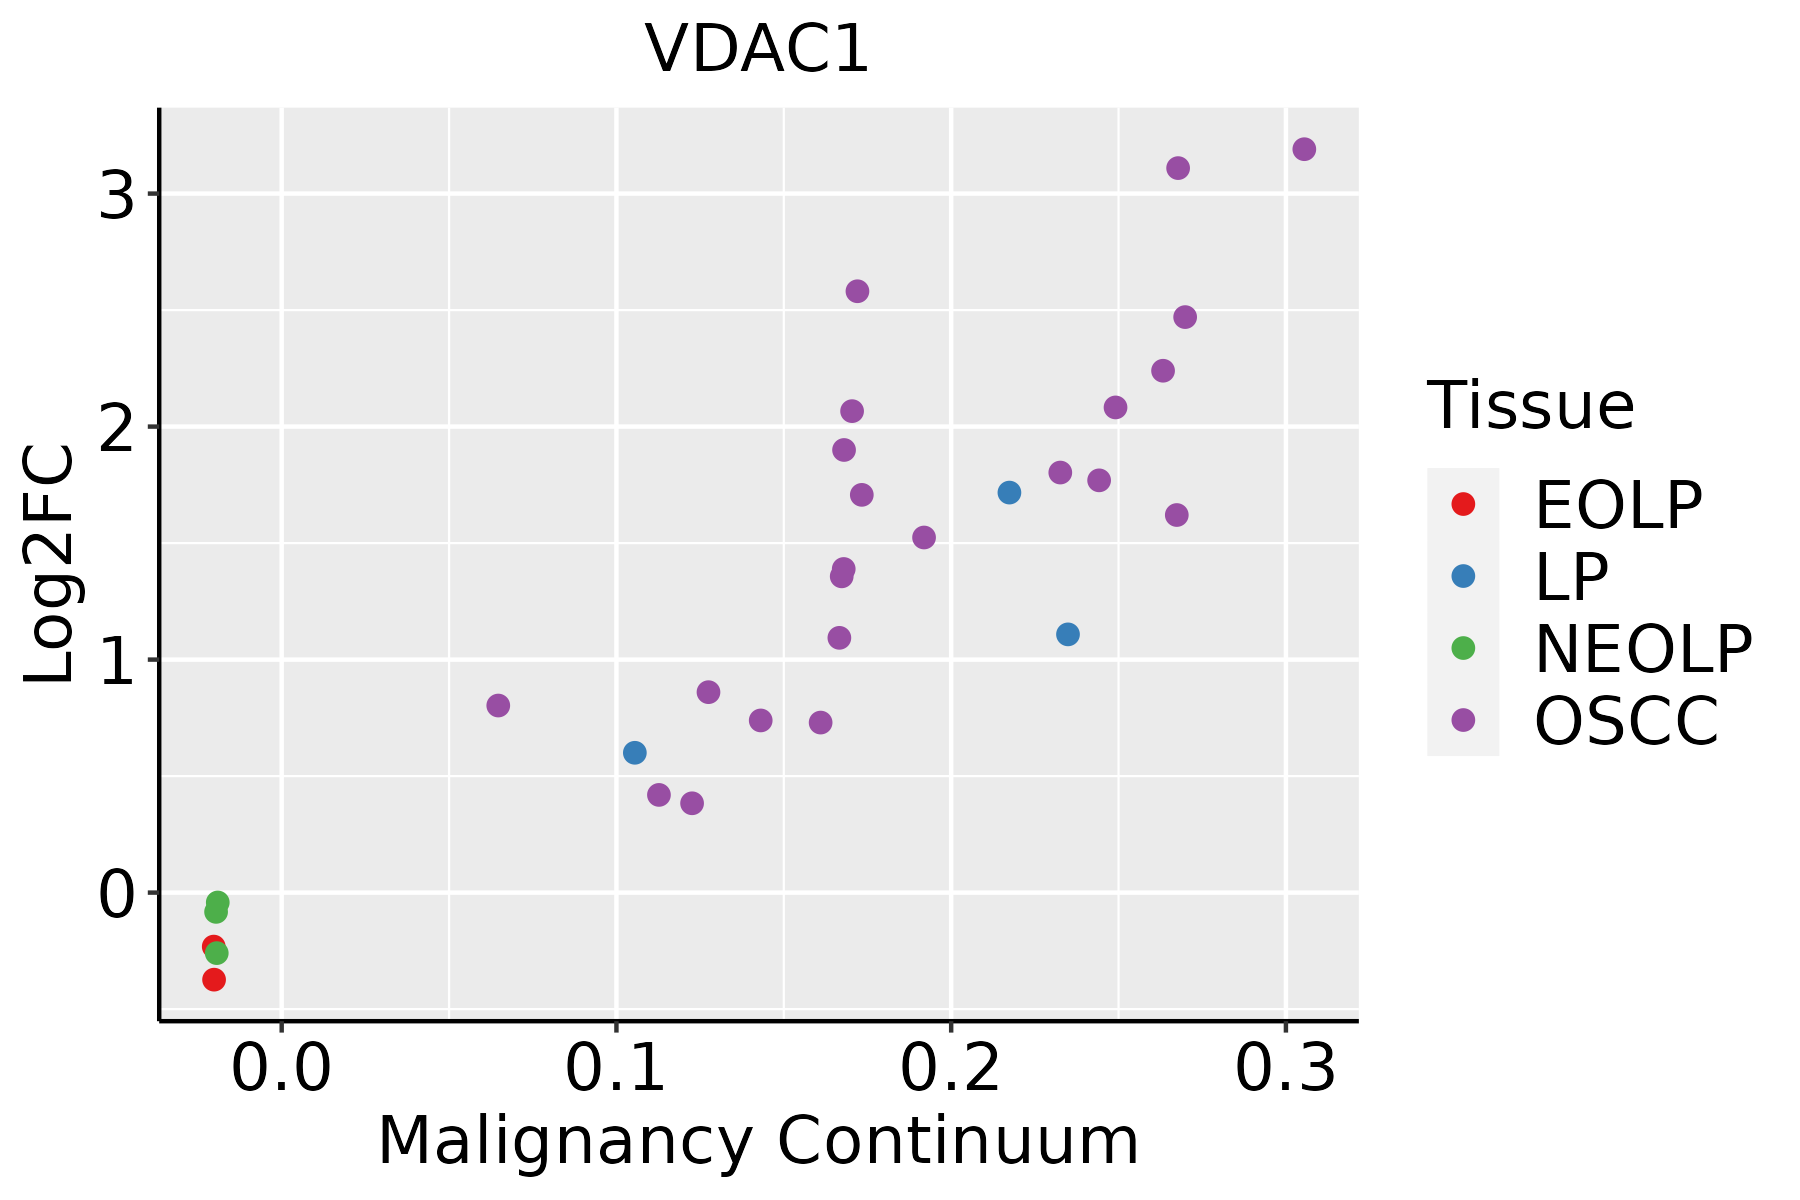 | EOLP: Erosive Oral lichen planus |
| LP: leukoplakia | ||
| NEOLP: Non-erosive oral lichen planus | ||
| OSCC: Oral squamous cell carcinoma | ||
| Prostate | 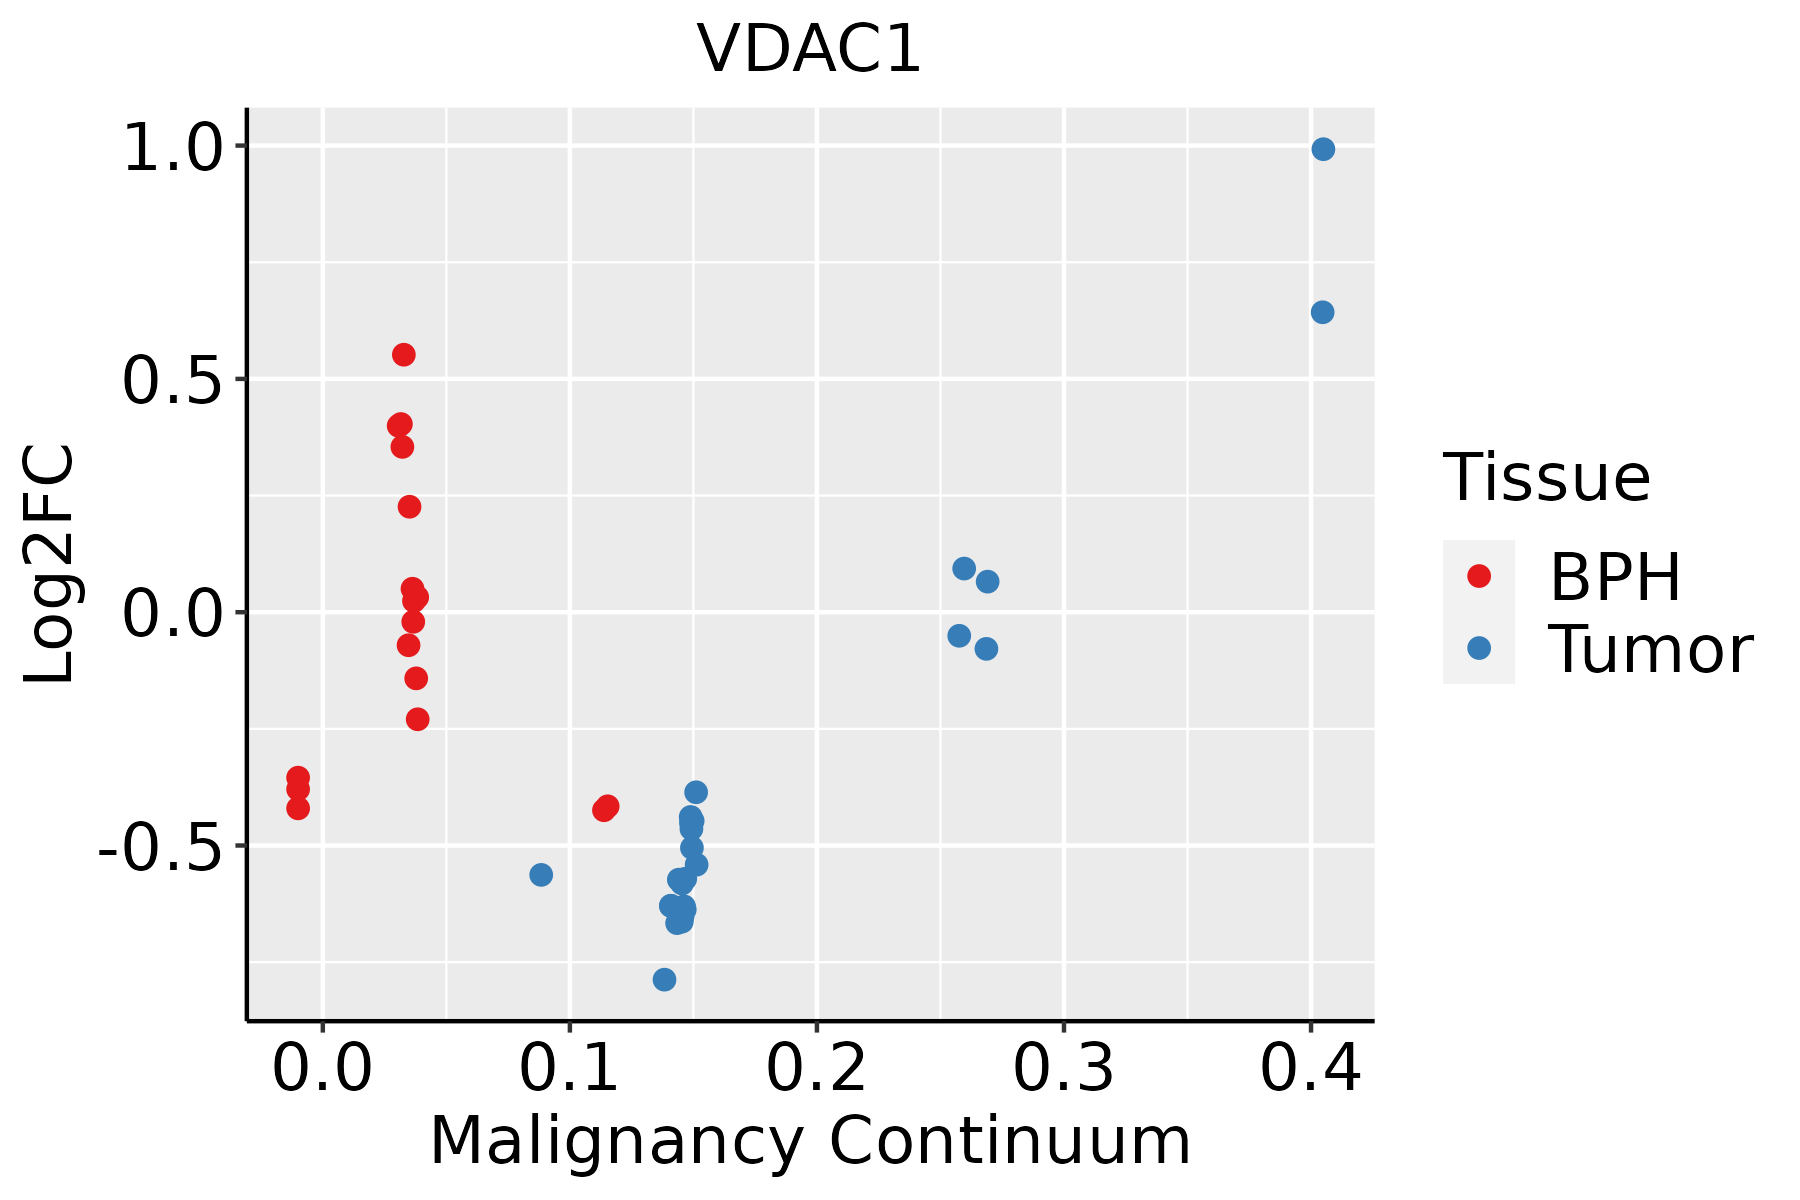 | BPH: Benign Prostatic Hyperplasia |
| Skin |  | AK: Actinic keratosis |
| cSCC: Cutaneous squamous cell carcinoma | ||
| SCCIS:squamous cell carcinoma in situ | ||
| Thyroid |  | ATC: Anaplastic thyroid cancer |
| HT: Hashimoto's thyroiditis | ||
| PTC: Papillary thyroid cancer |
| ∗log2FC in expression of this searched gene in stem-like cells from each diseased tissue sample relative to stem-like cells in normal samples in each tissue plotted against the malignancy continuum. Samples are colored based on if they are from different disease stage. |
Top |
Malignant transformation related pathway analysis |
| Find out the enriched GO biological processes and KEGG pathways involved in transition from healthy to precancer to cancer |
| Tissue | Disease Stage | Enriched GO biological Processes |
| Colorectum | AD |  |
| Colorectum | SER |  |
| Colorectum | MSS |  |
| Colorectum | MSI-H |  |
| Colorectum | FAP |  |
| ∗Top 15 enriched GO BP terms are showed in the bar plot of each disease state in each tissue. Each row represents a significant GO biological process which is colored according to the -log10(p.adjust). |
| Page: 1 2 3 4 5 6 7 8 9 |
| GO ID | Tissue | Disease Stage | Description | Gene Ratio | Bg Ratio | pvalue | p.adjust | Count |
| GO:000989610 | Cervix | CC | positive regulation of catabolic process | 109/2311 | 492/18723 | 5.26e-10 | 6.99e-08 | 109 |
| GO:003133110 | Cervix | CC | positive regulation of cellular catabolic process | 91/2311 | 427/18723 | 9.64e-08 | 5.25e-06 | 91 |
| GO:00068399 | Cervix | CC | mitochondrial transport | 60/2311 | 254/18723 | 4.21e-07 | 1.67e-05 | 60 |
| GO:002241110 | Cervix | CC | cellular component disassembly | 83/2311 | 443/18723 | 6.04e-05 | 8.68e-04 | 83 |
| GO:00108218 | Cervix | CC | regulation of mitochondrion organization | 34/2311 | 144/18723 | 1.27e-04 | 1.58e-03 | 34 |
| GO:00162367 | Cervix | CC | macroautophagy | 58/2311 | 291/18723 | 1.40e-04 | 1.70e-03 | 58 |
| GO:19905428 | Cervix | CC | mitochondrial transmembrane transport | 26/2311 | 102/18723 | 2.10e-04 | 2.39e-03 | 26 |
| GO:00105067 | Cervix | CC | regulation of autophagy | 61/2311 | 317/18723 | 2.61e-04 | 2.87e-03 | 61 |
| GO:00004227 | Cervix | CC | autophagy of mitochondrion | 21/2311 | 81/18723 | 6.47e-04 | 6.02e-03 | 21 |
| GO:00617267 | Cervix | CC | mitochondrion disassembly | 21/2311 | 81/18723 | 6.47e-04 | 6.02e-03 | 21 |
| GO:00725939 | Cervix | CC | reactive oxygen species metabolic process | 47/2311 | 239/18723 | 7.74e-04 | 6.87e-03 | 47 |
| GO:00108224 | Cervix | CC | positive regulation of mitochondrion organization | 19/2311 | 74/18723 | 1.30e-03 | 1.03e-02 | 19 |
| GO:20003779 | Cervix | CC | regulation of reactive oxygen species metabolic process | 32/2311 | 157/18723 | 2.78e-03 | 1.87e-02 | 32 |
| GO:19031466 | Cervix | CC | regulation of autophagy of mitochondrion | 10/2311 | 33/18723 | 5.07e-03 | 3.00e-02 | 10 |
| GO:000683924 | Cervix | N_HPV | mitochondrial transport | 22/534 | 254/18723 | 4.05e-06 | 1.60e-04 | 22 |
| GO:00060909 | Cervix | N_HPV | pyruvate metabolic process | 12/534 | 106/18723 | 4.94e-05 | 1.14e-03 | 12 |
| GO:199054223 | Cervix | N_HPV | mitochondrial transmembrane transport | 11/534 | 102/18723 | 1.57e-04 | 2.79e-03 | 11 |
| GO:000989615 | Cervix | N_HPV | positive regulation of catabolic process | 28/534 | 492/18723 | 4.43e-04 | 6.10e-03 | 28 |
| GO:003133115 | Cervix | N_HPV | positive regulation of cellular catabolic process | 25/534 | 427/18723 | 5.88e-04 | 7.74e-03 | 25 |
| GO:200037724 | Cervix | N_HPV | regulation of reactive oxygen species metabolic process | 12/534 | 157/18723 | 1.85e-03 | 1.83e-02 | 12 |
| Page: 1 2 3 4 5 6 7 8 9 10 11 12 13 14 15 16 17 18 19 20 21 22 |
| Pathway ID | Tissue | Disease Stage | Description | Gene Ratio | Bg Ratio | pvalue | p.adjust | qvalue | Count |
| hsa0520820 | Cervix | CC | Chemical carcinogenesis - reactive oxygen species | 92/1267 | 223/8465 | 4.71e-22 | 5.09e-20 | 3.01e-20 | 92 |
| hsa0501220 | Cervix | CC | Parkinson disease | 102/1267 | 266/8465 | 1.81e-21 | 1.47e-19 | 8.66e-20 | 102 |
| hsa0502018 | Cervix | CC | Prion disease | 98/1267 | 273/8465 | 2.64e-18 | 1.42e-16 | 8.42e-17 | 98 |
| hsa0541520 | Cervix | CC | Diabetic cardiomyopathy | 76/1267 | 203/8465 | 1.40e-15 | 6.46e-14 | 3.82e-14 | 76 |
| hsa0501018 | Cervix | CC | Alzheimer disease | 113/1267 | 384/8465 | 9.67e-14 | 3.92e-12 | 2.32e-12 | 113 |
| hsa0501618 | Cervix | CC | Huntington disease | 94/1267 | 306/8465 | 8.49e-13 | 3.06e-11 | 1.81e-11 | 94 |
| hsa0502218 | Cervix | CC | Pathways of neurodegeneration - multiple diseases | 128/1267 | 476/8465 | 2.87e-12 | 9.29e-11 | 5.50e-11 | 128 |
| hsa0501418 | Cervix | CC | Amyotrophic lateral sclerosis | 103/1267 | 364/8465 | 1.79e-11 | 4.47e-10 | 2.64e-10 | 103 |
| hsa0513120 | Cervix | CC | Shigellosis | 69/1267 | 247/8465 | 7.64e-08 | 1.03e-06 | 6.10e-07 | 69 |
| hsa0421810 | Cervix | CC | Cellular senescence | 49/1267 | 156/8465 | 1.30e-07 | 1.63e-06 | 9.61e-07 | 49 |
| hsa0516620 | Cervix | CC | Human T-cell leukemia virus 1 infection | 61/1267 | 222/8465 | 8.13e-07 | 7.98e-06 | 4.72e-06 | 61 |
| hsa0516414 | Cervix | CC | Influenza A | 43/1267 | 171/8465 | 3.03e-04 | 1.64e-03 | 9.68e-04 | 43 |
| hsa0501716 | Cervix | CC | Spinocerebellar ataxia | 35/1267 | 143/8465 | 1.77e-03 | 7.21e-03 | 4.26e-03 | 35 |
| hsa046213 | Cervix | CC | NOD-like receptor signaling pathway | 41/1267 | 186/8465 | 5.90e-03 | 1.95e-02 | 1.15e-02 | 41 |
| hsa05208110 | Cervix | CC | Chemical carcinogenesis - reactive oxygen species | 92/1267 | 223/8465 | 4.71e-22 | 5.09e-20 | 3.01e-20 | 92 |
| hsa05012110 | Cervix | CC | Parkinson disease | 102/1267 | 266/8465 | 1.81e-21 | 1.47e-19 | 8.66e-20 | 102 |
| hsa0502019 | Cervix | CC | Prion disease | 98/1267 | 273/8465 | 2.64e-18 | 1.42e-16 | 8.42e-17 | 98 |
| hsa05415110 | Cervix | CC | Diabetic cardiomyopathy | 76/1267 | 203/8465 | 1.40e-15 | 6.46e-14 | 3.82e-14 | 76 |
| hsa0501019 | Cervix | CC | Alzheimer disease | 113/1267 | 384/8465 | 9.67e-14 | 3.92e-12 | 2.32e-12 | 113 |
| hsa0501619 | Cervix | CC | Huntington disease | 94/1267 | 306/8465 | 8.49e-13 | 3.06e-11 | 1.81e-11 | 94 |
| Page: 1 2 3 4 5 6 7 8 9 10 11 12 13 14 15 16 17 18 19 20 21 22 23 |
Top |
Cell-cell communication analysis |
| Identification of potential cell-cell interactions between two cell types and their ligand-receptor pairs for different disease states |
| Ligand | Receptor | LRpair | Pathway | Tissue | Disease Stage |
| Page: 1 |
Top |
Single-cell gene regulatory network inference analysis |
| Find out the significant the regulons (TFs) and the target genes of each regulon across cell types for different disease states |
| TF | Cell Type | Tissue | Disease Stage | Target Gene | RSS | Regulon Activity |
| ∗The dot plots of a searched regulon are shown for all cell subpopulations in each disease state of each tissue based on the regulon specific score inferred using pySCENIC and by calculating the average expression. |
| Page: 1 |
Top |
Somatic mutation of malignant transformation related genes |
| Annotation of somatic variants for genes involved in malignant transformation |
| Hugo Symbol | Variant Class | Variant Classification | dbSNP RS | HGVSc | HGVSp | HGVSp Short | SWISSPROT | BIOTYPE | SIFT | PolyPhen | Tumor Sample Barcode | Tissue | Histology | Sex | Age | Stage | Therapy Types | Drugs | Outcome |
| VDAC1 | SNV | Missense_Mutation | novel | c.785N>A | p.Leu262His | p.L262H | P21796 | protein_coding | deleterious(0.02) | possibly_damaging(0.878) | TCGA-A2-A4S0-01 | Breast | breast invasive carcinoma | Female | >=65 | I/II | Unknown | Unknown | SD |
| VDAC1 | SNV | Missense_Mutation | c.479N>G | p.Ala160Gly | p.A160G | P21796 | protein_coding | tolerated(0.11) | benign(0) | TCGA-AC-A23H-01 | Breast | breast invasive carcinoma | Female | >=65 | I/II | Unknown | Unknown | PD | |
| VDAC1 | SNV | Missense_Mutation | c.478N>T | p.Ala160Ser | p.A160S | P21796 | protein_coding | tolerated(0.46) | benign(0.001) | TCGA-AC-A23H-01 | Breast | breast invasive carcinoma | Female | >=65 | I/II | Unknown | Unknown | PD | |
| VDAC1 | SNV | Missense_Mutation | novel | c.32N>A | p.Gly11Asp | p.G11D | P21796 | protein_coding | deleterious(0.04) | benign(0.096) | TCGA-AN-A046-01 | Breast | breast invasive carcinoma | Female | >=65 | I/II | Unknown | Unknown | SD |
| VDAC1 | SNV | Missense_Mutation | c.199T>C | p.Tyr67His | p.Y67H | P21796 | protein_coding | tolerated(0.22) | benign(0.006) | TCGA-D8-A1XK-01 | Breast | breast invasive carcinoma | Female | <65 | I/II | Chemotherapy | doxorubicine+cyclophosphamide | SD | |
| VDAC1 | SNV | Missense_Mutation | c.148N>C | p.Glu50Gln | p.E50Q | P21796 | protein_coding | deleterious(0) | possibly_damaging(0.468) | TCGA-EK-A2PM-01 | Cervix | cervical & endocervical cancer | Female | >=65 | I/II | Unknown | Unknown | SD | |
| VDAC1 | SNV | Missense_Mutation | novel | c.483N>C | p.Lys161Asn | p.K161N | P21796 | protein_coding | tolerated(0.05) | benign(0.043) | TCGA-AA-3984-01 | Colorectum | colon adenocarcinoma | Female | <65 | I/II | Unknown | Unknown | SD |
| VDAC1 | SNV | Missense_Mutation | novel | c.219N>T | p.Glu73Asp | p.E73D | P21796 | protein_coding | deleterious(0) | probably_damaging(0.985) | TCGA-CA-6717-01 | Colorectum | colon adenocarcinoma | Male | <65 | I/II | Chemotherapy | oxaliplatin | CR |
| VDAC1 | insertion | In_Frame_Ins | novel | c.598_599insTACCCACCG | p.Lys200delinsIleProThrGlu | p.K200delinsIPTE | P21796 | protein_coding | TCGA-AM-5820-01 | Colorectum | colon adenocarcinoma | Female | <65 | I/II | Unknown | Unknown | SD | ||
| VDAC1 | SNV | Missense_Mutation | rs377065269 | c.394G>A | p.Asp132Asn | p.D132N | P21796 | protein_coding | tolerated(0.1) | benign(0.014) | TCGA-AP-A056-01 | Endometrium | uterine corpus endometrioid carcinoma | Female | <65 | I/II | Unknown | Unknown | SD |
| Page: 1 2 3 |
Top |
Related drugs of malignant transformation related genes |
| Identification of chemicals and drugs interact with genes involved in malignant transfromation |
| (DGIdb 4.0) |
| Entrez ID | Symbol | Category | Interaction Types | Drug Claim Name | Drug Name | PMIDs |
| 7416 | VDAC1 | NA | VDA-1102 topical ointment | |||
| 7416 | VDAC1 | NA | OLESOXIME | OLESOXIME |
| Page: 1 |

Copyright 2023-Present -The University of Texas Health Science Center at Houston |