
|
|||||
|
 | |
| |
| |
| |
| |
| |
|
Gene: VCX3A |
Gene summary for VCX3A |
| Gene information | Species | Human | Gene symbol | VCX3A | Gene ID | 51481 |
| Gene name | variable charge X-linked 3A | |
| Gene Alias | VCX-8r | |
| Cytomap | Xp22.31 | |
| Gene Type | protein-coding | GO ID | GO:0007275 | UniProtAcc | Q9NNX9 |
Top |
Malignant transformation analysis |
| Identification of the aberrant gene expression in precancerous and cancerous lesions by comparing the gene expression of stem-like cells in diseased tissues with normal stem cells |
| Entrez ID | Symbol | Replicates | Species | Organ | Tissue | Adj P-value | Log2FC | Malignancy |
| 51481 | VCX3A | HCC2 | Human | Liver | HCC | 5.11e-07 | 2.06e+00 | 0.5341 |
| 51481 | VCX3A | S014 | Human | Liver | HCC | 1.10e-15 | 8.04e-01 | 0.2254 |
| 51481 | VCX3A | S015 | Human | Liver | HCC | 1.71e-04 | 2.98e-01 | 0.2375 |
| 51481 | VCX3A | S016 | Human | Liver | HCC | 2.63e-03 | 2.97e-01 | 0.2243 |
| Page: 1 |
| Tissue | Expression Dynamics | Abbreviation |
| Liver | 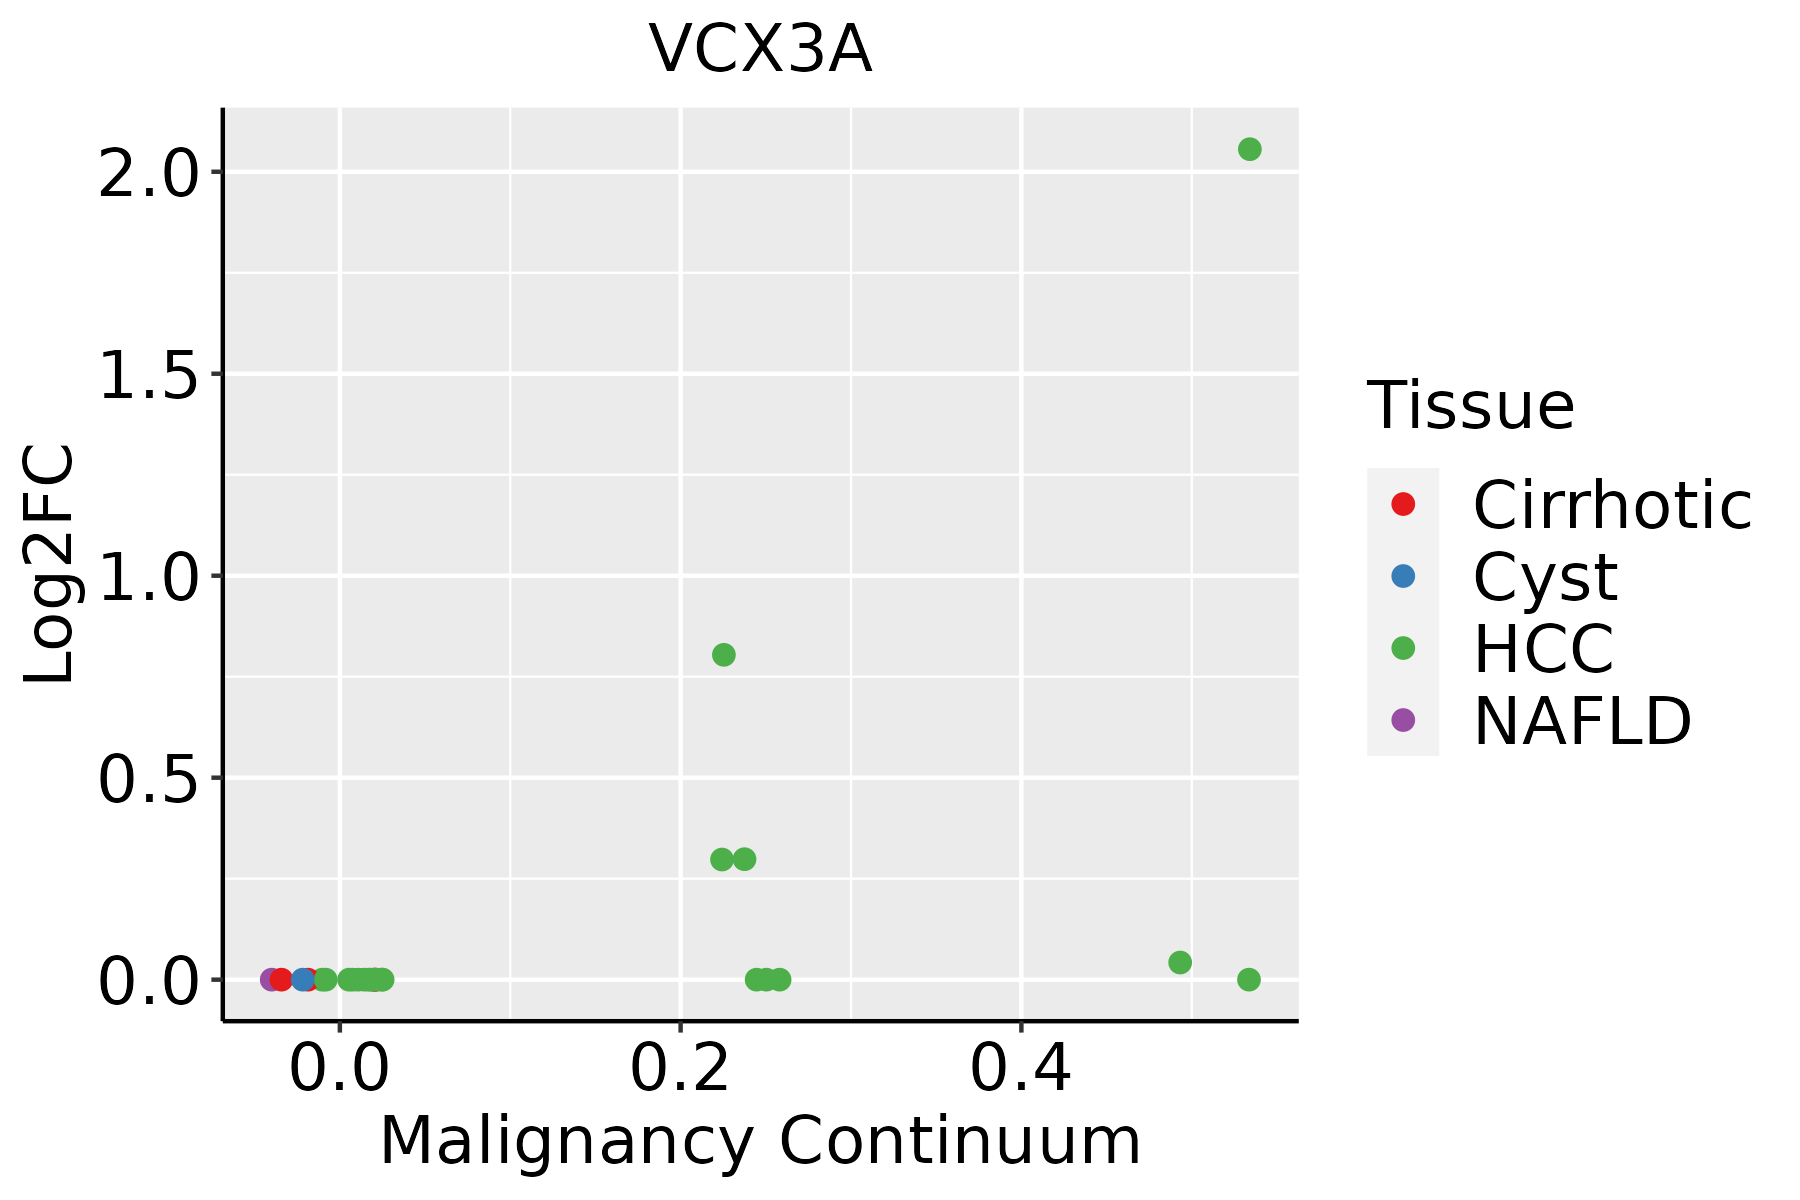 | HCC: Hepatocellular carcinoma |
| NAFLD: Non-alcoholic fatty liver disease |
| ∗log2FC in expression of this searched gene in stem-like cells from each diseased tissue sample relative to stem-like cells in normal samples in each tissue plotted against the malignancy continuum. Samples are colored based on if they are from different disease stage. |
Top |
Malignant transformation related pathway analysis |
| Find out the enriched GO biological processes and KEGG pathways involved in transition from healthy to precancer to cancer |
| Tissue | Disease Stage | Enriched GO biological Processes |
| Colorectum | AD |  |
| Colorectum | SER |  |
| Colorectum | MSS |  |
| Colorectum | MSI-H |  |
| Colorectum | FAP |  |
| ∗Top 15 enriched GO BP terms are showed in the bar plot of each disease state in each tissue. Each row represents a significant GO biological process which is colored according to the -log10(p.adjust). |
| Page: 1 2 3 4 5 6 7 8 9 |
| GO ID | Tissue | Disease Stage | Description | Gene Ratio | Bg Ratio | pvalue | p.adjust | Count |
| Page: 1 |
| Pathway ID | Tissue | Disease Stage | Description | Gene Ratio | Bg Ratio | pvalue | p.adjust | qvalue | Count |
| Page: 1 |
Top |
Cell-cell communication analysis |
| Identification of potential cell-cell interactions between two cell types and their ligand-receptor pairs for different disease states |
| Ligand | Receptor | LRpair | Pathway | Tissue | Disease Stage |
| Page: 1 |
Top |
Single-cell gene regulatory network inference analysis |
| Find out the significant the regulons (TFs) and the target genes of each regulon across cell types for different disease states |
| TF | Cell Type | Tissue | Disease Stage | Target Gene | RSS | Regulon Activity |
| ∗The dot plots of a searched regulon are shown for all cell subpopulations in each disease state of each tissue based on the regulon specific score inferred using pySCENIC and by calculating the average expression. |
| Page: 1 |
Top |
Somatic mutation of malignant transformation related genes |
| Annotation of somatic variants for genes involved in malignant transformation |
| Hugo Symbol | Variant Class | Variant Classification | dbSNP RS | HGVSc | HGVSp | HGVSp Short | SWISSPROT | BIOTYPE | SIFT | PolyPhen | Tumor Sample Barcode | Tissue | Histology | Sex | Age | Stage | Therapy Types | Drugs | Outcome |
| VCX3A | SNV | Missense_Mutation | novel | c.174N>T | p.Lys58Asn | p.K58N | Q9NNX9 | protein_coding | deleterious_low_confidence(0.01) | benign(0.261) | TCGA-A2-A04P-01 | Breast | breast invasive carcinoma | Female | <65 | III/IV | Chemotherapy | taxol | PD |
| VCX3A | SNV | Missense_Mutation | rs75344159 | c.491N>C | p.Leu164Pro | p.L164P | Q9NNX9 | protein_coding | tolerated(0.06) | possibly_damaging(0.449) | TCGA-A2-A0EX-01 | Breast | breast invasive carcinoma | Female | <65 | I/II | Hormone Therapy | tamoxiphen | SD |
| VCX3A | SNV | Missense_Mutation | novel | c.431T>C | p.Leu144Pro | p.L144P | Q9NNX9 | protein_coding | tolerated(0.1) | benign(0.005) | TCGA-AO-A128-01 | Breast | breast invasive carcinoma | Female | <65 | I/II | Chemotherapy | doxorubicin | SD |
| VCX3A | SNV | Missense_Mutation | novel | c.202N>A | p.Glu68Lys | p.E68K | Q9NNX9 | protein_coding | tolerated_low_confidence(0.08) | benign(0.026) | TCGA-BH-A0B6-01 | Breast | breast invasive carcinoma | Female | <65 | I/II | Unknown | Unknown | SD |
| VCX3A | SNV | Missense_Mutation | novel | c.156N>C | p.Lys52Asn | p.K52N | Q9NNX9 | protein_coding | deleterious_low_confidence(0) | possibly_damaging(0.895) | TCGA-EW-A1OV-01 | Breast | breast invasive carcinoma | Female | <65 | I/II | Chemotherapy | epirubicin | SD |
| VCX3A | SNV | Missense_Mutation | novel | c.281C>A | p.Pro94Gln | p.P94Q | Q9NNX9 | protein_coding | deleterious(0.01) | benign(0.19) | TCGA-EA-A410-01 | Cervix | cervical & endocervical cancer | Female | <65 | I/II | Unknown | Unknown | SD |
| VCX3A | SNV | Missense_Mutation | novel | c.202N>A | p.Glu68Lys | p.E68K | Q9NNX9 | protein_coding | tolerated_low_confidence(0.08) | benign(0.026) | TCGA-VS-A9UH-01 | Cervix | cervical & endocervical cancer | Female | <65 | I/II | Chemotherapy | cisplatin | CR |
| VCX3A | SNV | Missense_Mutation | novel | c.200N>T | p.Ala67Val | p.A67V | Q9NNX9 | protein_coding | deleterious_low_confidence(0.01) | benign(0.108) | TCGA-4T-AA8H-01 | Colorectum | colon adenocarcinoma | Female | <65 | I/II | Unknown | Unknown | SD |
| VCX3A | SNV | Missense_Mutation | novel | c.215N>T | p.Ala72Val | p.A72V | Q9NNX9 | protein_coding | deleterious_low_confidence(0) | possibly_damaging(0.582) | TCGA-A6-5665-01 | Colorectum | colon adenocarcinoma | Female | >=65 | I/II | Unknown | Unknown | PD |
| VCX3A | SNV | Missense_Mutation | novel | c.215C>T | p.Ala72Val | p.A72V | Q9NNX9 | protein_coding | deleterious_low_confidence(0) | possibly_damaging(0.582) | TCGA-A5-A0G1-01 | Endometrium | uterine corpus endometrioid carcinoma | Female | >=65 | I/II | Unknown | Unknown | SD |
| Page: 1 2 3 |
Top |
Related drugs of malignant transformation related genes |
| Identification of chemicals and drugs interact with genes involved in malignant transfromation |
| (DGIdb 4.0) |
| Entrez ID | Symbol | Category | Interaction Types | Drug Claim Name | Drug Name | PMIDs |
| Page: 1 |

Copyright 2023-Present -The University of Texas Health Science Center at Houston |