
|
|||||
|
 | |
| |
| |
| |
| |
| |
|
Gene: VCPKMT |
Gene summary for VCPKMT |
| Gene information | Species | Human | Gene symbol | VCPKMT | Gene ID | 79609 |
| Gene name | valosin containing protein lysine methyltransferase | |
| Gene Alias | C14orf138 | |
| Cytomap | 14q21.3 | |
| Gene Type | protein-coding | GO ID | GO:0006464 | UniProtAcc | Q9H867 |
Top |
Malignant transformation analysis |
| Identification of the aberrant gene expression in precancerous and cancerous lesions by comparing the gene expression of stem-like cells in diseased tissues with normal stem cells |
| Entrez ID | Symbol | Replicates | Species | Organ | Tissue | Adj P-value | Log2FC | Malignancy |
| 79609 | VCPKMT | LZE4T | Human | Esophagus | ESCC | 6.81e-08 | 2.57e-01 | 0.0811 |
| 79609 | VCPKMT | LZE7T | Human | Esophagus | ESCC | 1.87e-04 | 1.53e-01 | 0.0667 |
| 79609 | VCPKMT | LZE8T | Human | Esophagus | ESCC | 3.54e-03 | 1.00e-01 | 0.067 |
| 79609 | VCPKMT | LZE20T | Human | Esophagus | ESCC | 7.74e-03 | 1.93e-01 | 0.0662 |
| 79609 | VCPKMT | LZE24T | Human | Esophagus | ESCC | 4.42e-11 | 2.70e-01 | 0.0596 |
| 79609 | VCPKMT | LZE21T | Human | Esophagus | ESCC | 6.83e-03 | 2.88e-01 | 0.0655 |
| 79609 | VCPKMT | P2T-E | Human | Esophagus | ESCC | 6.86e-17 | 3.52e-01 | 0.1177 |
| 79609 | VCPKMT | P4T-E | Human | Esophagus | ESCC | 1.56e-18 | 5.32e-01 | 0.1323 |
| 79609 | VCPKMT | P5T-E | Human | Esophagus | ESCC | 1.16e-06 | 1.47e-01 | 0.1327 |
| 79609 | VCPKMT | P8T-E | Human | Esophagus | ESCC | 1.16e-11 | 1.97e-01 | 0.0889 |
| 79609 | VCPKMT | P9T-E | Human | Esophagus | ESCC | 2.29e-07 | 1.11e-01 | 0.1131 |
| 79609 | VCPKMT | P10T-E | Human | Esophagus | ESCC | 1.90e-23 | 4.40e-01 | 0.116 |
| 79609 | VCPKMT | P11T-E | Human | Esophagus | ESCC | 5.07e-07 | 2.57e-01 | 0.1426 |
| 79609 | VCPKMT | P12T-E | Human | Esophagus | ESCC | 2.08e-22 | 5.54e-01 | 0.1122 |
| 79609 | VCPKMT | P15T-E | Human | Esophagus | ESCC | 5.03e-30 | 7.98e-01 | 0.1149 |
| 79609 | VCPKMT | P16T-E | Human | Esophagus | ESCC | 2.52e-19 | 3.42e-01 | 0.1153 |
| 79609 | VCPKMT | P20T-E | Human | Esophagus | ESCC | 3.59e-14 | 3.70e-01 | 0.1124 |
| 79609 | VCPKMT | P21T-E | Human | Esophagus | ESCC | 2.17e-15 | 1.31e-01 | 0.1617 |
| 79609 | VCPKMT | P22T-E | Human | Esophagus | ESCC | 2.67e-11 | 2.65e-01 | 0.1236 |
| 79609 | VCPKMT | P23T-E | Human | Esophagus | ESCC | 1.97e-11 | 3.10e-01 | 0.108 |
| Page: 1 2 3 |
| Tissue | Expression Dynamics | Abbreviation |
| Esophagus | 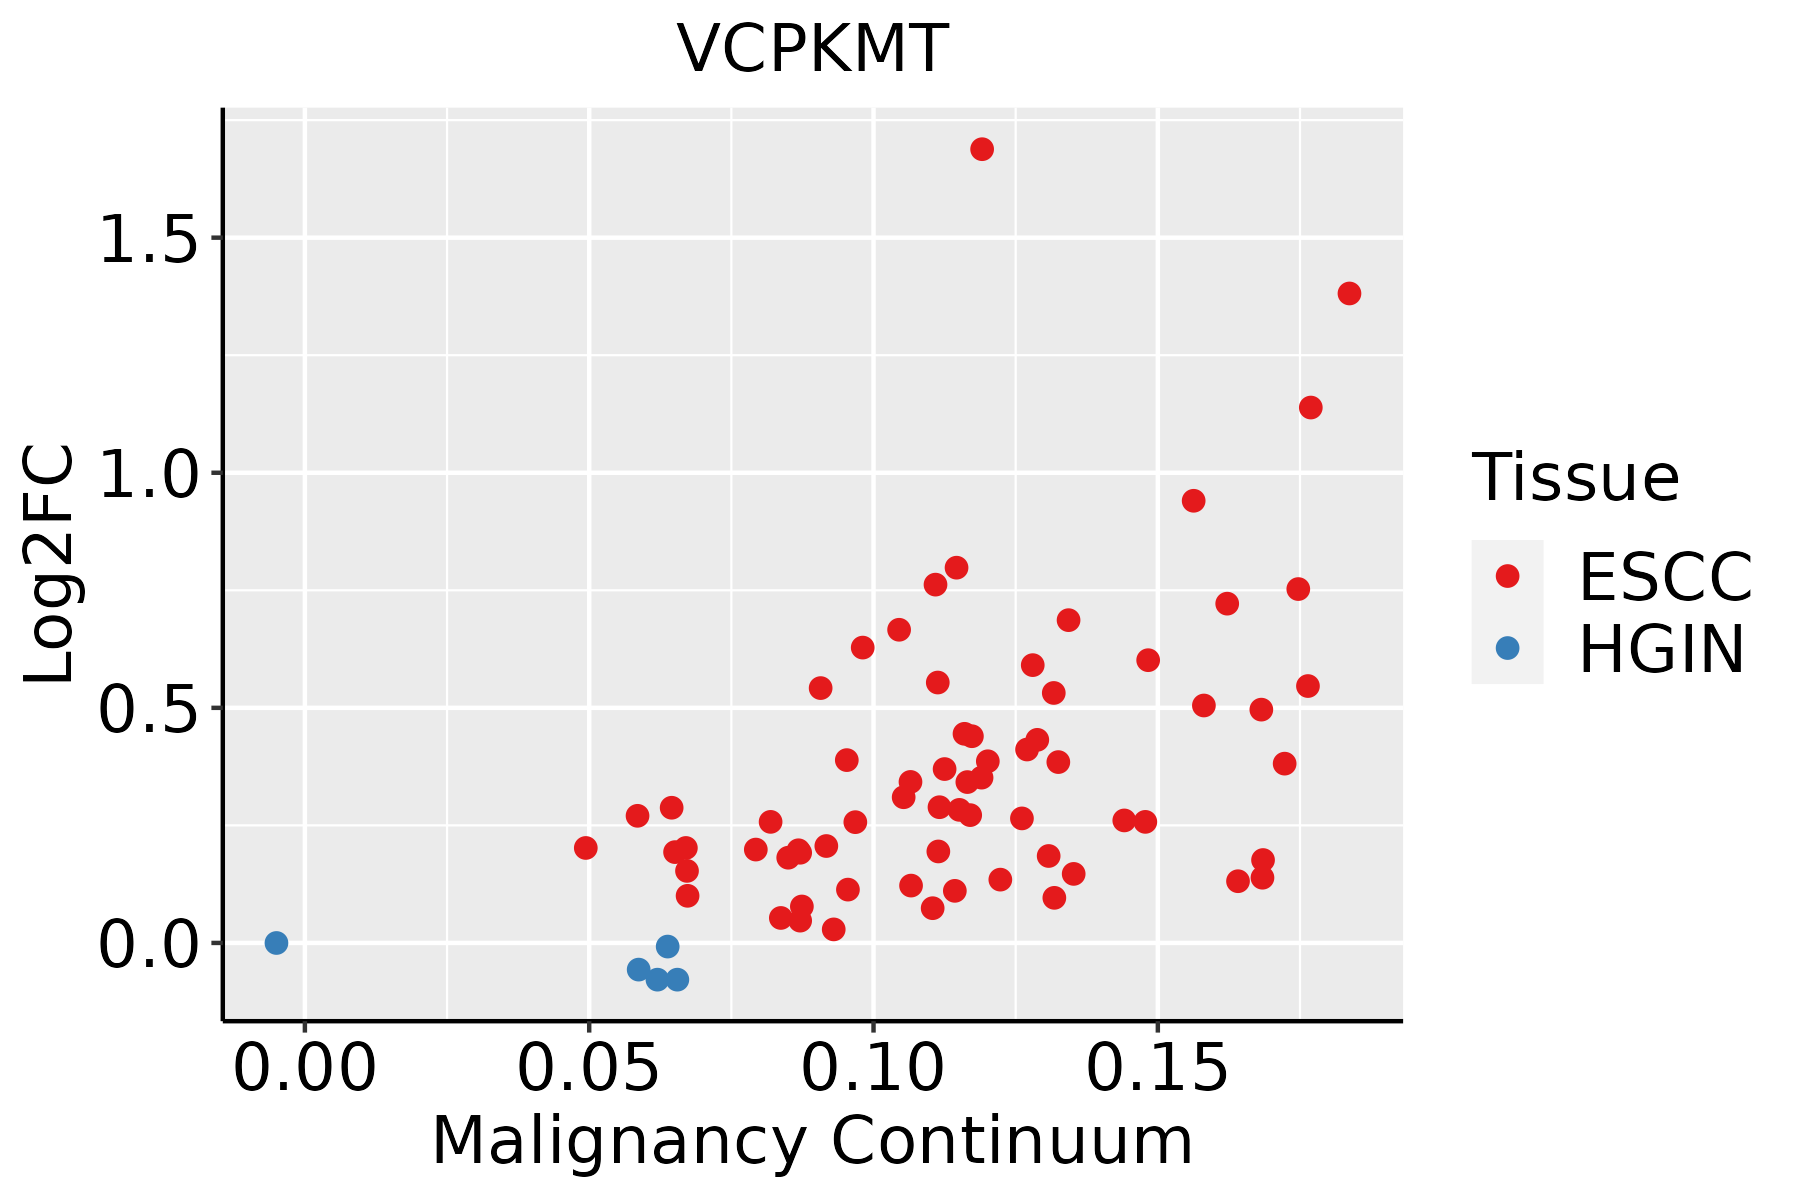 | ESCC: Esophageal squamous cell carcinoma |
| HGIN: High-grade intraepithelial neoplasias | ||
| LGIN: Low-grade intraepithelial neoplasias |
| ∗log2FC in expression of this searched gene in stem-like cells from each diseased tissue sample relative to stem-like cells in normal samples in each tissue plotted against the malignancy continuum. Samples are colored based on if they are from different disease stage. |
Top |
Malignant transformation related pathway analysis |
| Find out the enriched GO biological processes and KEGG pathways involved in transition from healthy to precancer to cancer |
| Tissue | Disease Stage | Enriched GO biological Processes |
| Colorectum | AD |  |
| Colorectum | SER |  |
| Colorectum | MSS |  |
| Colorectum | MSI-H |  |
| Colorectum | FAP |  |
| ∗Top 15 enriched GO BP terms are showed in the bar plot of each disease state in each tissue. Each row represents a significant GO biological process which is colored according to the -log10(p.adjust). |
| Page: 1 2 3 4 5 6 7 8 9 |
| GO ID | Tissue | Disease Stage | Description | Gene Ratio | Bg Ratio | pvalue | p.adjust | Count |
| GO:001820514 | Esophagus | ESCC | peptidyl-lysine modification | 259/8552 | 376/18723 | 3.90e-20 | 5.26e-18 | 259 |
| GO:00434143 | Esophagus | ESCC | macromolecule methylation | 199/8552 | 316/18723 | 3.44e-10 | 9.57e-09 | 199 |
| GO:00322592 | Esophagus | ESCC | methylation | 222/8552 | 364/18723 | 2.26e-09 | 5.09e-08 | 222 |
| GO:000647914 | Esophagus | ESCC | protein methylation | 115/8552 | 181/18723 | 9.07e-07 | 1.16e-05 | 115 |
| GO:000821314 | Esophagus | ESCC | protein alkylation | 115/8552 | 181/18723 | 9.07e-07 | 1.16e-05 | 115 |
| GO:0051346110 | Esophagus | ESCC | negative regulation of hydrolase activity | 208/8552 | 379/18723 | 1.76e-04 | 1.14e-03 | 208 |
| GO:001802214 | Esophagus | ESCC | peptidyl-lysine methylation | 79/8552 | 131/18723 | 5.17e-04 | 2.86e-03 | 79 |
| GO:00434627 | Esophagus | ESCC | regulation of ATPase activity | 30/8552 | 46/18723 | 5.91e-03 | 2.18e-02 | 30 |
| GO:00180231 | Esophagus | ESCC | peptidyl-lysine trimethylation | 31/8552 | 50/18723 | 1.48e-02 | 4.79e-02 | 31 |
| Page: 1 |
| Pathway ID | Tissue | Disease Stage | Description | Gene Ratio | Bg Ratio | pvalue | p.adjust | qvalue | Count |
| Page: 1 |
Top |
Cell-cell communication analysis |
| Identification of potential cell-cell interactions between two cell types and their ligand-receptor pairs for different disease states |
| Ligand | Receptor | LRpair | Pathway | Tissue | Disease Stage |
| Page: 1 |
Top |
Single-cell gene regulatory network inference analysis |
| Find out the significant the regulons (TFs) and the target genes of each regulon across cell types for different disease states |
| TF | Cell Type | Tissue | Disease Stage | Target Gene | RSS | Regulon Activity |
| ∗The dot plots of a searched regulon are shown for all cell subpopulations in each disease state of each tissue based on the regulon specific score inferred using pySCENIC and by calculating the average expression. |
| Page: 1 |
Top |
Somatic mutation of malignant transformation related genes |
| Annotation of somatic variants for genes involved in malignant transformation |
| Hugo Symbol | Variant Class | Variant Classification | dbSNP RS | HGVSc | HGVSp | HGVSp Short | SWISSPROT | BIOTYPE | SIFT | PolyPhen | Tumor Sample Barcode | Tissue | Histology | Sex | Age | Stage | Therapy Types | Drugs | Outcome |
| VCPKMT | SNV | Missense_Mutation | rs780360587 | c.538A>G | p.Lys180Glu | p.K180E | Q9H867 | protein_coding | tolerated(0.38) | benign(0.037) | TCGA-A6-3809-01 | Colorectum | colon adenocarcinoma | Female | >=65 | I/II | Unknown | Unknown | SD |
| VCPKMT | SNV | Missense_Mutation | novel | c.587N>G | p.Phe196Cys | p.F196C | Q9H867 | protein_coding | deleterious(0) | benign(0.15) | TCGA-AZ-4315-01 | Colorectum | colon adenocarcinoma | Male | <65 | I/II | Unknown | Unknown | SD |
| VCPKMT | SNV | Missense_Mutation | novel | c.374A>C | p.Lys125Thr | p.K125T | Q9H867 | protein_coding | deleterious(0.02) | possibly_damaging(0.864) | TCGA-CA-6717-01 | Colorectum | colon adenocarcinoma | Male | <65 | I/II | Chemotherapy | oxaliplatin | CR |
| VCPKMT | SNV | Missense_Mutation | rs750264926 | c.674C>T | p.Ser225Leu | p.S225L | Q9H867 | protein_coding | tolerated_low_confidence(0.12) | benign(0.003) | TCGA-EI-6917-01 | Colorectum | rectum adenocarcinoma | Male | <65 | III/IV | Chemotherapy | 5fluorouracil+oxaciplatina+l-folinian | SD |
| VCPKMT | SNV | Missense_Mutation | novel | c.680N>G | p.Phe227Cys | p.F227C | Q9H867 | protein_coding | tolerated_low_confidence(0.08) | benign(0) | TCGA-AJ-A5DW-01 | Endometrium | uterine corpus endometrioid carcinoma | Female | <65 | I/II | Unknown | Unknown | SD |
| VCPKMT | SNV | Missense_Mutation | rs750264926 | c.674N>T | p.Ser225Leu | p.S225L | Q9H867 | protein_coding | tolerated_low_confidence(0.12) | benign(0.003) | TCGA-EO-A22X-01 | Endometrium | uterine corpus endometrioid carcinoma | Female | <65 | III/IV | Unspecific | Carboplatin | Complete Response |
| VCPKMT | SNV | Missense_Mutation | rs757113813 | c.686N>T | p.Ser229Leu | p.S229L | Q9H867 | protein_coding | deleterious_low_confidence(0) | benign(0.07) | TCGA-EO-A3B0-01 | Endometrium | uterine corpus endometrioid carcinoma | Female | <65 | III/IV | Unknown | Unknown | SD |
| VCPKMT | SNV | Missense_Mutation | rs779103078 | c.632N>A | p.Arg211Gln | p.R211Q | Q9H867 | protein_coding | tolerated(0.05) | possibly_damaging(0.852) | TCGA-EY-A1GD-01 | Endometrium | uterine corpus endometrioid carcinoma | Female | <65 | I/II | Unknown | Unknown | SD |
| VCPKMT | insertion | Frame_Shift_Ins | novel | c.601_602insA | p.Ile201AsnfsTer7 | p.I201Nfs*7 | Q9H867 | protein_coding | TCGA-AP-A1DR-01 | Endometrium | uterine corpus endometrioid carcinoma | Female | <65 | III/IV | Chemotherapy | cisplatin | SD | ||
| VCPKMT | insertion | Frame_Shift_Ins | novel | c.601dupA | p.Ile201AsnfsTer7 | p.I201Nfs*7 | Q9H867 | protein_coding | TCGA-AX-A1CE-01 | Endometrium | uterine corpus endometrioid carcinoma | Female | <65 | I/II | Unspecific | Paclitaxel | SD |
| Page: 1 2 |
Top |
Related drugs of malignant transformation related genes |
| Identification of chemicals and drugs interact with genes involved in malignant transfromation |
| (DGIdb 4.0) |
| Entrez ID | Symbol | Category | Interaction Types | Drug Claim Name | Drug Name | PMIDs |
| Page: 1 |

Copyright 2023-Present -The University of Texas Health Science Center at Houston |