
|
|||||
|
 | |
| |
| |
| |
| |
| |
|
Gene: VCPIP1 |
Gene summary for VCPIP1 |
| Gene information | Species | Human | Gene symbol | VCPIP1 | Gene ID | 80124 |
| Gene name | valosin containing protein interacting protein 1 | |
| Gene Alias | DUBA3 | |
| Cytomap | 8q13.1 | |
| Gene Type | protein-coding | GO ID | GO:0000278 | UniProtAcc | Q96JH7 |
Top |
Malignant transformation analysis |
| Identification of the aberrant gene expression in precancerous and cancerous lesions by comparing the gene expression of stem-like cells in diseased tissues with normal stem cells |
| Entrez ID | Symbol | Replicates | Species | Organ | Tissue | Adj P-value | Log2FC | Malignancy |
| 80124 | VCPIP1 | LZE2T | Human | Esophagus | ESCC | 6.25e-04 | 3.70e-01 | 0.082 |
| 80124 | VCPIP1 | LZE4T | Human | Esophagus | ESCC | 1.23e-13 | 2.91e-01 | 0.0811 |
| 80124 | VCPIP1 | LZE8T | Human | Esophagus | ESCC | 1.18e-07 | 2.41e-01 | 0.067 |
| 80124 | VCPIP1 | LZE20T | Human | Esophagus | ESCC | 1.07e-02 | 1.19e-01 | 0.0662 |
| 80124 | VCPIP1 | LZE24T | Human | Esophagus | ESCC | 3.13e-10 | 2.21e-01 | 0.0596 |
| 80124 | VCPIP1 | P2T-E | Human | Esophagus | ESCC | 6.36e-08 | 2.15e-01 | 0.1177 |
| 80124 | VCPIP1 | P4T-E | Human | Esophagus | ESCC | 9.71e-07 | 2.22e-01 | 0.1323 |
| 80124 | VCPIP1 | P5T-E | Human | Esophagus | ESCC | 7.11e-08 | 1.01e-01 | 0.1327 |
| 80124 | VCPIP1 | P8T-E | Human | Esophagus | ESCC | 2.88e-09 | 2.00e-01 | 0.0889 |
| 80124 | VCPIP1 | P9T-E | Human | Esophagus | ESCC | 2.88e-06 | 1.63e-01 | 0.1131 |
| 80124 | VCPIP1 | P10T-E | Human | Esophagus | ESCC | 3.06e-10 | 2.08e-01 | 0.116 |
| 80124 | VCPIP1 | P11T-E | Human | Esophagus | ESCC | 3.32e-09 | 2.63e-01 | 0.1426 |
| 80124 | VCPIP1 | P12T-E | Human | Esophagus | ESCC | 5.07e-10 | 2.65e-01 | 0.1122 |
| 80124 | VCPIP1 | P15T-E | Human | Esophagus | ESCC | 3.29e-08 | 2.55e-01 | 0.1149 |
| 80124 | VCPIP1 | P16T-E | Human | Esophagus | ESCC | 1.07e-15 | 3.29e-01 | 0.1153 |
| 80124 | VCPIP1 | P17T-E | Human | Esophagus | ESCC | 1.13e-05 | 2.84e-01 | 0.1278 |
| 80124 | VCPIP1 | P20T-E | Human | Esophagus | ESCC | 1.09e-03 | 1.33e-01 | 0.1124 |
| 80124 | VCPIP1 | P21T-E | Human | Esophagus | ESCC | 5.77e-09 | 2.27e-01 | 0.1617 |
| 80124 | VCPIP1 | P22T-E | Human | Esophagus | ESCC | 6.47e-06 | 1.24e-01 | 0.1236 |
| 80124 | VCPIP1 | P23T-E | Human | Esophagus | ESCC | 8.15e-13 | 2.59e-01 | 0.108 |
| Page: 1 2 3 4 |
| Tissue | Expression Dynamics | Abbreviation |
| Esophagus | 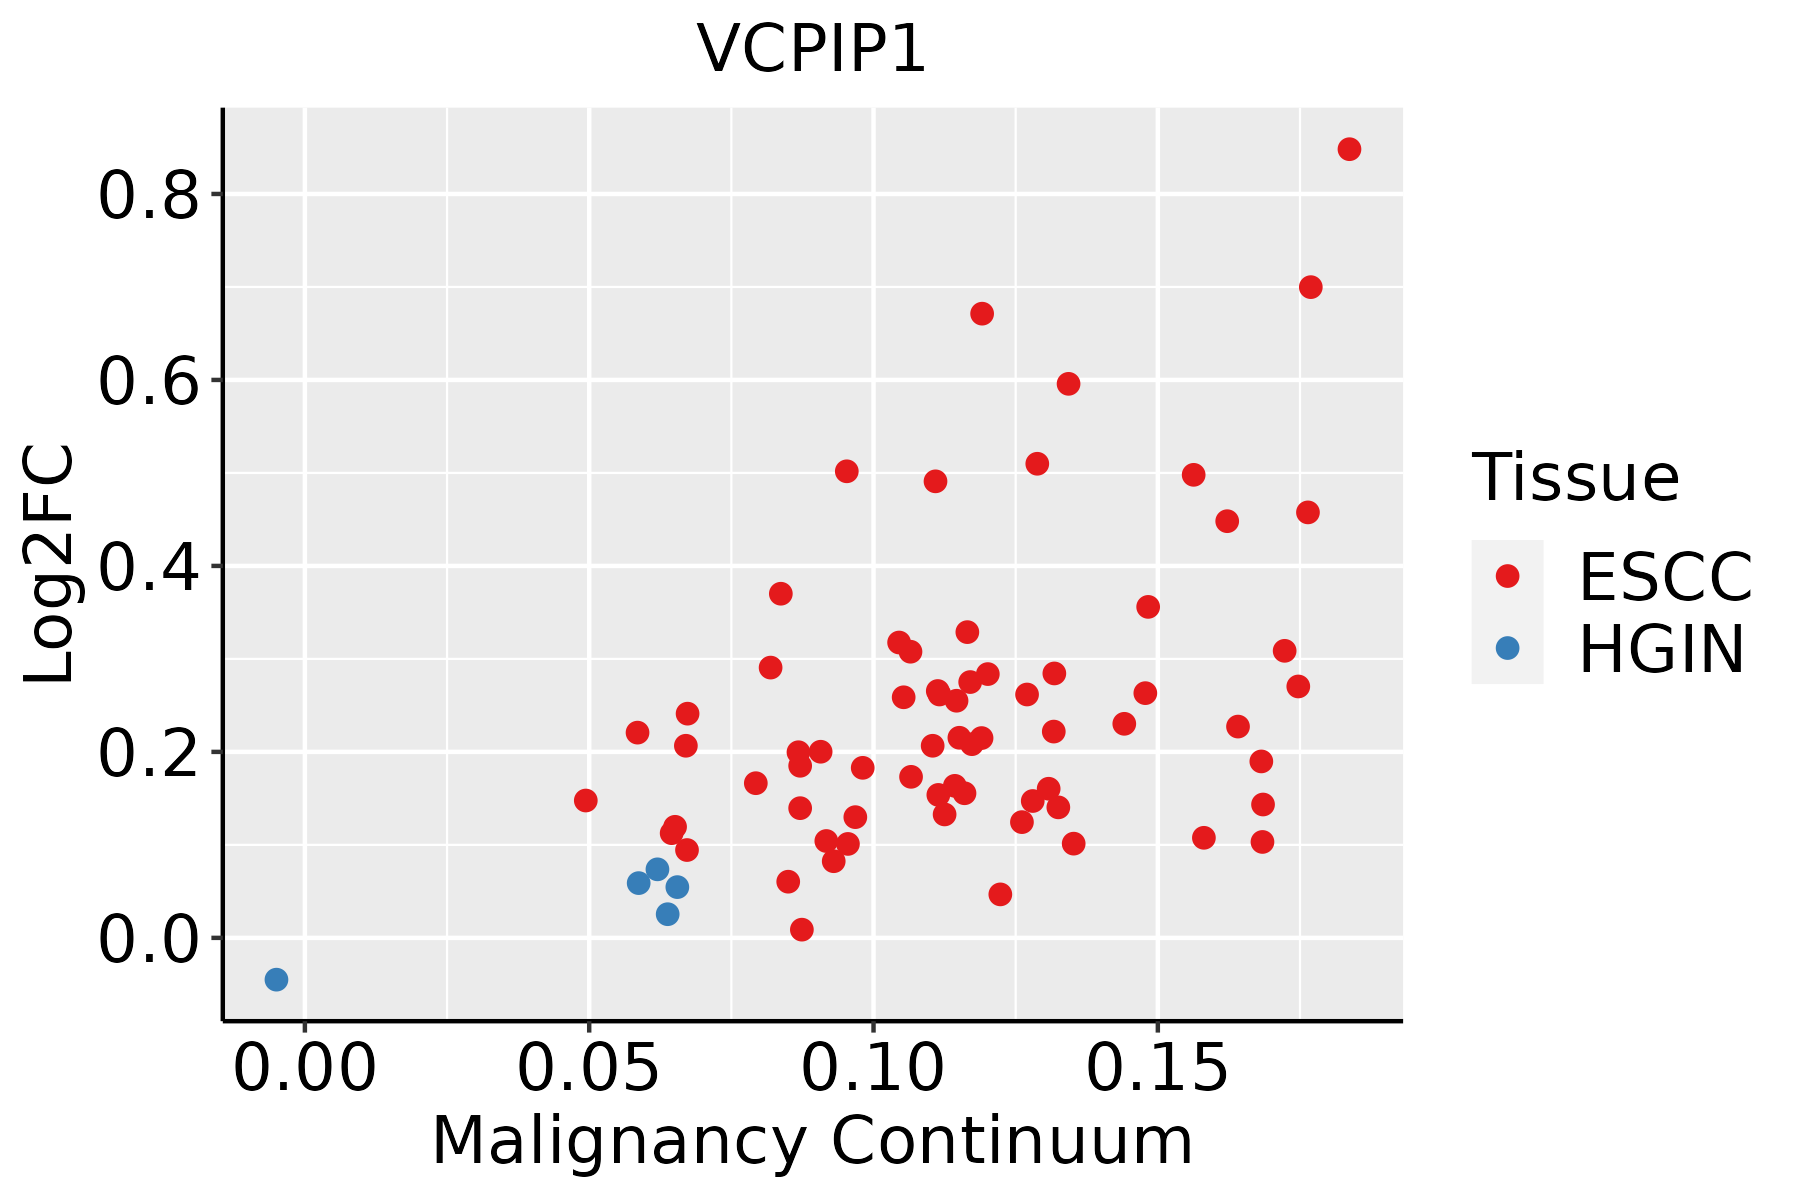 | ESCC: Esophageal squamous cell carcinoma |
| HGIN: High-grade intraepithelial neoplasias | ||
| LGIN: Low-grade intraepithelial neoplasias | ||
| Liver | 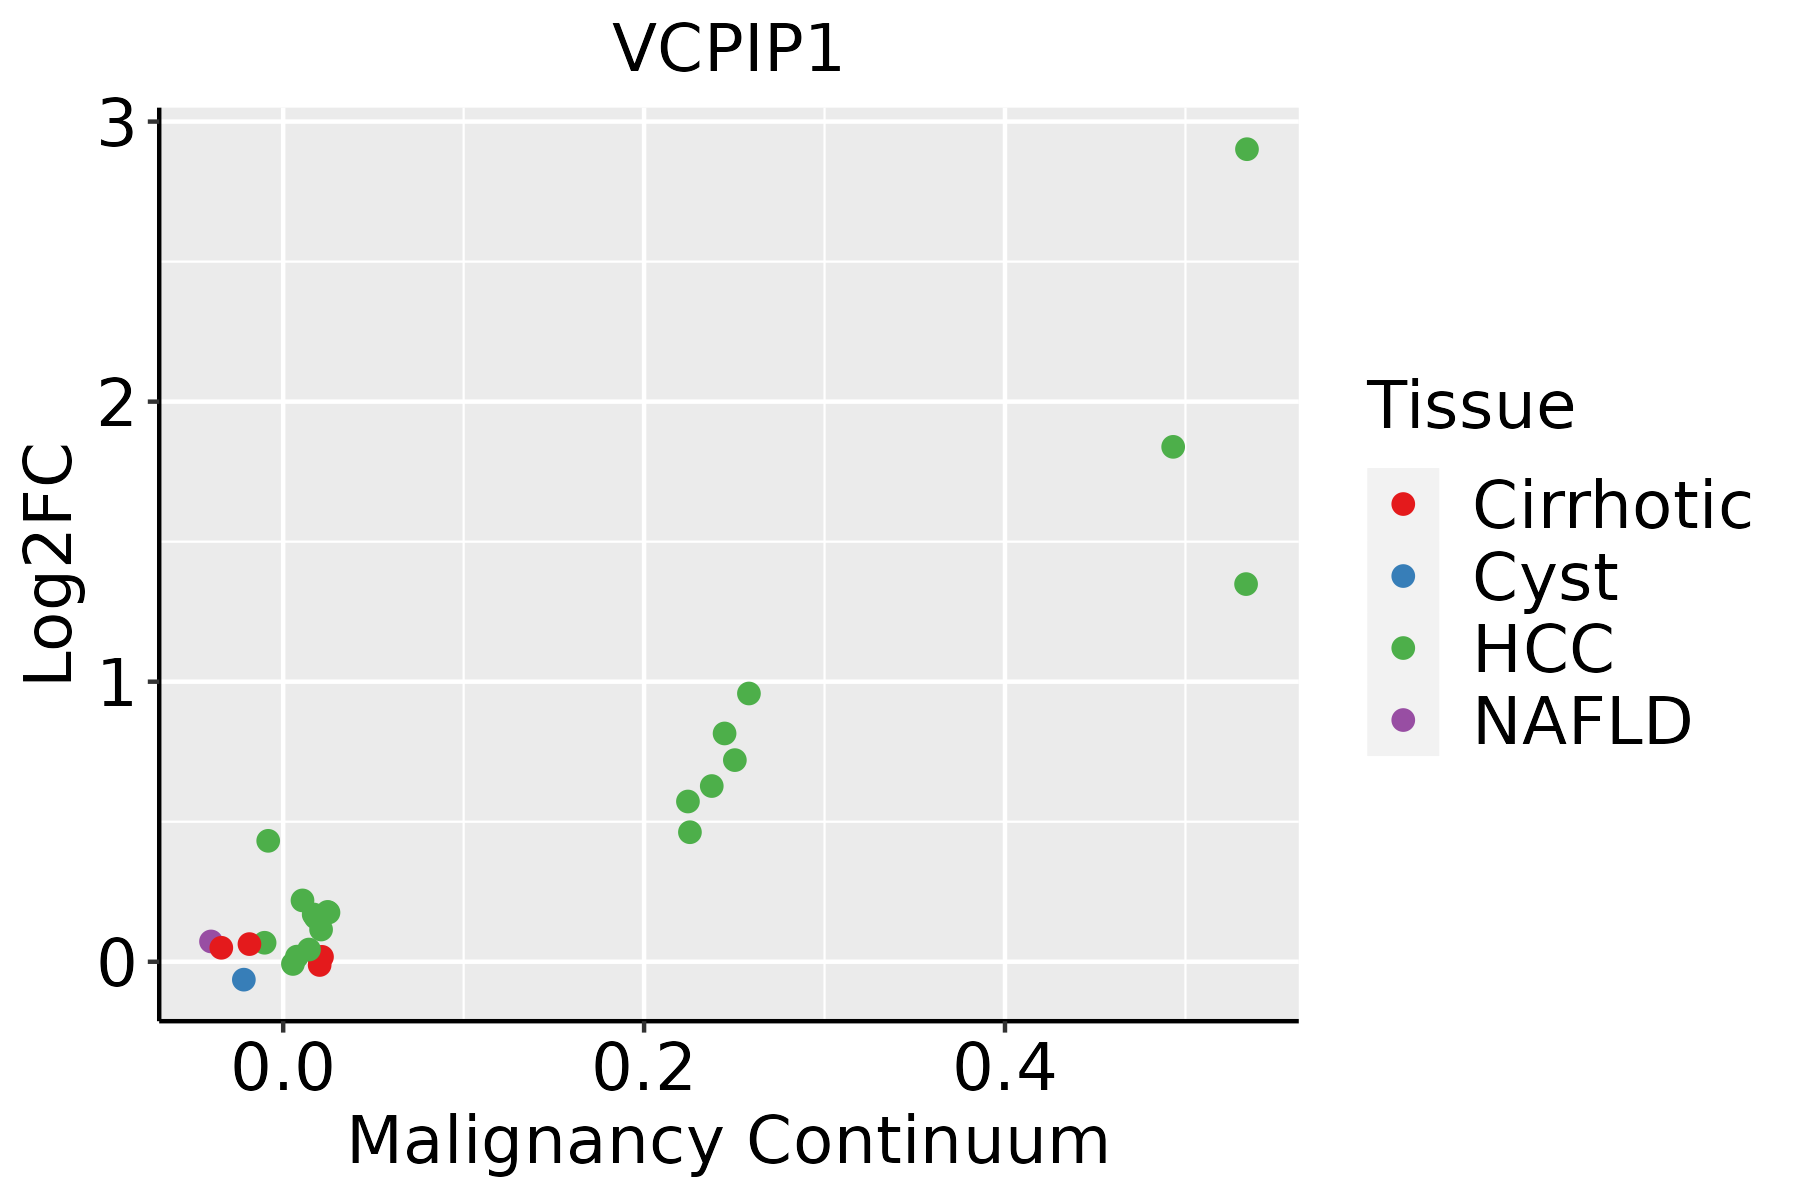 | HCC: Hepatocellular carcinoma |
| NAFLD: Non-alcoholic fatty liver disease |
| ∗log2FC in expression of this searched gene in stem-like cells from each diseased tissue sample relative to stem-like cells in normal samples in each tissue plotted against the malignancy continuum. Samples are colored based on if they are from different disease stage. |
Top |
Malignant transformation related pathway analysis |
| Find out the enriched GO biological processes and KEGG pathways involved in transition from healthy to precancer to cancer |
| Tissue | Disease Stage | Enriched GO biological Processes |
| Colorectum | AD |  |
| Colorectum | SER |  |
| Colorectum | MSS |  |
| Colorectum | MSI-H |  |
| Colorectum | FAP |  |
| ∗Top 15 enriched GO BP terms are showed in the bar plot of each disease state in each tissue. Each row represents a significant GO biological process which is colored according to the -log10(p.adjust). |
| Page: 1 2 3 4 5 6 7 8 9 |
| GO ID | Tissue | Disease Stage | Description | Gene Ratio | Bg Ratio | pvalue | p.adjust | Count |
| GO:003450211 | Esophagus | ESCC | protein localization to chromosome | 70/8552 | 92/18723 | 2.54e-09 | 5.64e-08 | 70 |
| GO:000702914 | Esophagus | ESCC | endoplasmic reticulum organization | 65/8552 | 87/18723 | 3.28e-08 | 6.08e-07 | 65 |
| GO:00482844 | Esophagus | ESCC | organelle fusion | 94/8552 | 141/18723 | 3.72e-07 | 5.16e-06 | 94 |
| GO:00070308 | Esophagus | ESCC | Golgi organization | 101/8552 | 157/18723 | 1.78e-06 | 2.10e-05 | 101 |
| GO:00901743 | Esophagus | ESCC | organelle membrane fusion | 73/8552 | 110/18723 | 9.29e-06 | 8.88e-05 | 73 |
| GO:007064612 | Esophagus | ESCC | protein modification by small protein removal | 95/8552 | 157/18723 | 1.25e-04 | 8.56e-04 | 95 |
| GO:00610254 | Esophagus | ESCC | membrane fusion | 98/8552 | 163/18723 | 1.39e-04 | 9.41e-04 | 98 |
| GO:00483083 | Esophagus | ESCC | organelle inheritance | 14/8552 | 15/18723 | 1.47e-04 | 9.85e-04 | 14 |
| GO:00483133 | Esophagus | ESCC | Golgi inheritance | 14/8552 | 15/18723 | 1.47e-04 | 9.85e-04 | 14 |
| GO:00165793 | Esophagus | ESCC | protein deubiquitination | 79/8552 | 139/18723 | 5.23e-03 | 1.97e-02 | 79 |
| GO:0071168 | Esophagus | ESCC | protein localization to chromatin | 21/8552 | 31/18723 | 1.10e-02 | 3.70e-02 | 21 |
| GO:000702911 | Liver | HCC | endoplasmic reticulum organization | 64/7958 | 87/18723 | 3.92e-09 | 1.04e-07 | 64 |
| GO:00070302 | Liver | HCC | Golgi organization | 99/7958 | 157/18723 | 1.54e-07 | 2.85e-06 | 99 |
| GO:004828411 | Liver | HCC | organelle fusion | 84/7958 | 141/18723 | 3.13e-05 | 3.20e-04 | 84 |
| GO:00706461 | Liver | HCC | protein modification by small protein removal | 91/7958 | 157/18723 | 6.50e-05 | 5.92e-04 | 91 |
| GO:00345021 | Liver | HCC | protein localization to chromosome | 55/7958 | 92/18723 | 6.12e-04 | 3.82e-03 | 55 |
| GO:00165791 | Liver | HCC | protein deubiquitination | 78/7958 | 139/18723 | 8.13e-04 | 4.87e-03 | 78 |
| GO:00901741 | Liver | HCC | organelle membrane fusion | 63/7958 | 110/18723 | 1.24e-03 | 6.85e-03 | 63 |
| GO:0061025 | Liver | HCC | membrane fusion | 88/7958 | 163/18723 | 1.98e-03 | 1.00e-02 | 88 |
| GO:00483081 | Liver | HCC | organelle inheritance | 12/7958 | 15/18723 | 3.56e-03 | 1.59e-02 | 12 |
| Page: 1 2 |
| Pathway ID | Tissue | Disease Stage | Description | Gene Ratio | Bg Ratio | pvalue | p.adjust | qvalue | Count |
| Page: 1 |
Top |
Cell-cell communication analysis |
| Identification of potential cell-cell interactions between two cell types and their ligand-receptor pairs for different disease states |
| Ligand | Receptor | LRpair | Pathway | Tissue | Disease Stage |
| Page: 1 |
Top |
Single-cell gene regulatory network inference analysis |
| Find out the significant the regulons (TFs) and the target genes of each regulon across cell types for different disease states |
| TF | Cell Type | Tissue | Disease Stage | Target Gene | RSS | Regulon Activity |
| ∗The dot plots of a searched regulon are shown for all cell subpopulations in each disease state of each tissue based on the regulon specific score inferred using pySCENIC and by calculating the average expression. |
| Page: 1 |
Top |
Somatic mutation of malignant transformation related genes |
| Annotation of somatic variants for genes involved in malignant transformation |
| Hugo Symbol | Variant Class | Variant Classification | dbSNP RS | HGVSc | HGVSp | HGVSp Short | SWISSPROT | BIOTYPE | SIFT | PolyPhen | Tumor Sample Barcode | Tissue | Histology | Sex | Age | Stage | Therapy Types | Drugs | Outcome |
| VCPIP1 | SNV | Missense_Mutation | c.3417N>T | p.Arg1139Ser | p.R1139S | Q96JH7 | protein_coding | deleterious_low_confidence(0.01) | possibly_damaging(0.769) | TCGA-A1-A0SO-01 | Breast | breast invasive carcinoma | Female | >=65 | I/II | Chemotherapy | SD | ||
| VCPIP1 | SNV | Missense_Mutation | rs552540478 | c.1676N>G | p.Asp559Gly | p.D559G | Q96JH7 | protein_coding | deleterious(0.02) | possibly_damaging(0.587) | TCGA-A8-A09Z-01 | Breast | breast invasive carcinoma | Female | >=65 | I/II | Unknown | Unknown | SD |
| VCPIP1 | SNV | Missense_Mutation | novel | c.254N>G | p.Val85Gly | p.V85G | Q96JH7 | protein_coding | deleterious(0) | probably_damaging(0.987) | TCGA-AR-A1AP-01 | Breast | breast invasive carcinoma | Female | >=65 | I/II | Hormone Therapy | anastrozole | SD |
| VCPIP1 | SNV | Missense_Mutation | c.1067N>G | p.Ile356Ser | p.I356S | Q96JH7 | protein_coding | deleterious(0.01) | possibly_damaging(0.585) | TCGA-B6-A0RS-01 | Breast | breast invasive carcinoma | Female | <65 | I/II | Unknown | Unknown | PD | |
| VCPIP1 | SNV | Missense_Mutation | c.647N>C | p.Asp216Ala | p.D216A | Q96JH7 | protein_coding | deleterious(0) | probably_damaging(0.998) | TCGA-B6-A1KN-01 | Breast | breast invasive carcinoma | Female | <65 | III/IV | Unknown | Unknown | SD | |
| VCPIP1 | SNV | Missense_Mutation | c.226N>G | p.Arg76Gly | p.R76G | Q96JH7 | protein_coding | deleterious(0) | probably_damaging(0.982) | TCGA-C8-A1HM-01 | Breast | breast invasive carcinoma | Female | >=65 | I/II | Chemotherapy | doxorubicin | CR | |
| VCPIP1 | SNV | Missense_Mutation | novel | c.2787G>C | p.Lys929Asn | p.K929N | Q96JH7 | protein_coding | tolerated(0.1) | probably_damaging(0.981) | TCGA-C8-A8HQ-01 | Breast | breast invasive carcinoma | Female | <65 | I/II | Unknown | Unknown | SD |
| VCPIP1 | SNV | Missense_Mutation | c.475N>C | p.Asp159His | p.D159H | Q96JH7 | protein_coding | deleterious(0) | probably_damaging(0.997) | TCGA-D8-A1J8-01 | Breast | breast invasive carcinoma | Female | >=65 | I/II | Hormone Therapy | nolvadex | SD | |
| VCPIP1 | SNV | Missense_Mutation | c.621N>G | p.Cys207Trp | p.C207W | Q96JH7 | protein_coding | deleterious(0.01) | probably_damaging(0.945) | TCGA-D8-A1JT-01 | Breast | breast invasive carcinoma | Female | >=65 | I/II | Hormone Therapy | arimidex | SD | |
| VCPIP1 | SNV | Missense_Mutation | c.3631N>C | p.Glu1211Gln | p.E1211Q | Q96JH7 | protein_coding | tolerated_low_confidence(0.13) | benign(0.031) | TCGA-D8-A27G-01 | Breast | breast invasive carcinoma | Female | >=65 | I/II | Unknown | Unknown | SD |
| Page: 1 2 3 4 5 6 7 8 9 10 11 12 13 14 |
Top |
Related drugs of malignant transformation related genes |
| Identification of chemicals and drugs interact with genes involved in malignant transfromation |
| (DGIdb 4.0) |
| Entrez ID | Symbol | Category | Interaction Types | Drug Claim Name | Drug Name | PMIDs |
| Page: 1 |

Copyright 2023-Present -The University of Texas Health Science Center at Houston |