Schematic overview of the cellular and molecular mechanisms involved in the cancer progression, including the proposed cellular and molecular mechanisms in cancer cells trajectory. AT1: alveolar type 1 cells; AT2: alveolar type 2 cells; AAH: atypical adenomatous hyperplasia; AIS: adenocarcinoma in situ; MIA: minimally invasive adenocarcinoma; IA: invasive adenocarcinoma; EMT: epithelial-mesenchymal transition

Home

Download

Statistics

Help

Contact

Center for Computational Systems Medicine
leaf

Gene summary

leaf

Malignant transformation analysis

leaf

Malignant transformation related pathway analysis

leaf

Cell-cell communication analysis

leaf

Single-cell gene regulatory network inference analysis

leaf

Somatic mutation of malignant transformation related genes

leaf

Related drugs of malignant transformation related genes

Gene: VBP1

Gene summary for VBP1

check button Gene summary.

Gene informationSpeciesHuman
Gene symbol

VBP1

Gene ID

7411

Gene nameVHL binding protein 1
Gene AliasHIBBJ46
CytomapXq28
Gene Typeprotein-coding
GO ID

GO:0006457

UniProtAcc

D3DWY7


Top

Malignant transformation analysis

check button Identification of the aberrant gene expression in precancerous and cancerous lesions by comparing the gene expression of stem-like cells in diseased tissues with normal stem cells
check button Malignant transformation involving gene list.
Entrez IDSymbolReplicatesSpeciesOrganTissueAdj P-valueLog2FCMalignancy
7411VBP1LZE2THumanEsophagusESCC2.53e-071.02e+000.082
7411VBP1LZE4THumanEsophagusESCC5.77e-216.38e-010.0811
7411VBP1LZE7THumanEsophagusESCC2.82e-121.20e+000.0667
7411VBP1LZE8THumanEsophagusESCC2.42e-123.42e-010.067
7411VBP1LZE20THumanEsophagusESCC1.08e-033.17e-010.0662
7411VBP1LZE22D1HumanEsophagusHGIN1.13e-027.27e-020.0595
7411VBP1LZE22THumanEsophagusESCC2.05e-057.09e-010.068
7411VBP1LZE24THumanEsophagusESCC1.54e-341.08e+000.0596
7411VBP1LZE21THumanEsophagusESCC1.54e-054.75e-010.0655
7411VBP1LZE6THumanEsophagusESCC1.82e-138.16e-010.0845
7411VBP1P1T-EHumanEsophagusESCC5.13e-057.16e-010.0875
7411VBP1P2T-EHumanEsophagusESCC3.51e-501.00e+000.1177
7411VBP1P4T-EHumanEsophagusESCC2.21e-461.31e+000.1323
7411VBP1P5T-EHumanEsophagusESCC2.16e-398.64e-010.1327
7411VBP1P8T-EHumanEsophagusESCC3.80e-357.53e-010.0889
7411VBP1P9T-EHumanEsophagusESCC8.09e-358.15e-010.1131
7411VBP1P10T-EHumanEsophagusESCC7.00e-791.56e+000.116
7411VBP1P11T-EHumanEsophagusESCC2.21e-188.01e-010.1426
7411VBP1P12T-EHumanEsophagusESCC2.86e-471.05e+000.1122
7411VBP1P15T-EHumanEsophagusESCC1.74e-328.21e-010.1149
Page: 1 2 3 4 5 6 7 

check button Transcriptomic changes along malignancy continuum.
TissueExpression DynamicsAbbreviation
EsophagusThe image shows the transcriptomic changes along malignancy continuum.log2FC in expression of this searched gene in stem-like cells from each diseased tissue sample relative to stem-like cells in normal samples in each tissue plotted against the malignancy continuum. Samples are colored based on if they are from different disease stage.
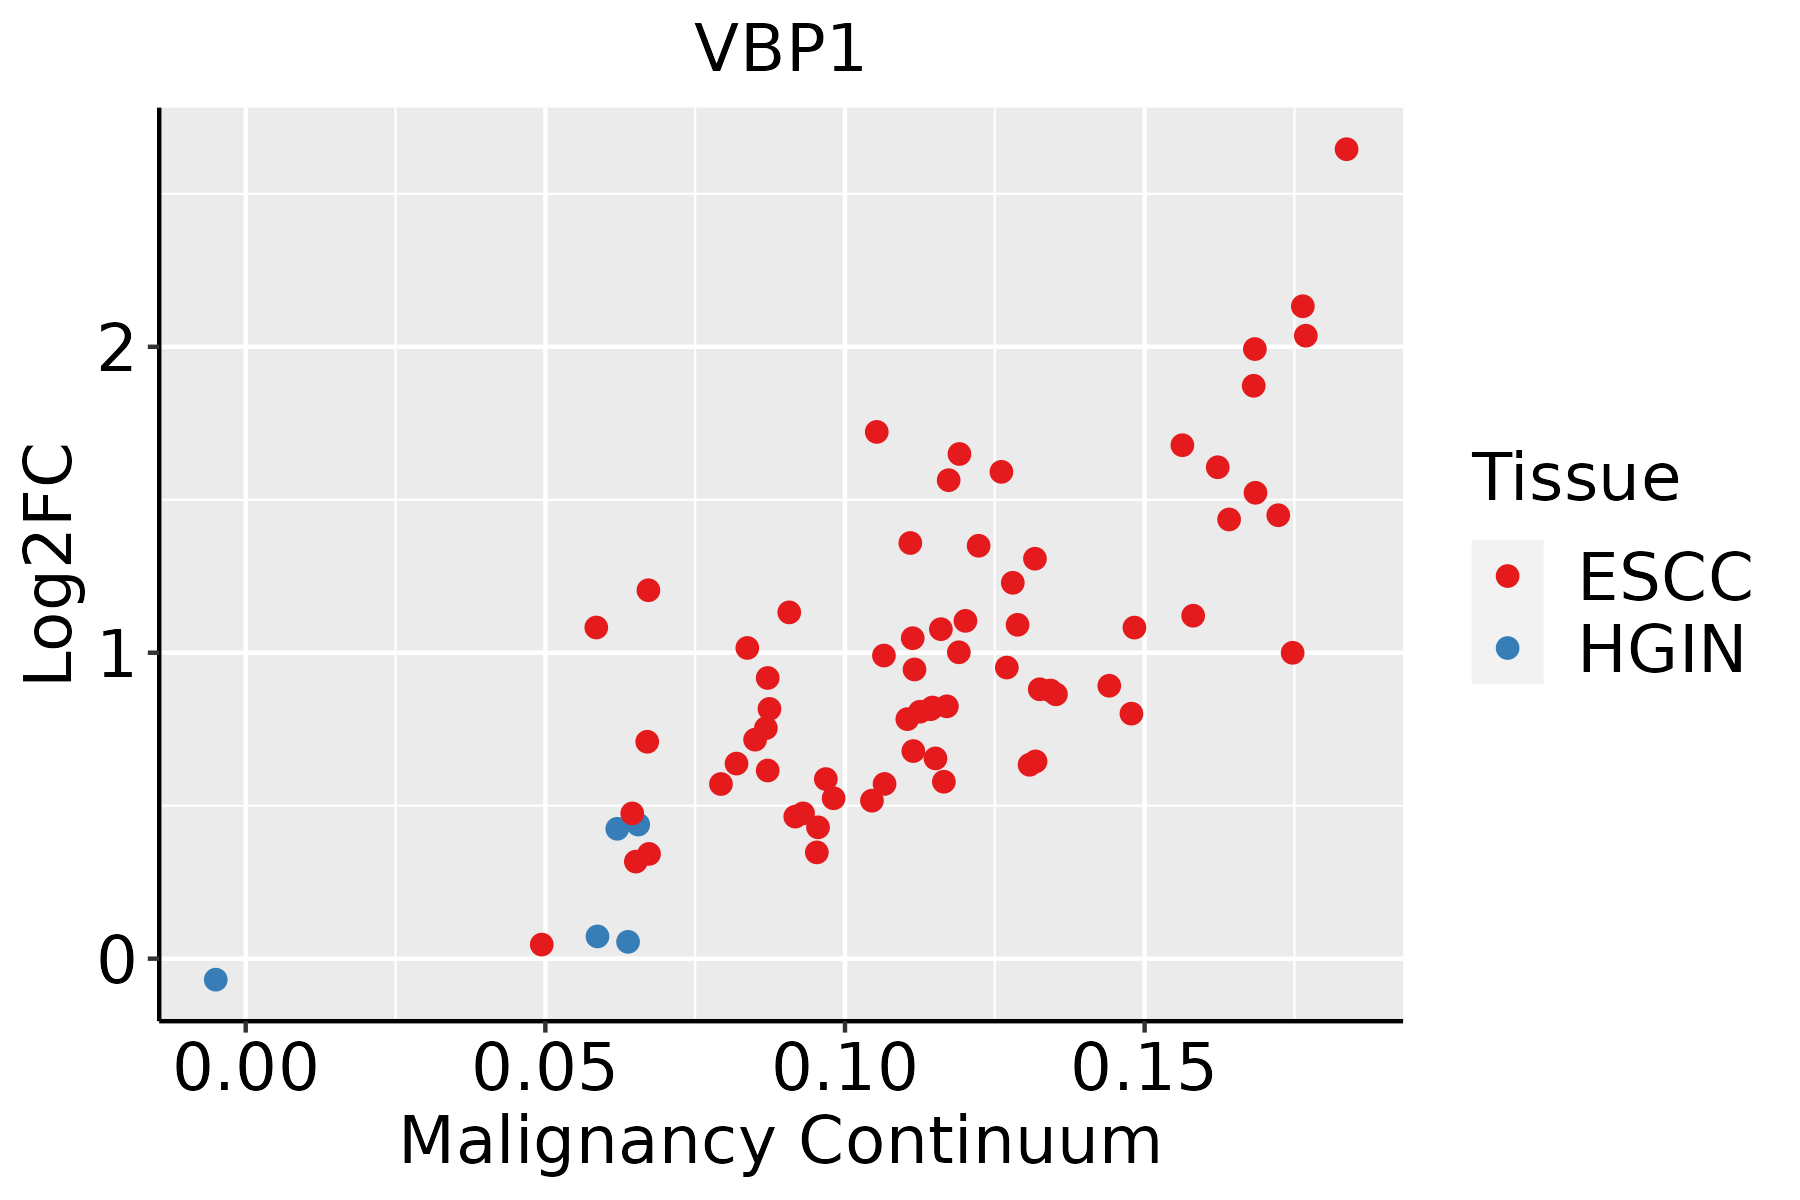
ESCC: Esophageal squamous cell carcinoma
HGIN: High-grade intraepithelial neoplasias
LGIN: Low-grade intraepithelial neoplasias
LiverThe image shows the transcriptomic changes along malignancy continuum.log2FC in expression of this searched gene in stem-like cells from each diseased tissue sample relative to stem-like cells in normal samples in each tissue plotted against the malignancy continuum. Samples are colored based on if they are from different disease stage.
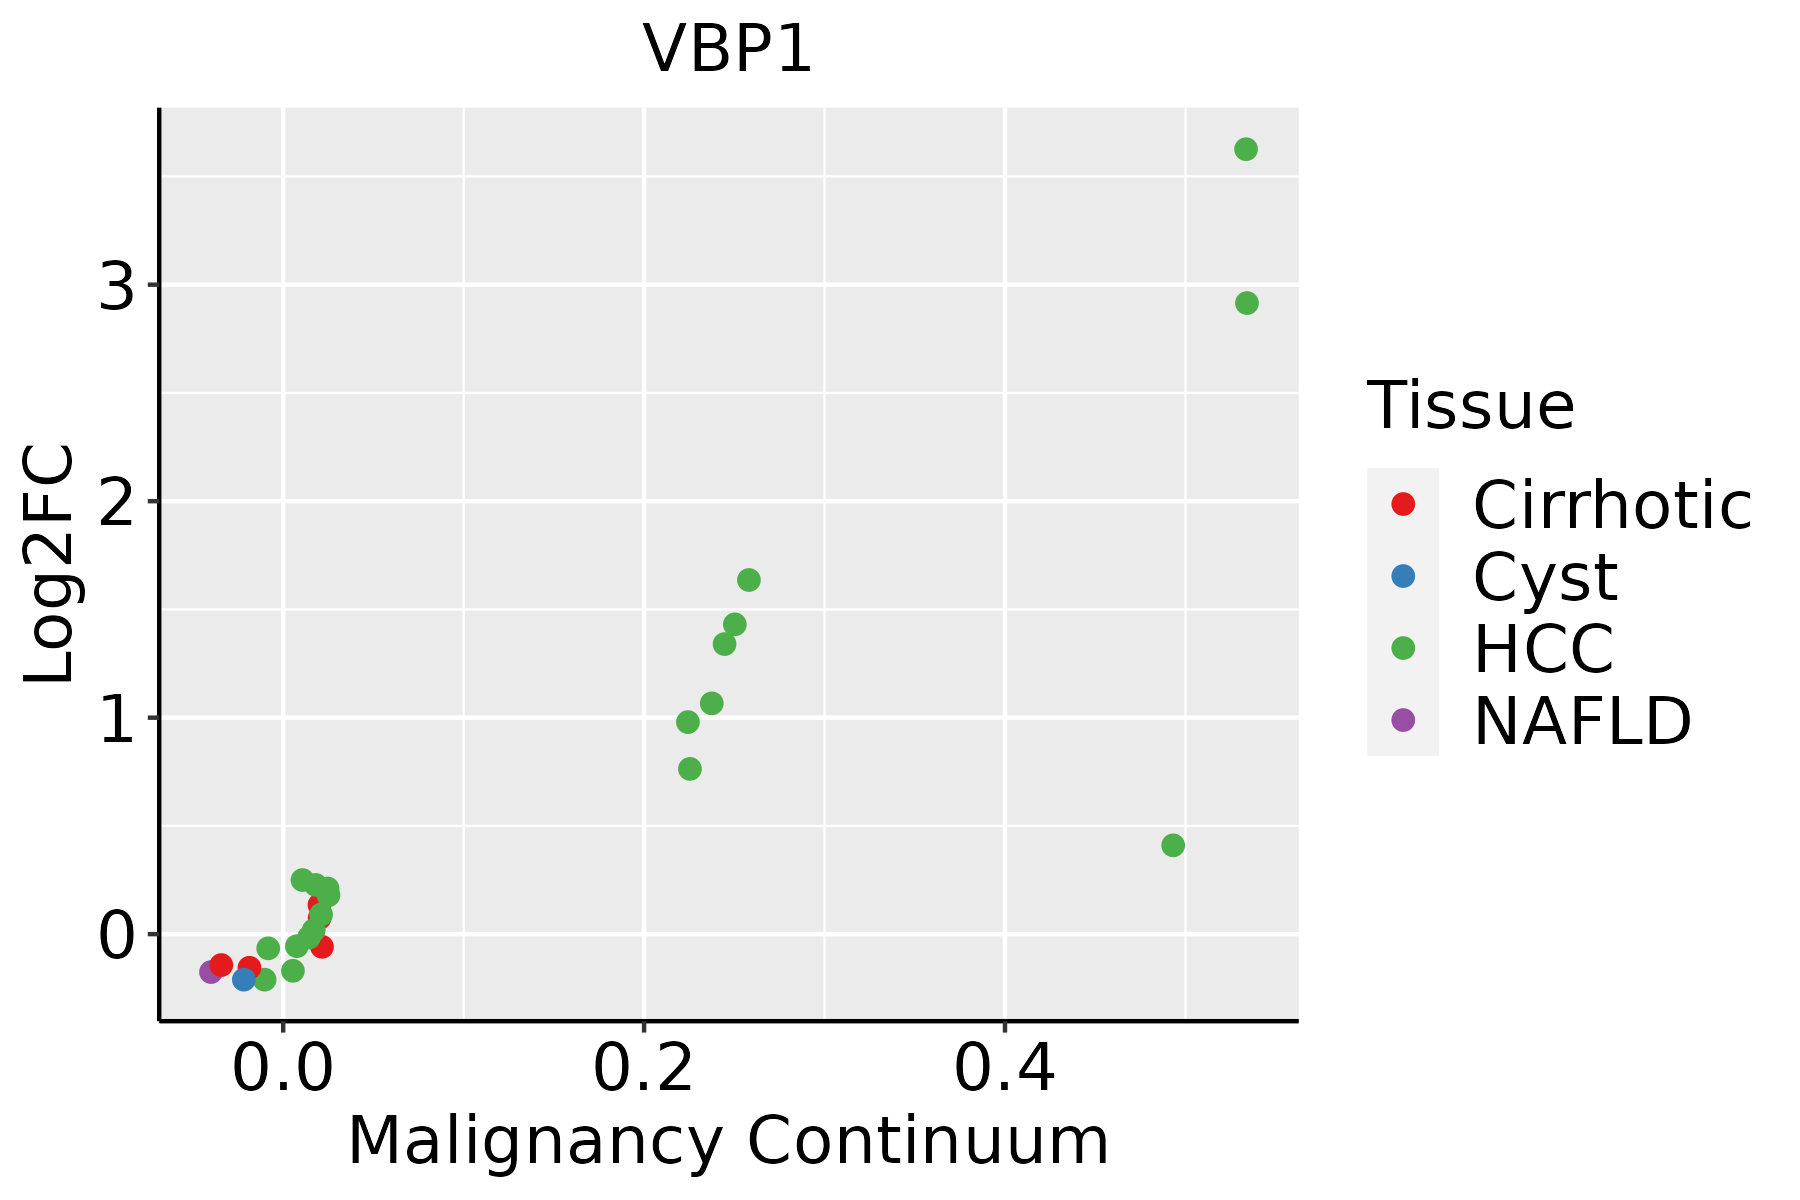
HCC: Hepatocellular carcinoma
NAFLD: Non-alcoholic fatty liver disease
Oral CavityThe image shows the transcriptomic changes along malignancy continuum.log2FC in expression of this searched gene in stem-like cells from each diseased tissue sample relative to stem-like cells in normal samples in each tissue plotted against the malignancy continuum. Samples are colored based on if they are from different disease stage.
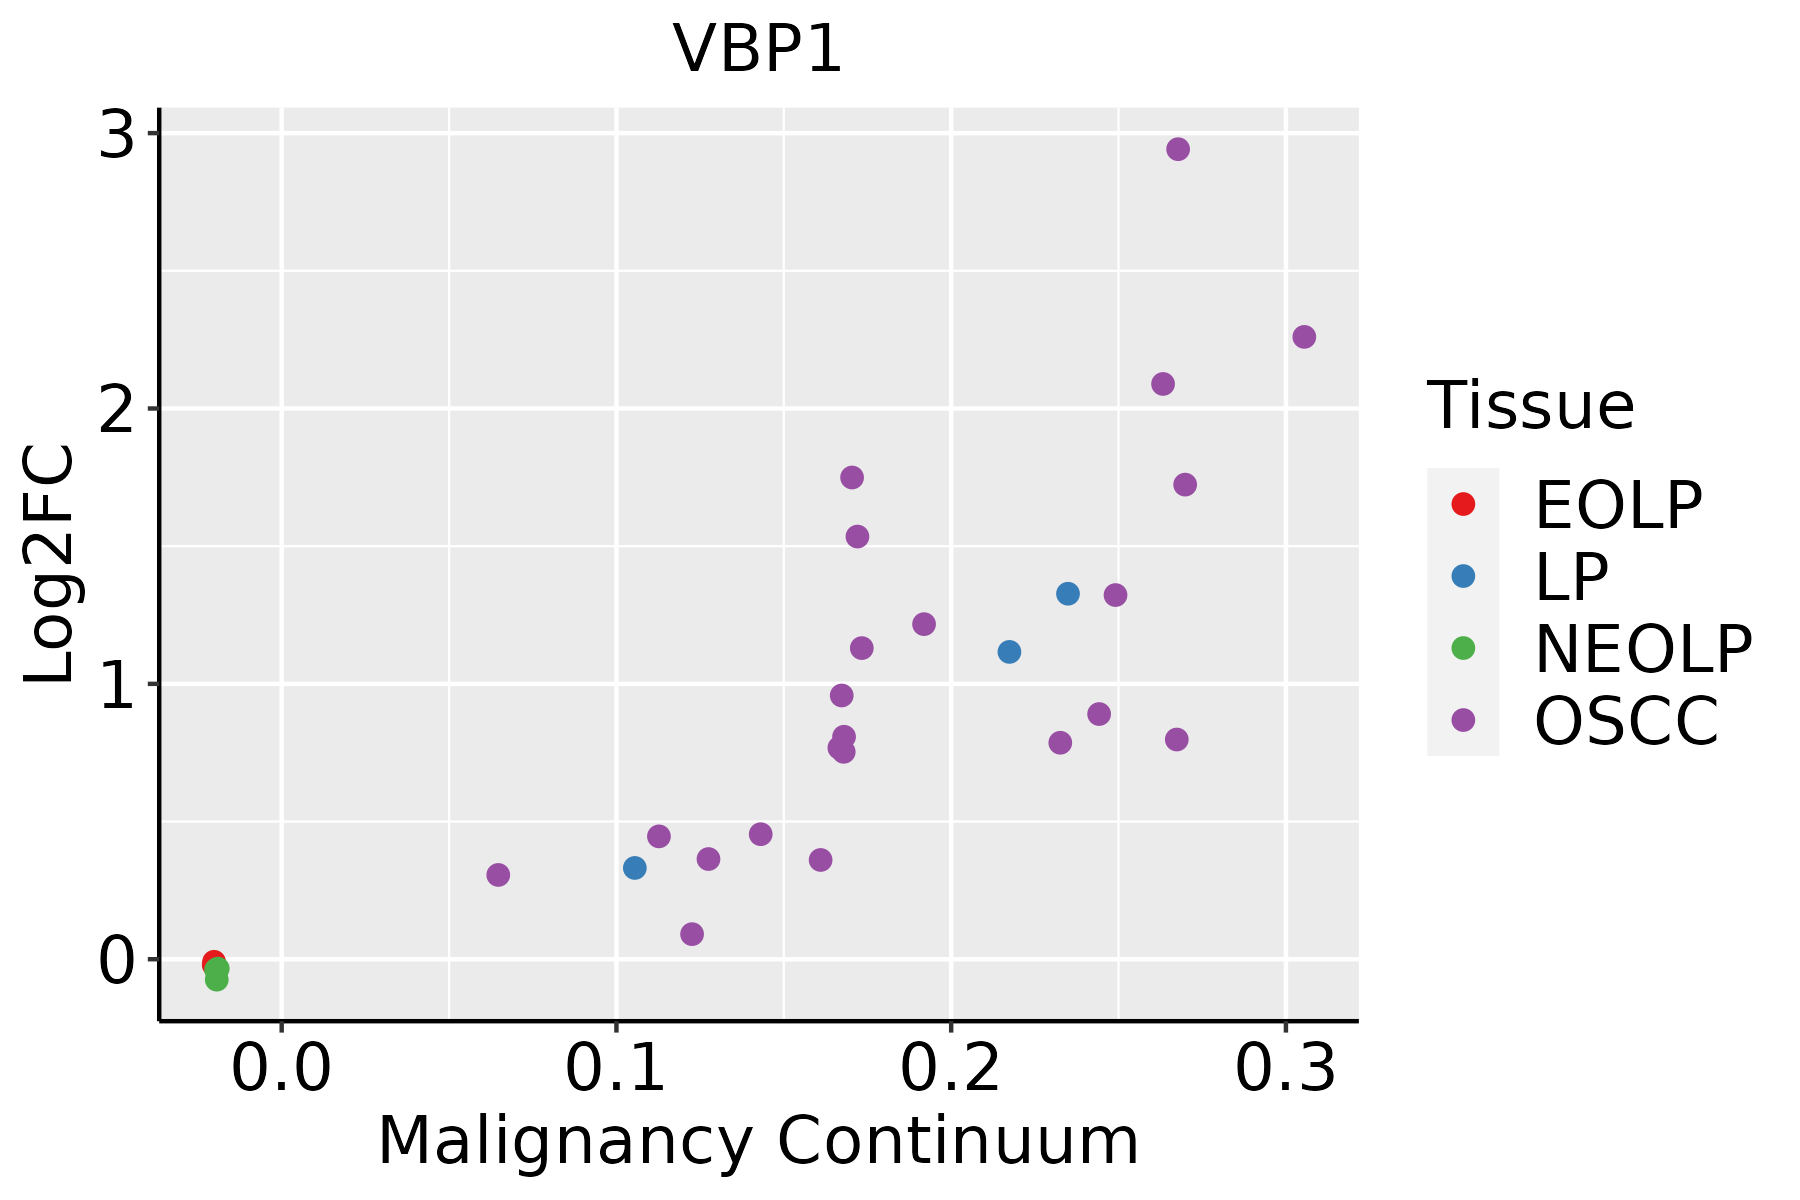
EOLP: Erosive Oral lichen planus
LP: leukoplakia
NEOLP: Non-erosive oral lichen planus
OSCC: Oral squamous cell carcinoma
SkinThe image shows the transcriptomic changes along malignancy continuum.log2FC in expression of this searched gene in stem-like cells from each diseased tissue sample relative to stem-like cells in normal samples in each tissue plotted against the malignancy continuum. Samples are colored based on if they are from different disease stage.
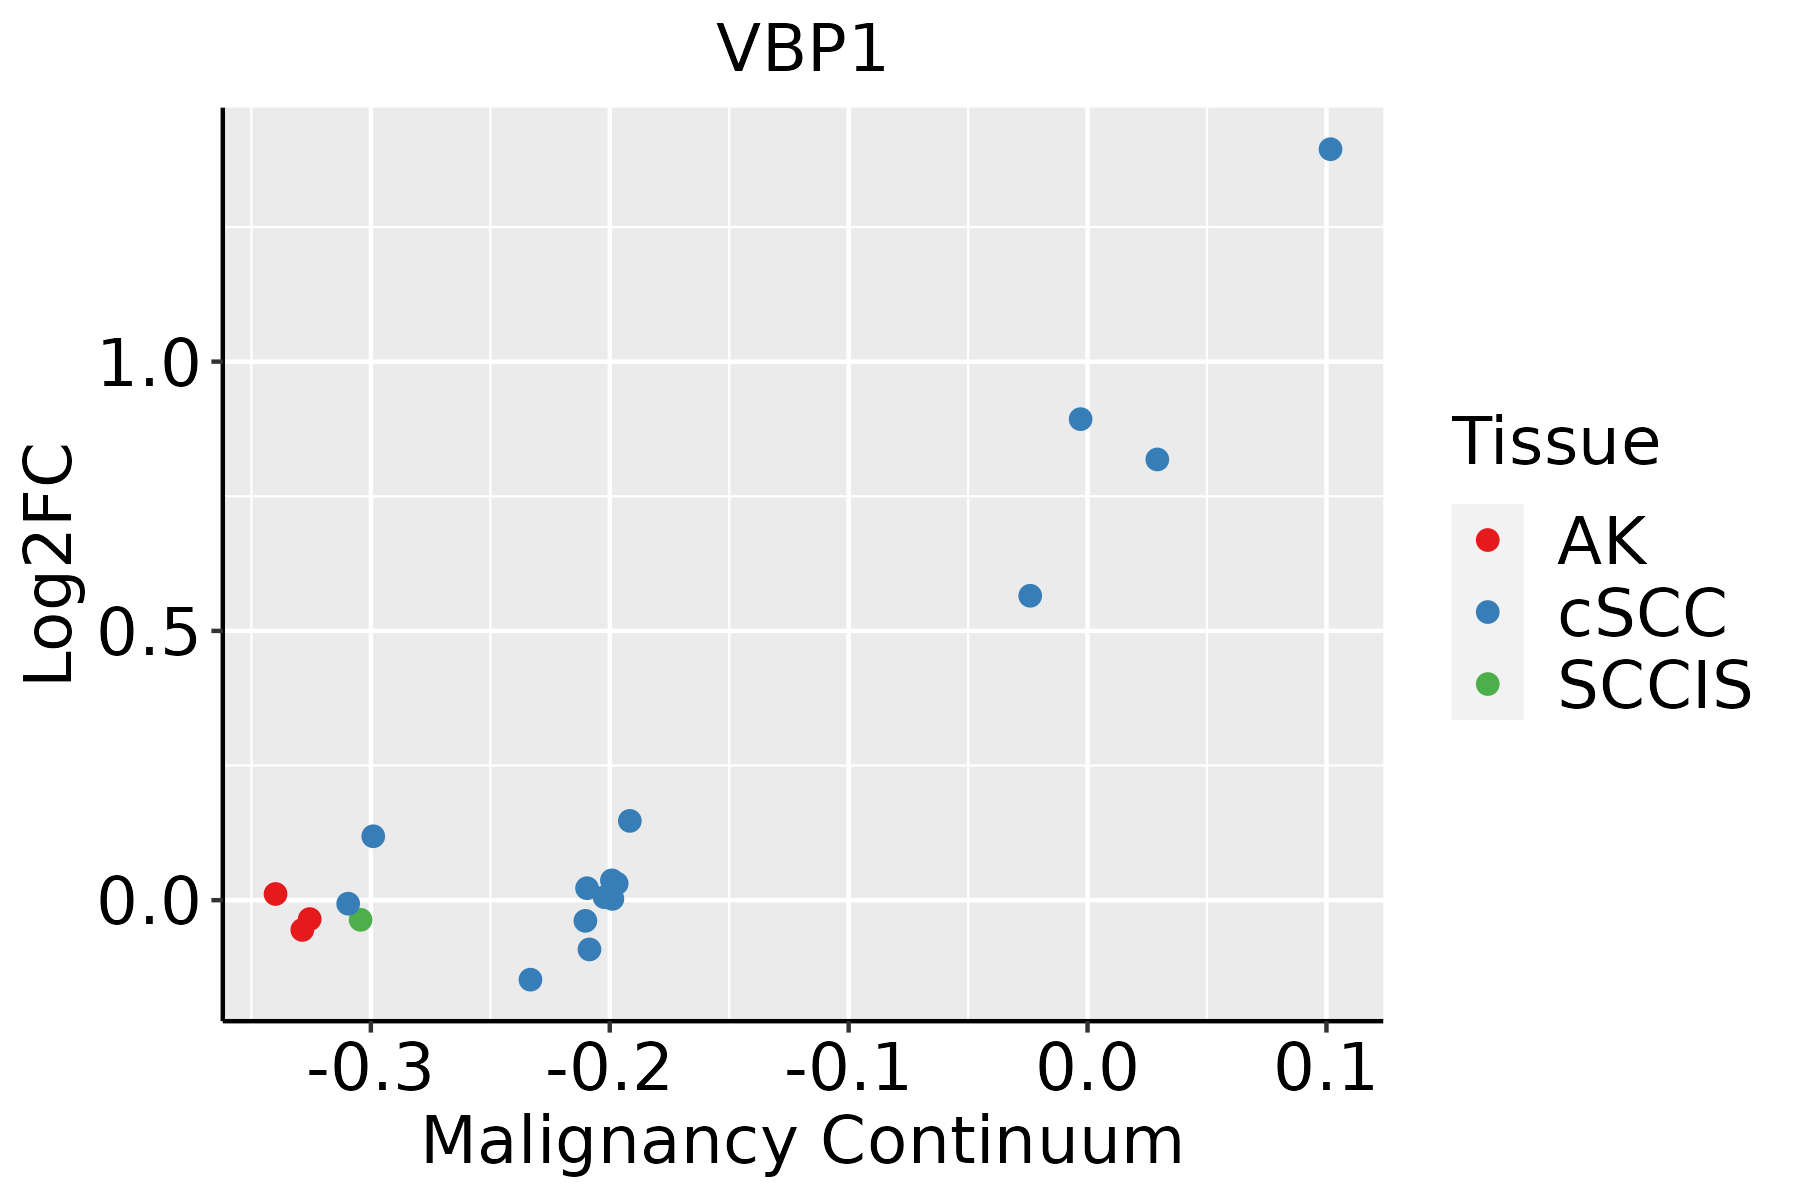
AK: Actinic keratosis
cSCC: Cutaneous squamous cell carcinoma
SCCIS:squamous cell carcinoma in situ
ThyroidThe image shows the transcriptomic changes along malignancy continuum.log2FC in expression of this searched gene in stem-like cells from each diseased tissue sample relative to stem-like cells in normal samples in each tissue plotted against the malignancy continuum. Samples are colored based on if they are from different disease stage.ATC: Anaplastic thyroid cancer
HT: Hashimoto's thyroiditis
PTC: Papillary thyroid cancer
∗log2FC in expression of this searched gene in stem-like cells from each diseased tissue sample relative to stem-like cells in normal samples in each tissue plotted against the malignancy continuum. Samples are colored based on if they are from different disease stage.

Top

Malignant transformation related pathway analysis

check buttonFind out the enriched GO biological processes and KEGG pathways involved in transition from healthy to precancer to cancer
check button Figure of enriched GO biological processes.
TissueDisease StageEnriched GO biological Processes
ColorectumADGO analysis - Figure of enriched GO biological processes: Top 15 enriched GO BP terms are showed in the bar plot of each disease state in each tissue. Each row represents a significant GO biological process which is colored according to the -log10(p.adjust).
ColorectumSERGO analysis - Figure of enriched GO biological processes: Top 15 enriched GO BP terms are showed in the bar plot of each disease state in each tissue. Each row represents a significant GO biological process which is colored according to the -log10(p.adjust).
ColorectumMSSGO analysis - Figure of enriched GO biological processes: Top 15 enriched GO BP terms are showed in the bar plot of each disease state in each tissue. Each row represents a significant GO biological process which is colored according to the -log10(p.adjust).
ColorectumMSI-HGO analysis - Figure of enriched GO biological processes: Top 15 enriched GO BP terms are showed in the bar plot of each disease state in each tissue. Each row represents a significant GO biological process which is colored according to the -log10(p.adjust).
ColorectumFAPGO analysis - Figure of enriched GO biological processes: Top 15 enriched GO BP terms are showed in the bar plot of each disease state in each tissue. Each row represents a significant GO biological process which is colored according to the -log10(p.adjust).
∗Top 15 enriched GO BP terms are showed in the bar plot of each disease state in each tissue. Each row represents a significant GO biological process which is colored according to the -log10(p.adjust).
Page: 1 2 3 4 5 6 7 8 9 

check button Enriched GO biological processes.
GO IDTissueDisease StageDescriptionGene RatioBg Ratiopvaluep.adjustCount
GO:000645720EsophagusHGINprotein folding75/2587212/187231.61e-153.86e-1375
GO:190290327EsophagusHGINregulation of supramolecular fiber organization79/2587383/187231.40e-042.81e-0379
GO:199000010EsophagusHGINamyloid fibril formation13/258734/187233.51e-045.65e-0313
GO:19059068EsophagusHGINregulation of amyloid fibril formation8/258716/187236.00e-048.41e-038
GO:19059078EsophagusHGINnegative regulation of amyloid fibril formation6/258713/187234.97e-034.18e-026
GO:0006457110EsophagusESCCprotein folding163/8552212/187231.13e-201.74e-18163
GO:1902903111EsophagusESCCregulation of supramolecular fiber organization237/8552383/187239.06e-112.75e-09237
GO:190590616EsophagusESCCregulation of amyloid fibril formation13/855216/187234.05e-031.62e-0213
GO:190590716EsophagusESCCnegative regulation of amyloid fibril formation11/855213/187234.76e-031.85e-0211
GO:00064577LiverCirrhoticprotein folding114/4634212/187239.23e-202.31e-17114
GO:190290312LiverCirrhoticregulation of supramolecular fiber organization148/4634383/187238.85e-104.08e-08148
GO:19900003LiverCirrhoticamyloid fibril formation19/463434/187231.01e-041.05e-0319
GO:1905907LiverCirrhoticnegative regulation of amyloid fibril formation10/463413/187231.14e-041.14e-0310
GO:19029046LiverCirrhoticnegative regulation of supramolecular fiber organization63/4634167/187231.29e-041.26e-0363
GO:1905906LiverCirrhoticregulation of amyloid fibril formation11/463416/187232.58e-042.30e-0311
GO:000645712LiverHCCprotein folding160/7958212/187231.07e-221.88e-20160
GO:190290322LiverHCCregulation of supramolecular fiber organization224/7958383/187231.54e-105.33e-09224
GO:199000011LiverHCCamyloid fibril formation24/795834/187238.62e-045.13e-0324
GO:190290412LiverHCCnegative regulation of supramolecular fiber organization90/7958167/187231.90e-039.69e-0390
GO:19059071LiverHCCnegative regulation of amyloid fibril formation11/795813/187232.38e-031.16e-0211
Page: 1 2 3 

check button Enriched KEGG pathways.
Pathway IDTissueDisease StageDescriptionGene RatioBg Ratiopvaluep.adjustqvalueCount
Page: 1 

Top

Cell-cell communication analysis

check buttonIdentification of potential cell-cell interactions between two cell types and their ligand-receptor pairs for different disease states
LigandReceptorLRpairPathwayTissueDisease Stage
Page: 1 

Top

Single-cell gene regulatory network inference analysis

check buttonFind out the significant the regulons (TFs) and the target genes of each regulon across cell types for different disease states
TFCell TypeTissueDisease StageTarget GeneRSSRegulon Activity
∗The dot plots of a searched regulon are shown for all cell subpopulations in each disease state of each tissue based on the regulon specific score inferred using pySCENIC and by calculating the average expression.
Page: 1 

Top

Somatic mutation of malignant transformation related genes

check buttonAnnotation of somatic variants for genes involved in malignant transformation
Hugo SymbolVariant ClassVariant ClassificationdbSNP RSHGVScHGVSpHGVSp ShortSWISSPROTBIOTYPESIFTPolyPhenTumor Sample BarcodeTissueHistologySexAgeStageTherapy TypesDrugsOutcome
VBP1SNVMissense_Mutationc.85G>Ap.Val29Metp.V29MP61758protein_codingtolerated(0.17)possibly_damaging(0.499)TCGA-B6-A0RL-01Breastbreast invasive carcinomaFemale<65I/IIUnknownUnknownSD
VBP1insertionNonsense_Mutationnovelc.548_549insGTAAATATATTCTTTAACCAAGGGGTCAGCAAACTTTCp.Asp183GlufsTer2p.D183Efs*2P61758protein_codingTCGA-A8-A07J-01Breastbreast invasive carcinomaFemale<65I/IIChemotherapy5-fluorouracilCR
VBP1SNVMissense_Mutationnovelc.315N>Ap.Phe105Leup.F105LP61758protein_codingdeleterious(0)probably_damaging(0.936)TCGA-2W-A8YY-01Cervixcervical & endocervical cancerFemale<65I/IIChemotherapycisplatinCR
VBP1SNVMissense_Mutationc.120N>Tp.Gln40Hisp.Q40HP61758protein_codingdeleterious(0.02)possibly_damaging(0.556)TCGA-CK-4951-01Colorectumcolon adenocarcinomaFemale>=65I/IIUnknownUnknownPD
VBP1SNVMissense_Mutationnovelc.207A>Cp.Gln69Hisp.Q69HP61758protein_codingdeleterious(0.02)possibly_damaging(0.905)TCGA-A5-A0G1-01Endometriumuterine corpus endometrioid carcinomaFemale>=65I/IIUnknownUnknownSD
VBP1SNVMissense_Mutationc.164N>Gp.Glu55Glyp.E55GP61758protein_codingdeleterious(0.01)probably_damaging(0.996)TCGA-AP-A0LM-01Endometriumuterine corpus endometrioid carcinomaFemale<65III/IVChemotherapycisplatinSD
VBP1SNVMissense_Mutationc.438N>Tp.Lys146Asnp.K146NP61758protein_codingtolerated(0.1)benign(0.146)TCGA-AP-A0LM-01Endometriumuterine corpus endometrioid carcinomaFemale<65III/IVChemotherapycisplatinSD
VBP1SNVMissense_Mutationnovelc.446C>Tp.Ser149Leup.S149LP61758protein_codingtolerated(0.05)benign(0.003)TCGA-AP-A1DK-01Endometriumuterine corpus endometrioid carcinomaFemale<65I/IIUnknownUnknownSD
VBP1SNVMissense_Mutationnovelc.311N>Tp.Arg104Ilep.R104IP61758protein_codingdeleterious(0.02)possibly_damaging(0.767)TCGA-AX-A06F-01Endometriumuterine corpus endometrioid carcinomaFemale<65III/IVChemotherapycarboplatinSD
VBP1SNVMissense_Mutationc.197N>Gp.Asn66Serp.N66SP61758protein_codingtolerated(0.1)benign(0.106)TCGA-B5-A11E-01Endometriumuterine corpus endometrioid carcinomaFemale<65I/IIUnknownUnknownSD
Page: 1 2 3 

Top

Related drugs of malignant transformation related genes

check buttonIdentification of chemicals and drugs interact with genes involved in malignant transfromation
(DGIdb 4.0)
Entrez IDSymbolCategoryInteraction TypesDrug Claim NameDrug NamePMIDs
Page: 1