
|
|||||
|
 | |
| |
| |
| |
| |
| |
|
Gene: VAV3 |
Gene summary for VAV3 |
| Gene information | Species | Human | Gene symbol | VAV3 | Gene ID | 10451 |
| Gene name | vav guanine nucleotide exchange factor 3 | |
| Gene Alias | VAV3 | |
| Cytomap | 1p13.3 | |
| Gene Type | protein-coding | GO ID | GO:0001525 | UniProtAcc | Q9UKW4 |
Top |
Malignant transformation analysis |
| Identification of the aberrant gene expression in precancerous and cancerous lesions by comparing the gene expression of stem-like cells in diseased tissues with normal stem cells |
| Entrez ID | Symbol | Replicates | Species | Organ | Tissue | Adj P-value | Log2FC | Malignancy |
| 10451 | VAV3 | GSM4909285 | Human | Breast | IDC | 1.71e-05 | 1.64e-01 | 0.21 |
| 10451 | VAV3 | GSM4909286 | Human | Breast | IDC | 1.65e-04 | -1.92e-01 | 0.1081 |
| 10451 | VAV3 | GSM4909293 | Human | Breast | IDC | 2.78e-13 | 2.22e-01 | 0.1581 |
| 10451 | VAV3 | GSM4909301 | Human | Breast | IDC | 1.25e-16 | 5.56e-01 | 0.1577 |
| 10451 | VAV3 | GSM4909303 | Human | Breast | IDC | 3.11e-03 | 2.65e-01 | 0.0438 |
| 10451 | VAV3 | GSM4909304 | Human | Breast | IDC | 6.02e-07 | 3.21e-01 | 0.1636 |
| 10451 | VAV3 | GSM4909312 | Human | Breast | IDC | 2.50e-03 | 2.55e-01 | 0.1552 |
| 10451 | VAV3 | GSM4909315 | Human | Breast | IDC | 6.63e-11 | 3.60e-01 | 0.21 |
| 10451 | VAV3 | GSM4909319 | Human | Breast | IDC | 5.56e-05 | -1.57e-01 | 0.1563 |
| 10451 | VAV3 | brca2 | Human | Breast | Precancer | 4.00e-03 | 5.07e-02 | -0.024 |
| 10451 | VAV3 | brca3 | Human | Breast | Precancer | 2.46e-03 | 5.60e-02 | -0.0263 |
| 10451 | VAV3 | M1 | Human | Breast | IDC | 1.13e-04 | 2.74e-01 | 0.1577 |
| 10451 | VAV3 | NCCBC2 | Human | Breast | DCIS | 1.17e-06 | 6.54e-01 | 0.1554 |
| 10451 | VAV3 | P2 | Human | Breast | IDC | 4.00e-08 | 5.09e-01 | 0.21 |
| 10451 | VAV3 | DCIS2 | Human | Breast | DCIS | 6.19e-38 | 1.37e-01 | 0.0085 |
| 10451 | VAV3 | CCI_2 | Human | Cervix | CC | 3.18e-09 | 2.09e+00 | 0.5249 |
| 10451 | VAV3 | CCI_3 | Human | Cervix | CC | 1.14e-06 | 8.18e-01 | 0.516 |
| 10451 | VAV3 | H2 | Human | Cervix | HSIL_HPV | 1.09e-07 | -2.49e-01 | 0.0632 |
| 10451 | VAV3 | HTA11_3410_2000001011 | Human | Colorectum | AD | 2.80e-14 | -5.02e-01 | 0.0155 |
| 10451 | VAV3 | HTA11_347_2000001011 | Human | Colorectum | AD | 5.94e-11 | 7.26e-01 | -0.1954 |
| Page: 1 2 3 4 5 6 7 8 |
| Tissue | Expression Dynamics | Abbreviation |
| Breast | 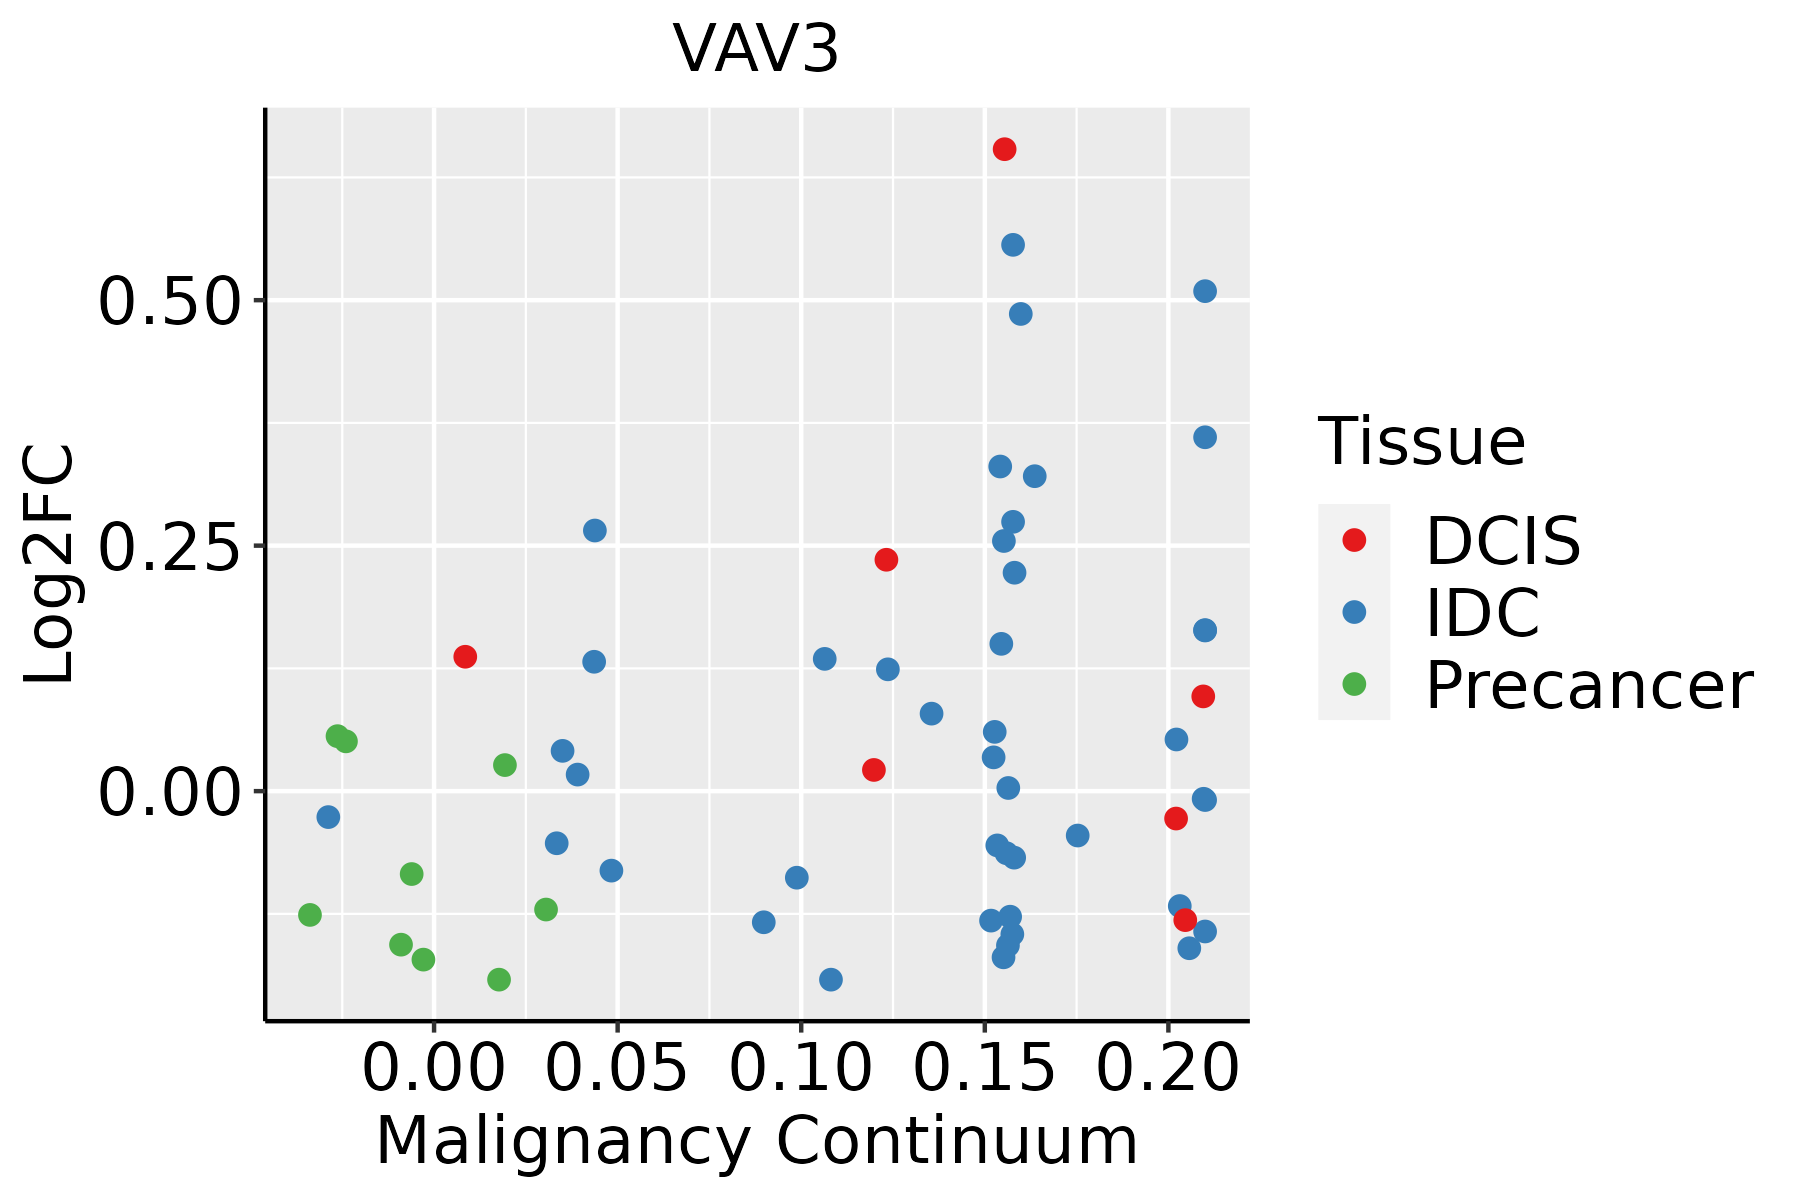 | IDC: Invasive ductal carcinoma |
| DCIS: Ductal carcinoma in situ | ||
| Precancer(BRCA1-mut): Precancerous lesion from BRCA1 mutation carriers | ||
| Cervix | 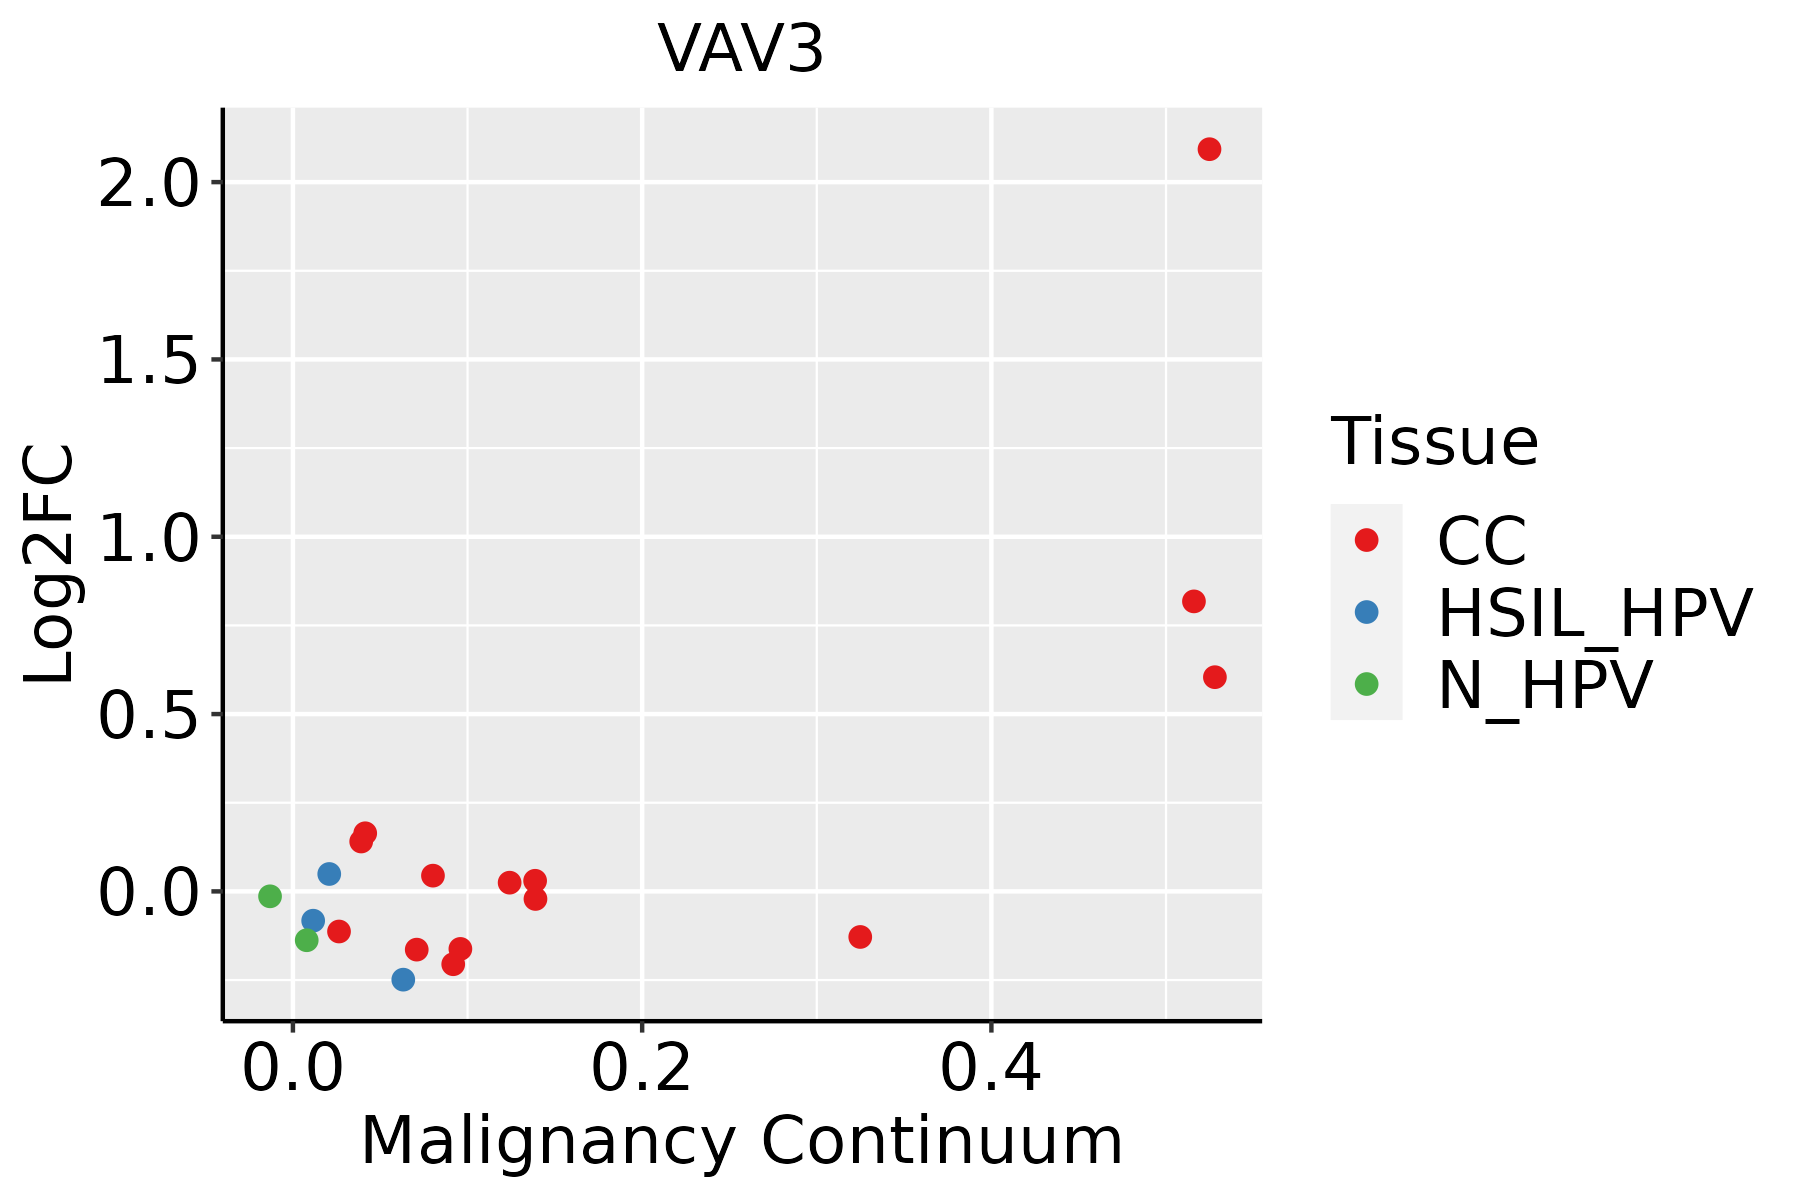 | CC: Cervix cancer |
| HSIL_HPV: HPV-infected high-grade squamous intraepithelial lesions | ||
| N_HPV: HPV-infected normal cervix | ||
| Colorectum (GSE201348) |  | FAP: Familial adenomatous polyposis |
| CRC: Colorectal cancer | ||
| Colorectum (HTA11) |  | AD: Adenomas |
| SER: Sessile serrated lesions | ||
| MSI-H: Microsatellite-high colorectal cancer | ||
| MSS: Microsatellite stable colorectal cancer | ||
| Endometrium | 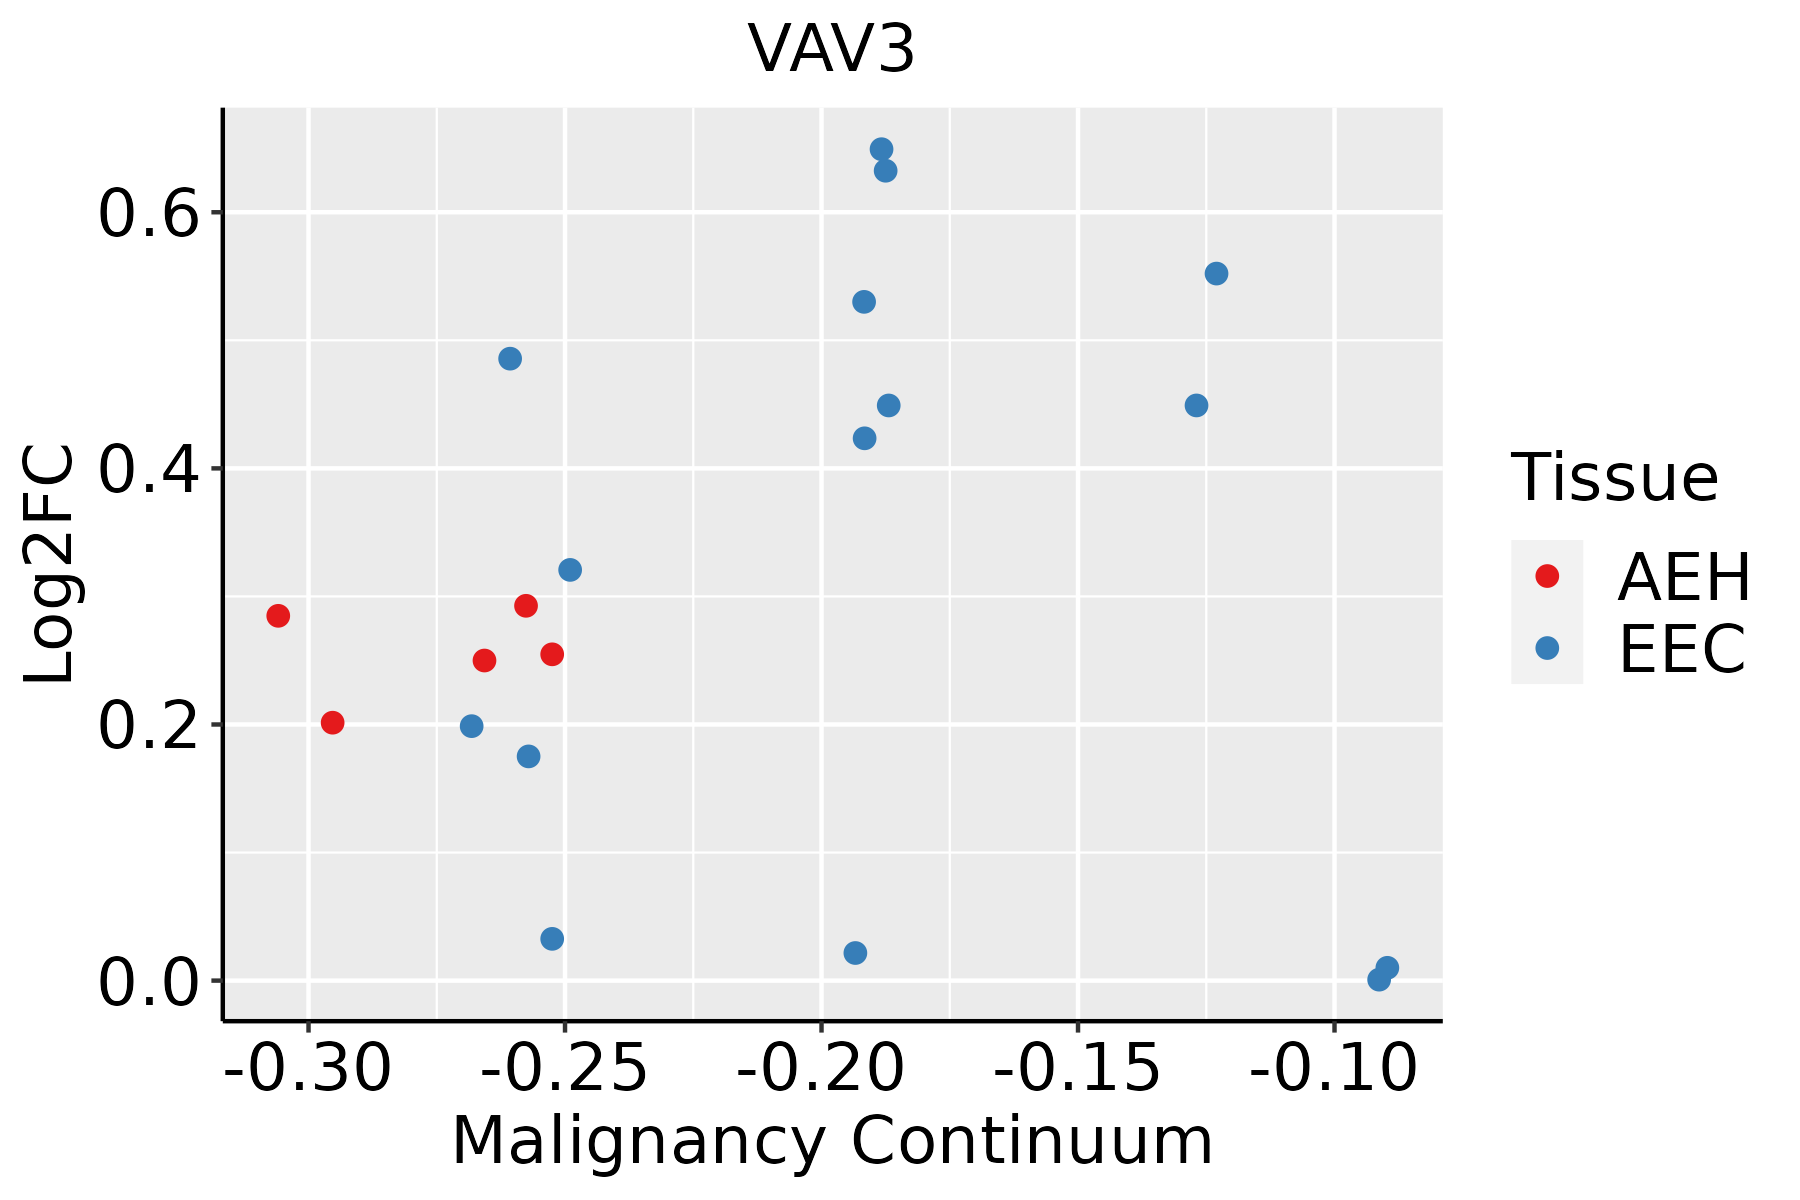 | AEH: Atypical endometrial hyperplasia |
| EEC: Endometrioid Cancer | ||
| Esophagus | 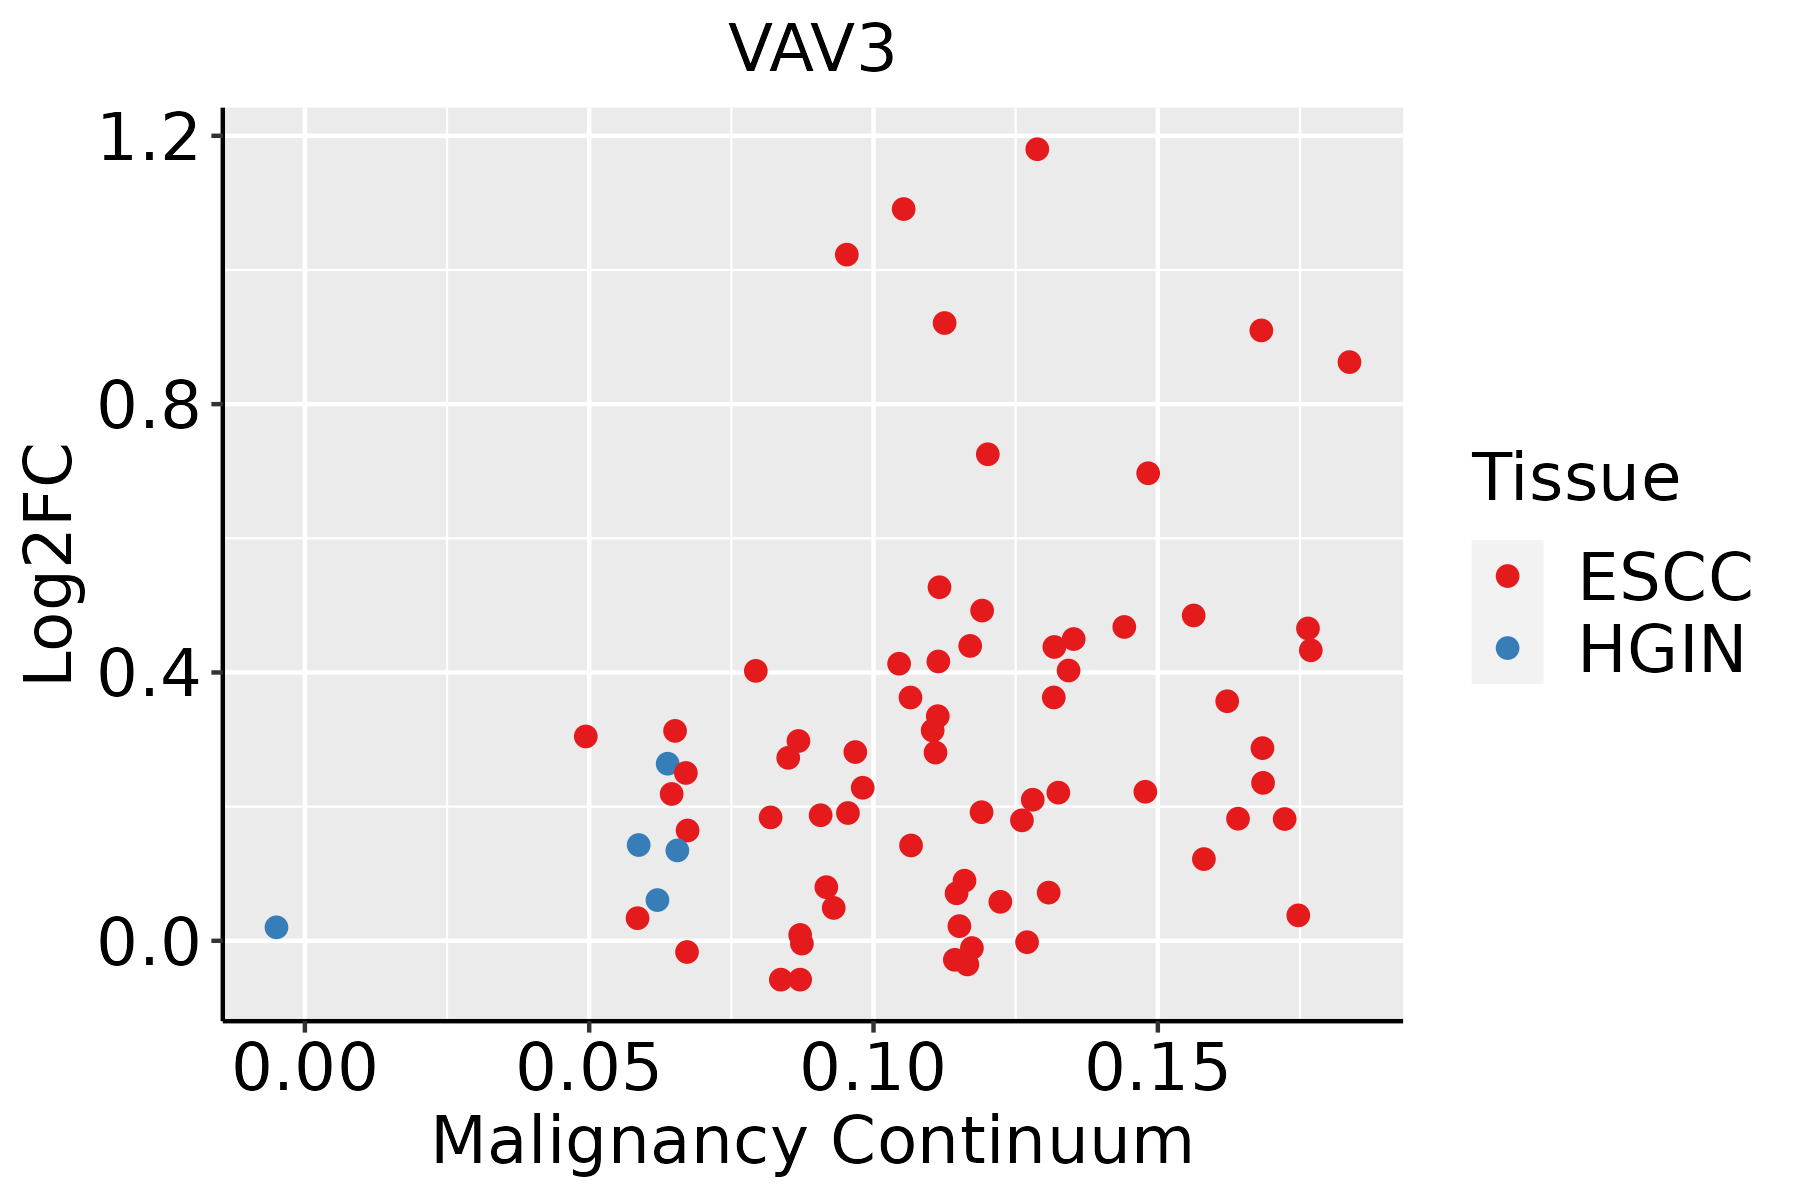 | ESCC: Esophageal squamous cell carcinoma |
| HGIN: High-grade intraepithelial neoplasias | ||
| LGIN: Low-grade intraepithelial neoplasias | ||
| Oral Cavity |  | EOLP: Erosive Oral lichen planus |
| LP: leukoplakia | ||
| NEOLP: Non-erosive oral lichen planus | ||
| OSCC: Oral squamous cell carcinoma | ||
| Skin | 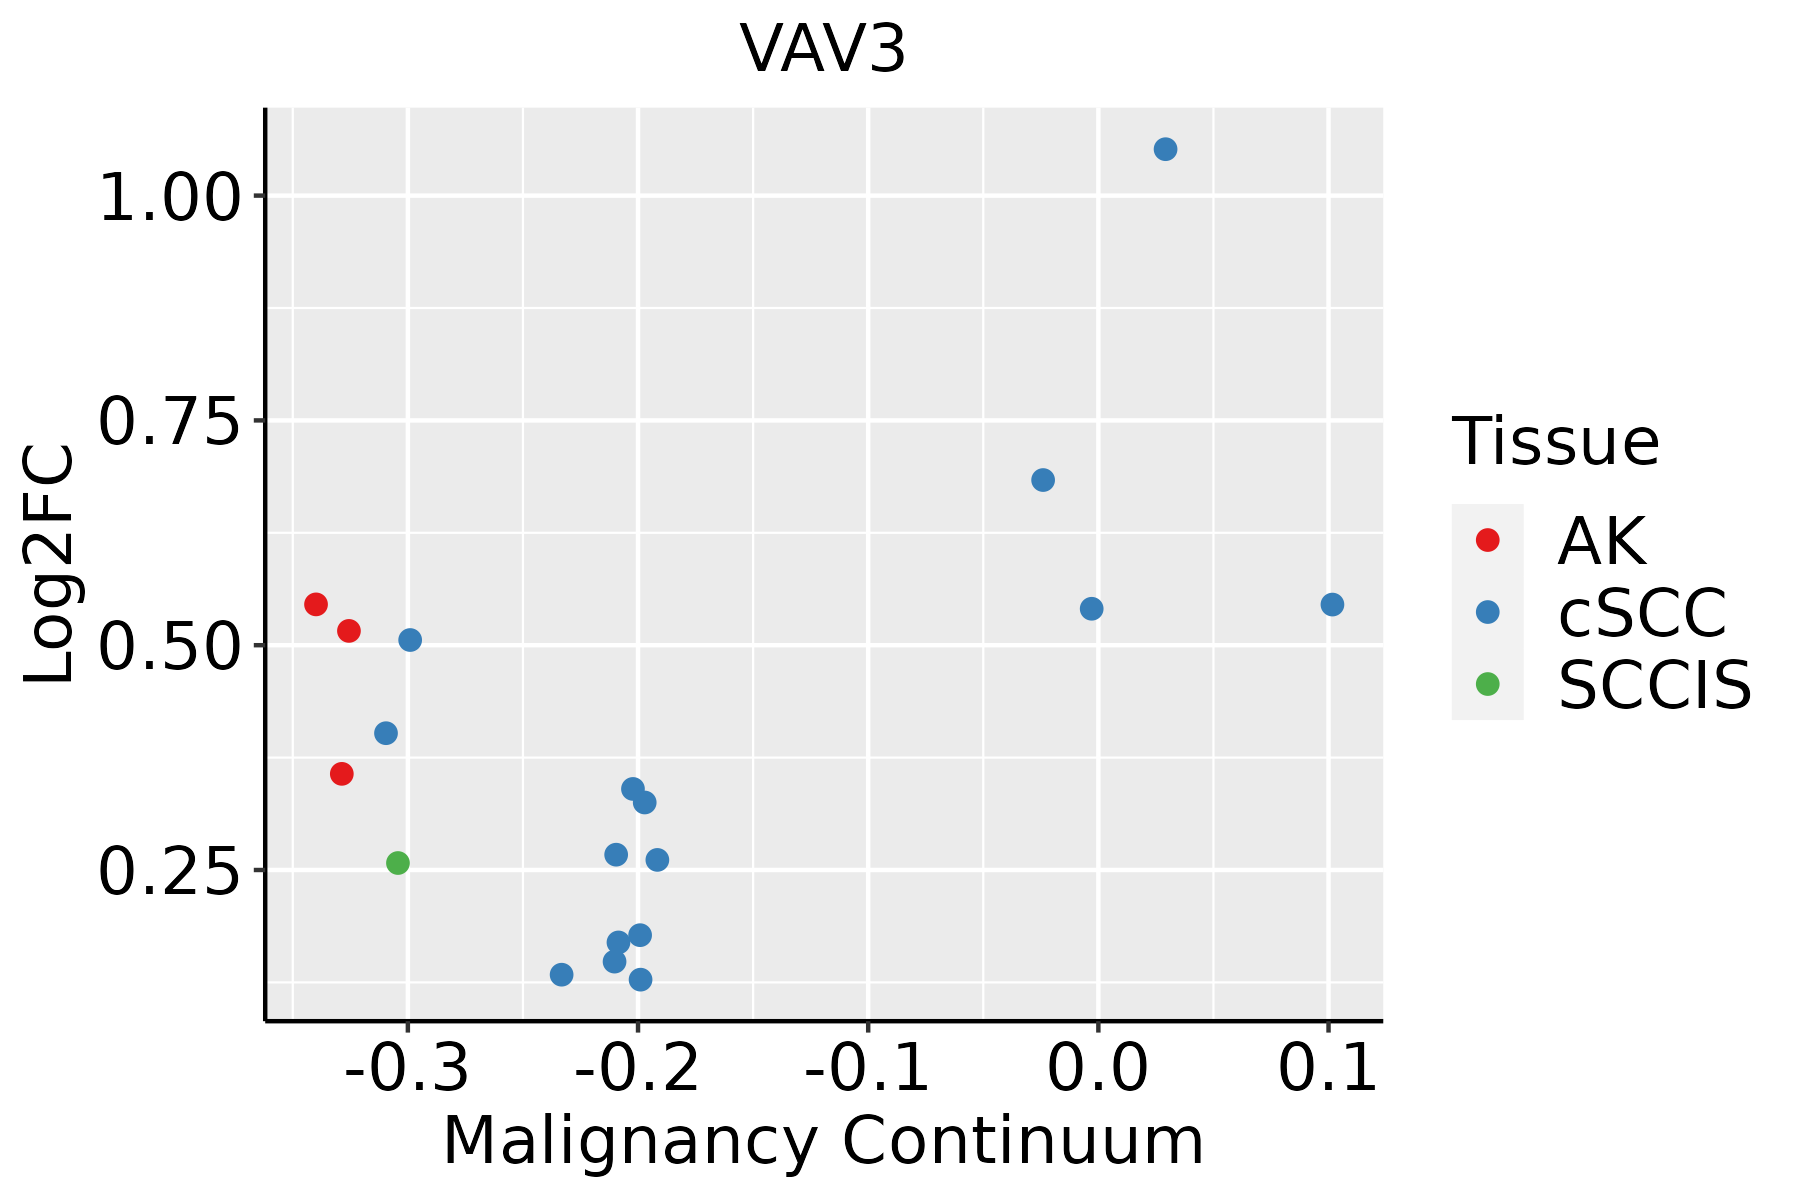 | AK: Actinic keratosis |
| cSCC: Cutaneous squamous cell carcinoma | ||
| SCCIS:squamous cell carcinoma in situ | ||
| Thyroid | 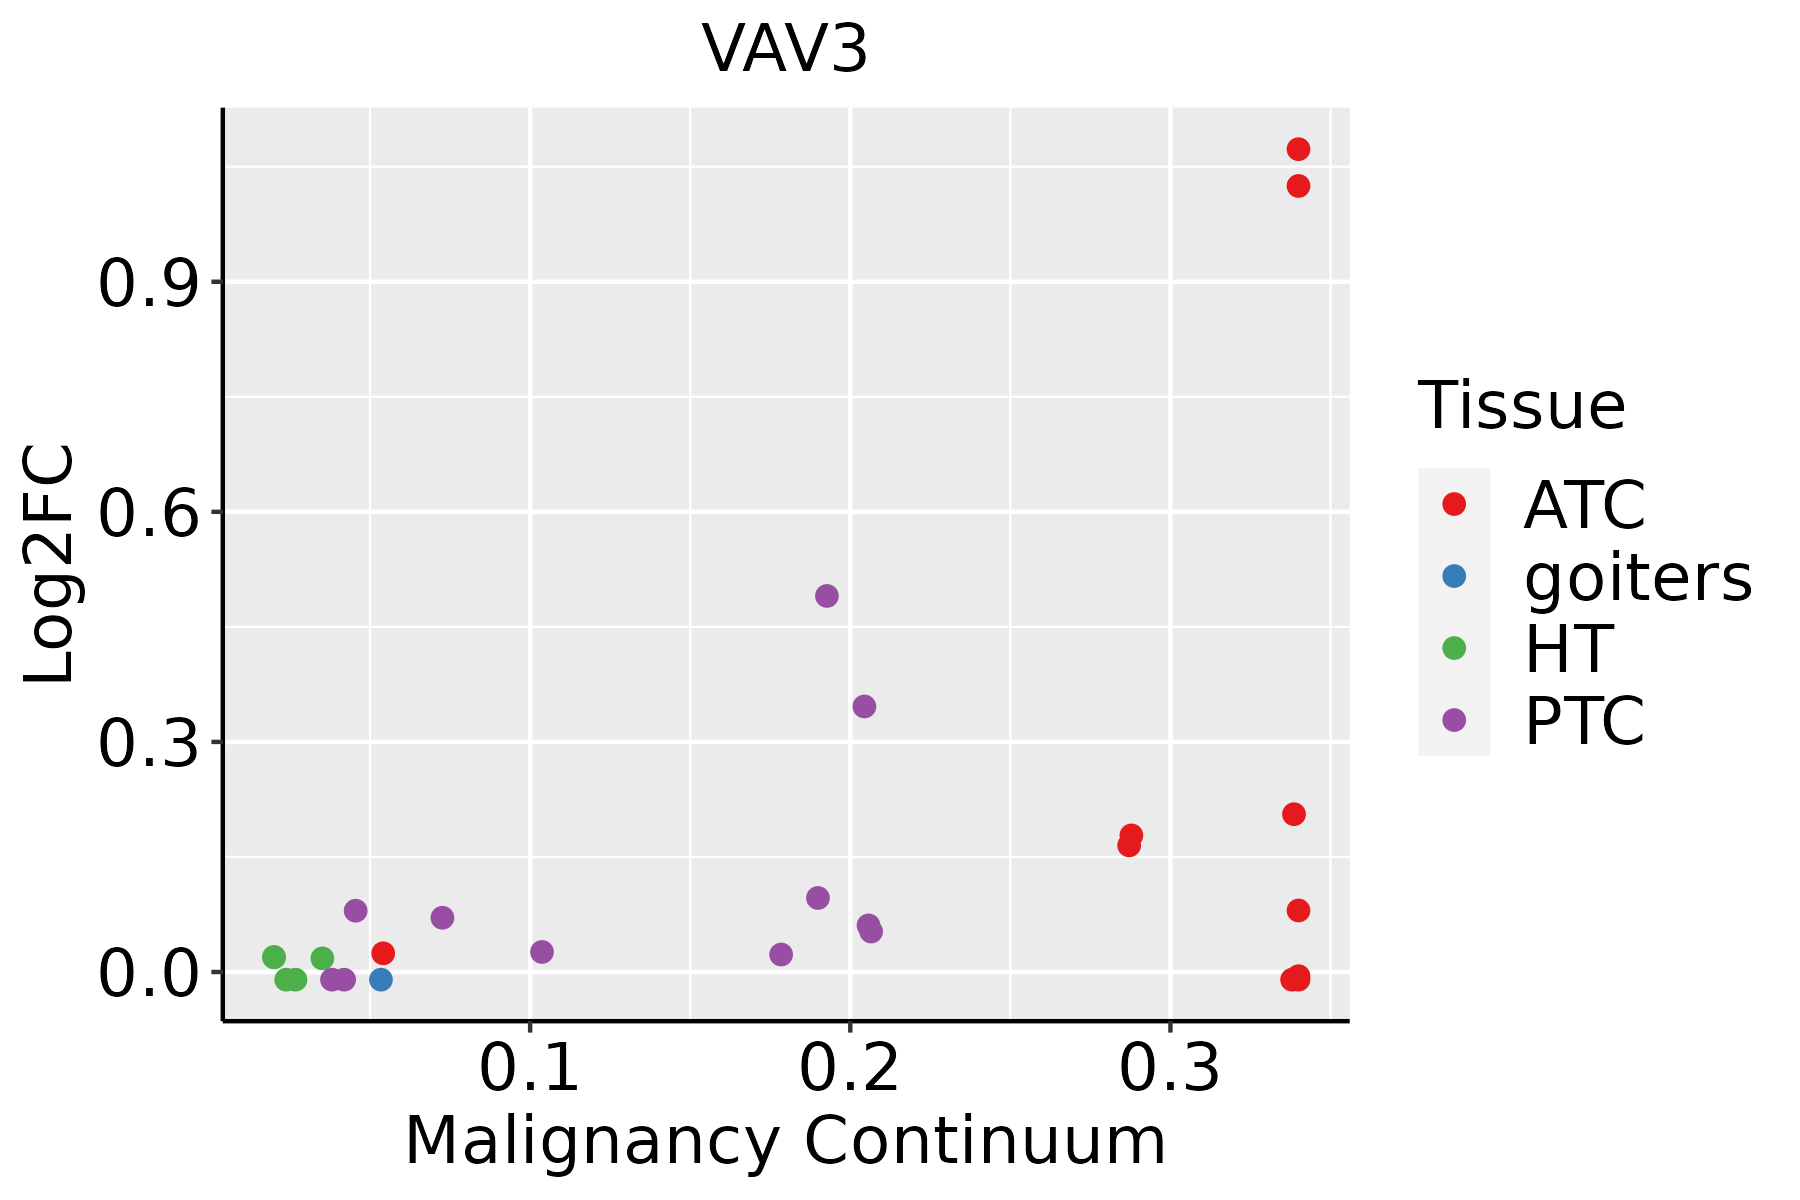 | ATC: Anaplastic thyroid cancer |
| HT: Hashimoto's thyroiditis | ||
| PTC: Papillary thyroid cancer |
| ∗log2FC in expression of this searched gene in stem-like cells from each diseased tissue sample relative to stem-like cells in normal samples in each tissue plotted against the malignancy continuum. Samples are colored based on if they are from different disease stage. |
Top |
Malignant transformation related pathway analysis |
| Find out the enriched GO biological processes and KEGG pathways involved in transition from healthy to precancer to cancer |
| Tissue | Disease Stage | Enriched GO biological Processes |
| Colorectum | AD |  |
| Colorectum | SER |  |
| Colorectum | MSS |  |
| Colorectum | MSI-H |  |
| Colorectum | FAP |  |
| ∗Top 15 enriched GO BP terms are showed in the bar plot of each disease state in each tissue. Each row represents a significant GO biological process which is colored according to the -log10(p.adjust). |
| Page: 1 2 3 4 5 6 7 8 9 |
| GO ID | Tissue | Disease Stage | Description | Gene Ratio | Bg Ratio | pvalue | p.adjust | Count |
| GO:00975297 | Breast | Precancer | myeloid leukocyte migration | 34/1080 | 220/18723 | 1.42e-07 | 7.82e-06 | 34 |
| GO:00509006 | Breast | Precancer | leukocyte migration | 47/1080 | 369/18723 | 2.82e-07 | 1.39e-05 | 47 |
| GO:00305956 | Breast | Precancer | leukocyte chemotaxis | 34/1080 | 230/18723 | 4.16e-07 | 1.89e-05 | 34 |
| GO:00457859 | Breast | Precancer | positive regulation of cell adhesion | 52/1080 | 437/18723 | 5.74e-07 | 2.49e-05 | 52 |
| GO:00603266 | Breast | Precancer | cell chemotaxis | 41/1080 | 310/18723 | 5.99e-07 | 2.55e-05 | 41 |
| GO:00716217 | Breast | Precancer | granulocyte chemotaxis | 23/1080 | 125/18723 | 6.73e-07 | 2.77e-05 | 23 |
| GO:00975307 | Breast | Precancer | granulocyte migration | 24/1080 | 148/18723 | 4.04e-06 | 1.26e-04 | 24 |
| GO:00420609 | Breast | Precancer | wound healing | 48/1080 | 422/18723 | 5.48e-06 | 1.63e-04 | 48 |
| GO:00305937 | Breast | Precancer | neutrophil chemotaxis | 19/1080 | 103/18723 | 5.94e-06 | 1.71e-04 | 19 |
| GO:19902665 | Breast | Precancer | neutrophil migration | 20/1080 | 122/18723 | 2.13e-05 | 4.99e-04 | 20 |
| GO:00508789 | Breast | Precancer | regulation of body fluid levels | 40/1080 | 379/18723 | 1.68e-04 | 2.77e-03 | 40 |
| GO:00094108 | Breast | Precancer | response to xenobiotic stimulus | 45/1080 | 462/18723 | 4.17e-04 | 5.56e-03 | 45 |
| GO:00192164 | Breast | Precancer | regulation of lipid metabolic process | 34/1080 | 331/18723 | 8.14e-04 | 9.55e-03 | 34 |
| GO:00075995 | Breast | Precancer | hemostasis | 24/1080 | 222/18723 | 2.31e-03 | 2.15e-02 | 24 |
| GO:00506712 | Breast | Precancer | positive regulation of lymphocyte proliferation | 17/1080 | 137/18723 | 2.32e-03 | 2.16e-02 | 17 |
| GO:00329462 | Breast | Precancer | positive regulation of mononuclear cell proliferation | 17/1080 | 138/18723 | 2.51e-03 | 2.29e-02 | 17 |
| GO:00336749 | Breast | Precancer | positive regulation of kinase activity | 42/1080 | 467/18723 | 2.94e-03 | 2.54e-02 | 42 |
| GO:00075965 | Breast | Precancer | blood coagulation | 23/1080 | 217/18723 | 3.61e-03 | 2.98e-02 | 23 |
| GO:00508175 | Breast | Precancer | coagulation | 23/1080 | 222/18723 | 4.78e-03 | 3.64e-02 | 23 |
| GO:0030168 | Breast | Precancer | platelet activation | 15/1080 | 123/18723 | 4.80e-03 | 3.64e-02 | 15 |
| Page: 1 2 3 4 5 6 7 8 9 10 11 12 13 14 15 16 17 18 19 20 21 22 23 24 25 |
| Pathway ID | Tissue | Disease Stage | Description | Gene Ratio | Bg Ratio | pvalue | p.adjust | qvalue | Count |
| hsa0541718 | Breast | Precancer | Lipid and atherosclerosis | 37/684 | 215/8465 | 7.64e-06 | 9.29e-05 | 7.12e-05 | 37 |
| hsa0467018 | Breast | Precancer | Leukocyte transendothelial migration | 20/684 | 114/8465 | 7.26e-04 | 5.33e-03 | 4.09e-03 | 20 |
| hsa0520514 | Breast | Precancer | Proteoglycans in cancer | 30/684 | 205/8465 | 1.00e-03 | 7.18e-03 | 5.50e-03 | 30 |
| hsa0541719 | Breast | Precancer | Lipid and atherosclerosis | 37/684 | 215/8465 | 7.64e-06 | 9.29e-05 | 7.12e-05 | 37 |
| hsa0467019 | Breast | Precancer | Leukocyte transendothelial migration | 20/684 | 114/8465 | 7.26e-04 | 5.33e-03 | 4.09e-03 | 20 |
| hsa0520515 | Breast | Precancer | Proteoglycans in cancer | 30/684 | 205/8465 | 1.00e-03 | 7.18e-03 | 5.50e-03 | 30 |
| hsa0520523 | Breast | IDC | Proteoglycans in cancer | 42/867 | 205/8465 | 7.69e-06 | 9.99e-05 | 7.48e-05 | 42 |
| hsa0541724 | Breast | IDC | Lipid and atherosclerosis | 35/867 | 215/8465 | 3.67e-03 | 2.29e-02 | 1.71e-02 | 35 |
| hsa0467024 | Breast | IDC | Leukocyte transendothelial migration | 21/867 | 114/8465 | 5.41e-03 | 3.13e-02 | 2.34e-02 | 21 |
| hsa0481014 | Breast | IDC | Regulation of actin cytoskeleton | 36/867 | 229/8465 | 5.79e-03 | 3.13e-02 | 2.34e-02 | 36 |
| hsa045109 | Breast | IDC | Focal adhesion | 32/867 | 203/8465 | 8.60e-03 | 4.23e-02 | 3.17e-02 | 32 |
| hsa0520533 | Breast | IDC | Proteoglycans in cancer | 42/867 | 205/8465 | 7.69e-06 | 9.99e-05 | 7.48e-05 | 42 |
| hsa0541734 | Breast | IDC | Lipid and atherosclerosis | 35/867 | 215/8465 | 3.67e-03 | 2.29e-02 | 1.71e-02 | 35 |
| hsa0467034 | Breast | IDC | Leukocyte transendothelial migration | 21/867 | 114/8465 | 5.41e-03 | 3.13e-02 | 2.34e-02 | 21 |
| hsa0481015 | Breast | IDC | Regulation of actin cytoskeleton | 36/867 | 229/8465 | 5.79e-03 | 3.13e-02 | 2.34e-02 | 36 |
| hsa0451013 | Breast | IDC | Focal adhesion | 32/867 | 203/8465 | 8.60e-03 | 4.23e-02 | 3.17e-02 | 32 |
| hsa0520542 | Breast | DCIS | Proteoglycans in cancer | 39/846 | 205/8465 | 5.36e-05 | 5.58e-04 | 4.11e-04 | 39 |
| hsa0467044 | Breast | DCIS | Leukocyte transendothelial migration | 21/846 | 114/8465 | 4.07e-03 | 2.31e-02 | 1.70e-02 | 21 |
| hsa0541744 | Breast | DCIS | Lipid and atherosclerosis | 34/846 | 215/8465 | 4.50e-03 | 2.46e-02 | 1.82e-02 | 34 |
| hsa0481023 | Breast | DCIS | Regulation of actin cytoskeleton | 35/846 | 229/8465 | 6.89e-03 | 3.37e-02 | 2.48e-02 | 35 |
| Page: 1 2 3 4 5 6 7 8 9 10 11 |
Top |
Cell-cell communication analysis |
| Identification of potential cell-cell interactions between two cell types and their ligand-receptor pairs for different disease states |
| Ligand | Receptor | LRpair | Pathway | Tissue | Disease Stage |
| Page: 1 |
Top |
Single-cell gene regulatory network inference analysis |
| Find out the significant the regulons (TFs) and the target genes of each regulon across cell types for different disease states |
| TF | Cell Type | Tissue | Disease Stage | Target Gene | RSS | Regulon Activity |
| ∗The dot plots of a searched regulon are shown for all cell subpopulations in each disease state of each tissue based on the regulon specific score inferred using pySCENIC and by calculating the average expression. |
| Page: 1 |
Top |
Somatic mutation of malignant transformation related genes |
| Annotation of somatic variants for genes involved in malignant transformation |
| Hugo Symbol | Variant Class | Variant Classification | dbSNP RS | HGVSc | HGVSp | HGVSp Short | SWISSPROT | BIOTYPE | SIFT | PolyPhen | Tumor Sample Barcode | Tissue | Histology | Sex | Age | Stage | Therapy Types | Drugs | Outcome |
| VAV3 | SNV | Missense_Mutation | c.1272A>C | p.Leu424Phe | p.L424F | Q9UKW4 | protein_coding | deleterious(0) | probably_damaging(0.96) | TCGA-AO-A1KR-01 | Breast | breast invasive carcinoma | Female | <65 | I/II | Chemotherapy | cyclophosphamide | SD | |
| VAV3 | SNV | Missense_Mutation | c.935N>C | p.Arg312Thr | p.R312T | Q9UKW4 | protein_coding | deleterious(0) | probably_damaging(0.965) | TCGA-BH-A0HP-01 | Breast | breast invasive carcinoma | Female | >=65 | III/IV | Chemotherapy | doxorubicin | SD | |
| VAV3 | deletion | In_Frame_Del | rs771926028 | c.175_177delNNN | p.Glu59del | p.E59del | Q9UKW4 | protein_coding | TCGA-D8-A1XZ-01 | Breast | breast invasive carcinoma | Female | >=65 | III/IV | Hormone Therapy | tamoxiphen+anastrozolum | SD | ||
| VAV3 | SNV | Missense_Mutation | novel | c.1276G>C | p.Asp426His | p.D426H | Q9UKW4 | protein_coding | deleterious(0.01) | possibly_damaging(0.893) | TCGA-C5-A2M1-01 | Cervix | cervical & endocervical cancer | Female | <65 | I/II | Unknown | Unknown | SD |
| VAV3 | SNV | Missense_Mutation | c.466N>A | p.Glu156Lys | p.E156K | Q9UKW4 | protein_coding | tolerated(0.06) | benign(0.24) | TCGA-FU-A3HY-01 | Cervix | cervical & endocervical cancer | Female | <65 | I/II | Chemotherapy | cisplatin | CR | |
| VAV3 | SNV | Missense_Mutation | c.2437G>C | p.Asp813His | p.D813H | Q9UKW4 | protein_coding | deleterious(0) | probably_damaging(0.998) | TCGA-FU-A40J-01 | Cervix | cervical & endocervical cancer | Female | <65 | III/IV | Chemotherapy | carboplatin | CR | |
| VAV3 | SNV | Missense_Mutation | c.22G>A | p.Ala8Thr | p.A8T | Q9UKW4 | protein_coding | tolerated(0.26) | benign(0.15) | TCGA-VS-A9U5-01 | Cervix | cervical & endocervical cancer | Female | <65 | I/II | Chemotherapy | cisplatin | CR | |
| VAV3 | SNV | Missense_Mutation | c.1464N>G | p.Asp488Glu | p.D488E | Q9UKW4 | protein_coding | tolerated(1) | benign(0.028) | TCGA-A6-6141-01 | Colorectum | colon adenocarcinoma | Male | <65 | I/II | Chemotherapy | 5-fu | SD | |
| VAV3 | SNV | Missense_Mutation | c.362N>T | p.Ala121Val | p.A121V | Q9UKW4 | protein_coding | deleterious(0.01) | benign(0.049) | TCGA-AA-3672-01 | Colorectum | colon adenocarcinoma | Female | >=65 | III/IV | Unknown | Unknown | SD | |
| VAV3 | SNV | Missense_Mutation | c.1711G>A | p.Gly571Arg | p.G571R | Q9UKW4 | protein_coding | tolerated(0.17) | benign(0.006) | TCGA-AA-3867-01 | Colorectum | colon adenocarcinoma | Male | >=65 | III/IV | Unknown | Unknown | PD |
| Page: 1 2 3 4 5 6 7 8 9 10 11 12 |
Top |
Related drugs of malignant transformation related genes |
| Identification of chemicals and drugs interact with genes involved in malignant transfromation |
| (DGIdb 4.0) |
| Entrez ID | Symbol | Category | Interaction Types | Drug Claim Name | Drug Name | PMIDs |
| Page: 1 |

Copyright 2023-Present -The University of Texas Health Science Center at Houston |