
|
|||||
|
 | |
| |
| |
| |
| |
| |
|
Gene: VAT1 |
Gene summary for VAT1 |
| Gene information | Species | Human | Gene symbol | VAT1 | Gene ID | 10493 |
| Gene name | vesicle amine transport 1 | |
| Gene Alias | VATI | |
| Cytomap | 17q21.31 | |
| Gene Type | protein-coding | GO ID | GO:0006996 | UniProtAcc | A0A024R1Z6 |
Top |
Malignant transformation analysis |
| Identification of the aberrant gene expression in precancerous and cancerous lesions by comparing the gene expression of stem-like cells in diseased tissues with normal stem cells |
| Entrez ID | Symbol | Replicates | Species | Organ | Tissue | Adj P-value | Log2FC | Malignancy |
| 10493 | VAT1 | LZE3D | Human | Esophagus | HGIN | 7.39e-04 | 3.79e-01 | 0.0668 |
| 10493 | VAT1 | LZE4T | Human | Esophagus | ESCC | 9.05e-10 | 4.09e-01 | 0.0811 |
| 10493 | VAT1 | LZE7T | Human | Esophagus | ESCC | 3.83e-03 | 3.44e-01 | 0.0667 |
| 10493 | VAT1 | LZE8T | Human | Esophagus | ESCC | 1.19e-02 | -1.32e-01 | 0.067 |
| 10493 | VAT1 | LZE22T | Human | Esophagus | ESCC | 1.68e-02 | 5.31e-01 | 0.068 |
| 10493 | VAT1 | LZE24T | Human | Esophagus | ESCC | 7.81e-10 | 6.45e-01 | 0.0596 |
| 10493 | VAT1 | LZE6T | Human | Esophagus | ESCC | 2.19e-05 | 7.55e-02 | 0.0845 |
| 10493 | VAT1 | P1T-E | Human | Esophagus | ESCC | 1.40e-03 | 5.18e-01 | 0.0875 |
| 10493 | VAT1 | P2T-E | Human | Esophagus | ESCC | 5.58e-22 | 2.28e-01 | 0.1177 |
| 10493 | VAT1 | P4T-E | Human | Esophagus | ESCC | 7.87e-22 | 7.25e-01 | 0.1323 |
| 10493 | VAT1 | P5T-E | Human | Esophagus | ESCC | 1.78e-25 | 6.61e-01 | 0.1327 |
| 10493 | VAT1 | P8T-E | Human | Esophagus | ESCC | 5.30e-14 | 3.18e-01 | 0.0889 |
| 10493 | VAT1 | P9T-E | Human | Esophagus | ESCC | 3.83e-02 | 3.16e-01 | 0.1131 |
| 10493 | VAT1 | P10T-E | Human | Esophagus | ESCC | 7.63e-09 | 9.80e-02 | 0.116 |
| 10493 | VAT1 | P11T-E | Human | Esophagus | ESCC | 2.06e-26 | 1.31e+00 | 0.1426 |
| 10493 | VAT1 | P12T-E | Human | Esophagus | ESCC | 7.13e-40 | 7.95e-01 | 0.1122 |
| 10493 | VAT1 | P15T-E | Human | Esophagus | ESCC | 3.54e-21 | 7.72e-01 | 0.1149 |
| 10493 | VAT1 | P16T-E | Human | Esophagus | ESCC | 2.28e-35 | 5.93e-01 | 0.1153 |
| 10493 | VAT1 | P17T-E | Human | Esophagus | ESCC | 3.29e-08 | 8.49e-01 | 0.1278 |
| 10493 | VAT1 | P19T-E | Human | Esophagus | ESCC | 5.08e-14 | 1.77e+00 | 0.1662 |
| Page: 1 2 3 4 5 6 |
| Tissue | Expression Dynamics | Abbreviation |
| Esophagus | 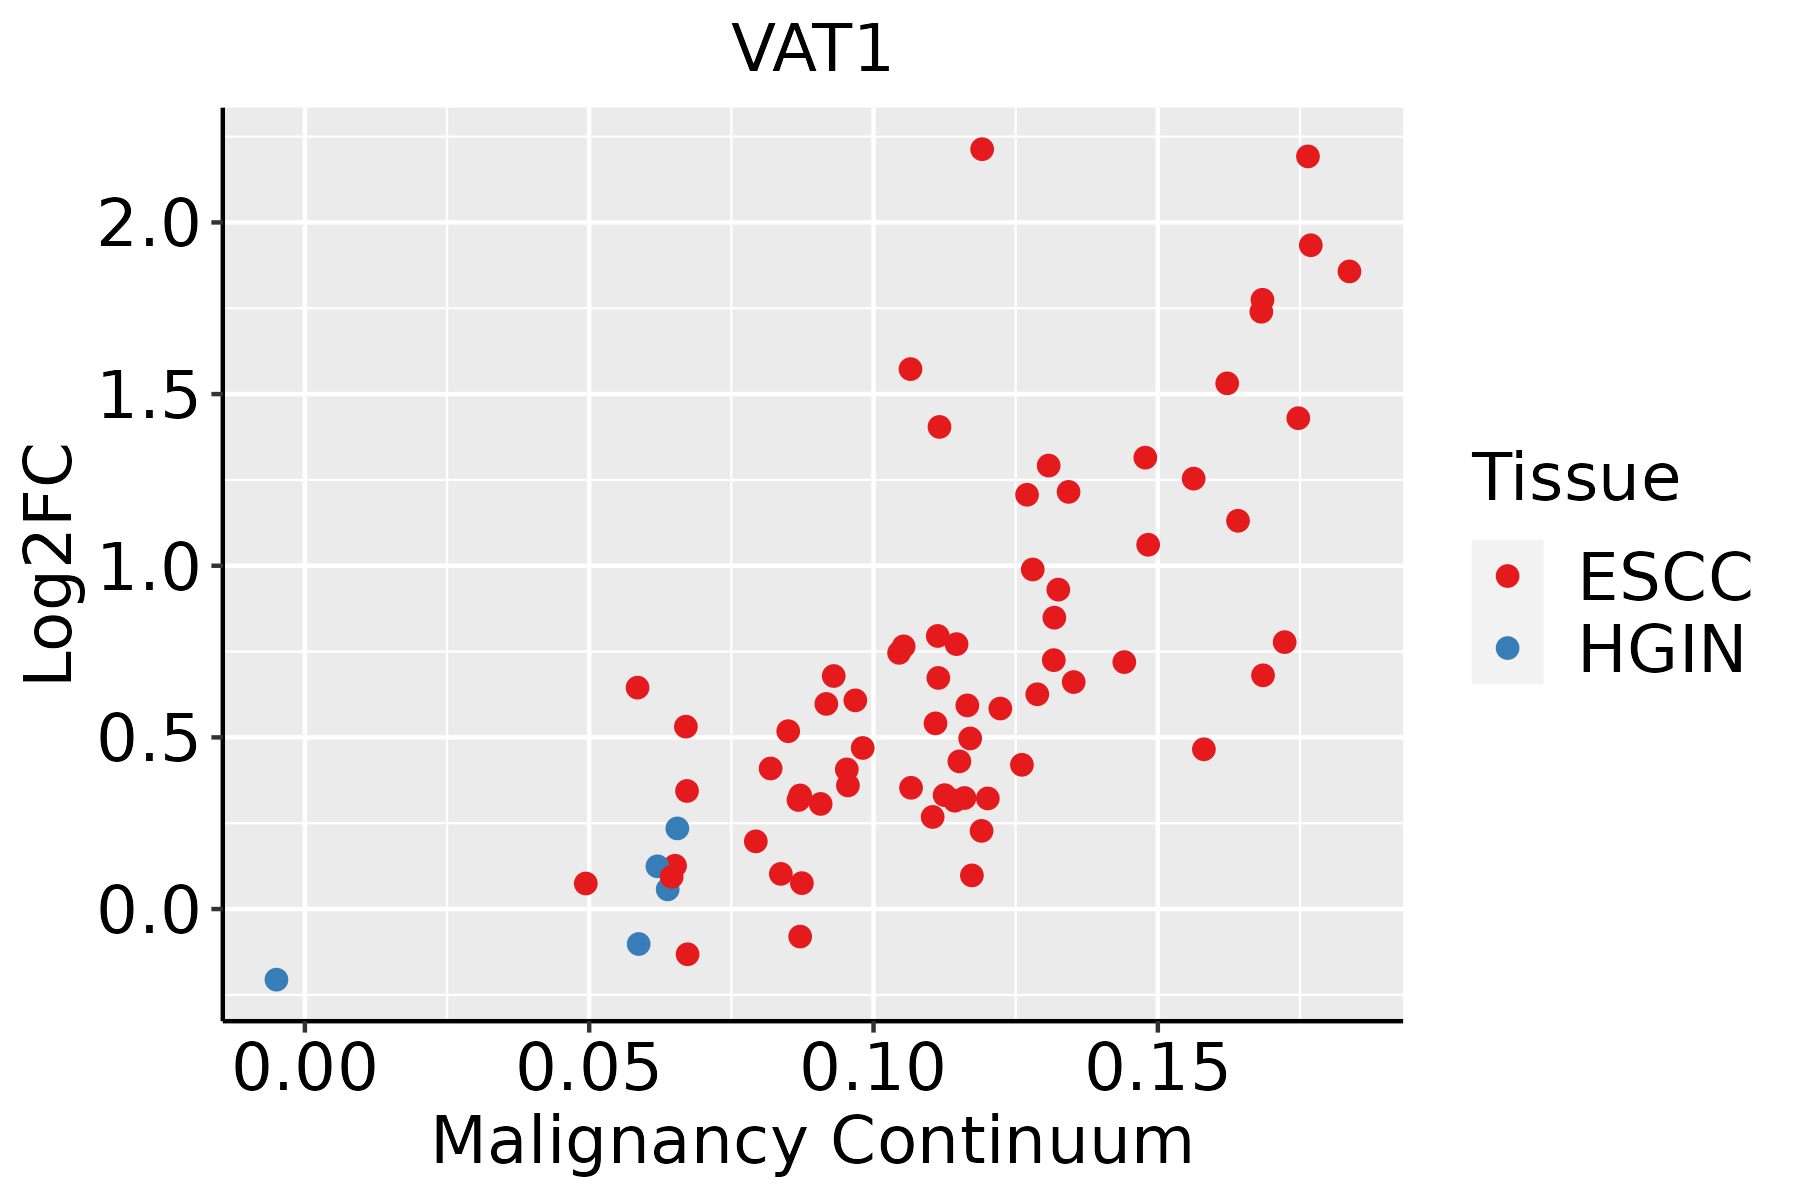 | ESCC: Esophageal squamous cell carcinoma |
| HGIN: High-grade intraepithelial neoplasias | ||
| LGIN: Low-grade intraepithelial neoplasias | ||
| Liver | 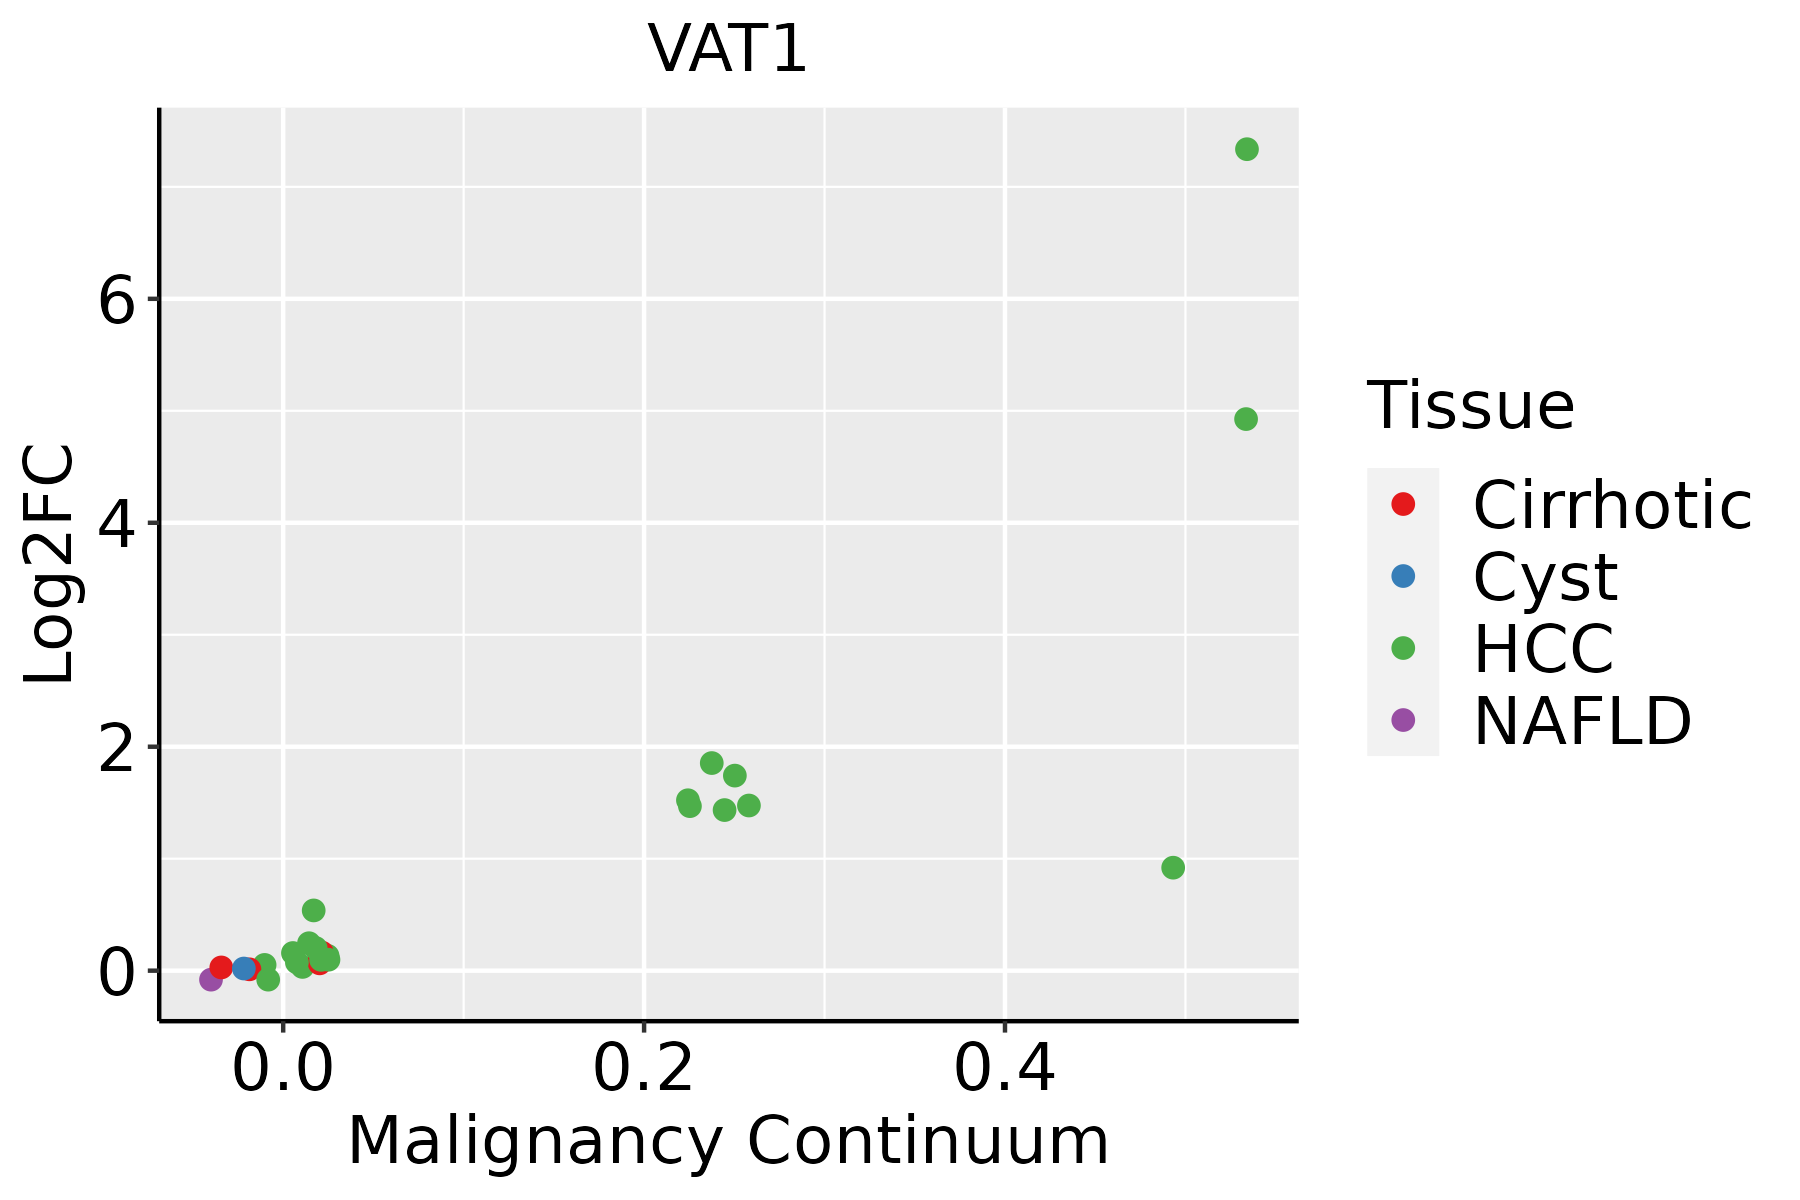 | HCC: Hepatocellular carcinoma |
| NAFLD: Non-alcoholic fatty liver disease | ||
| Oral Cavity | 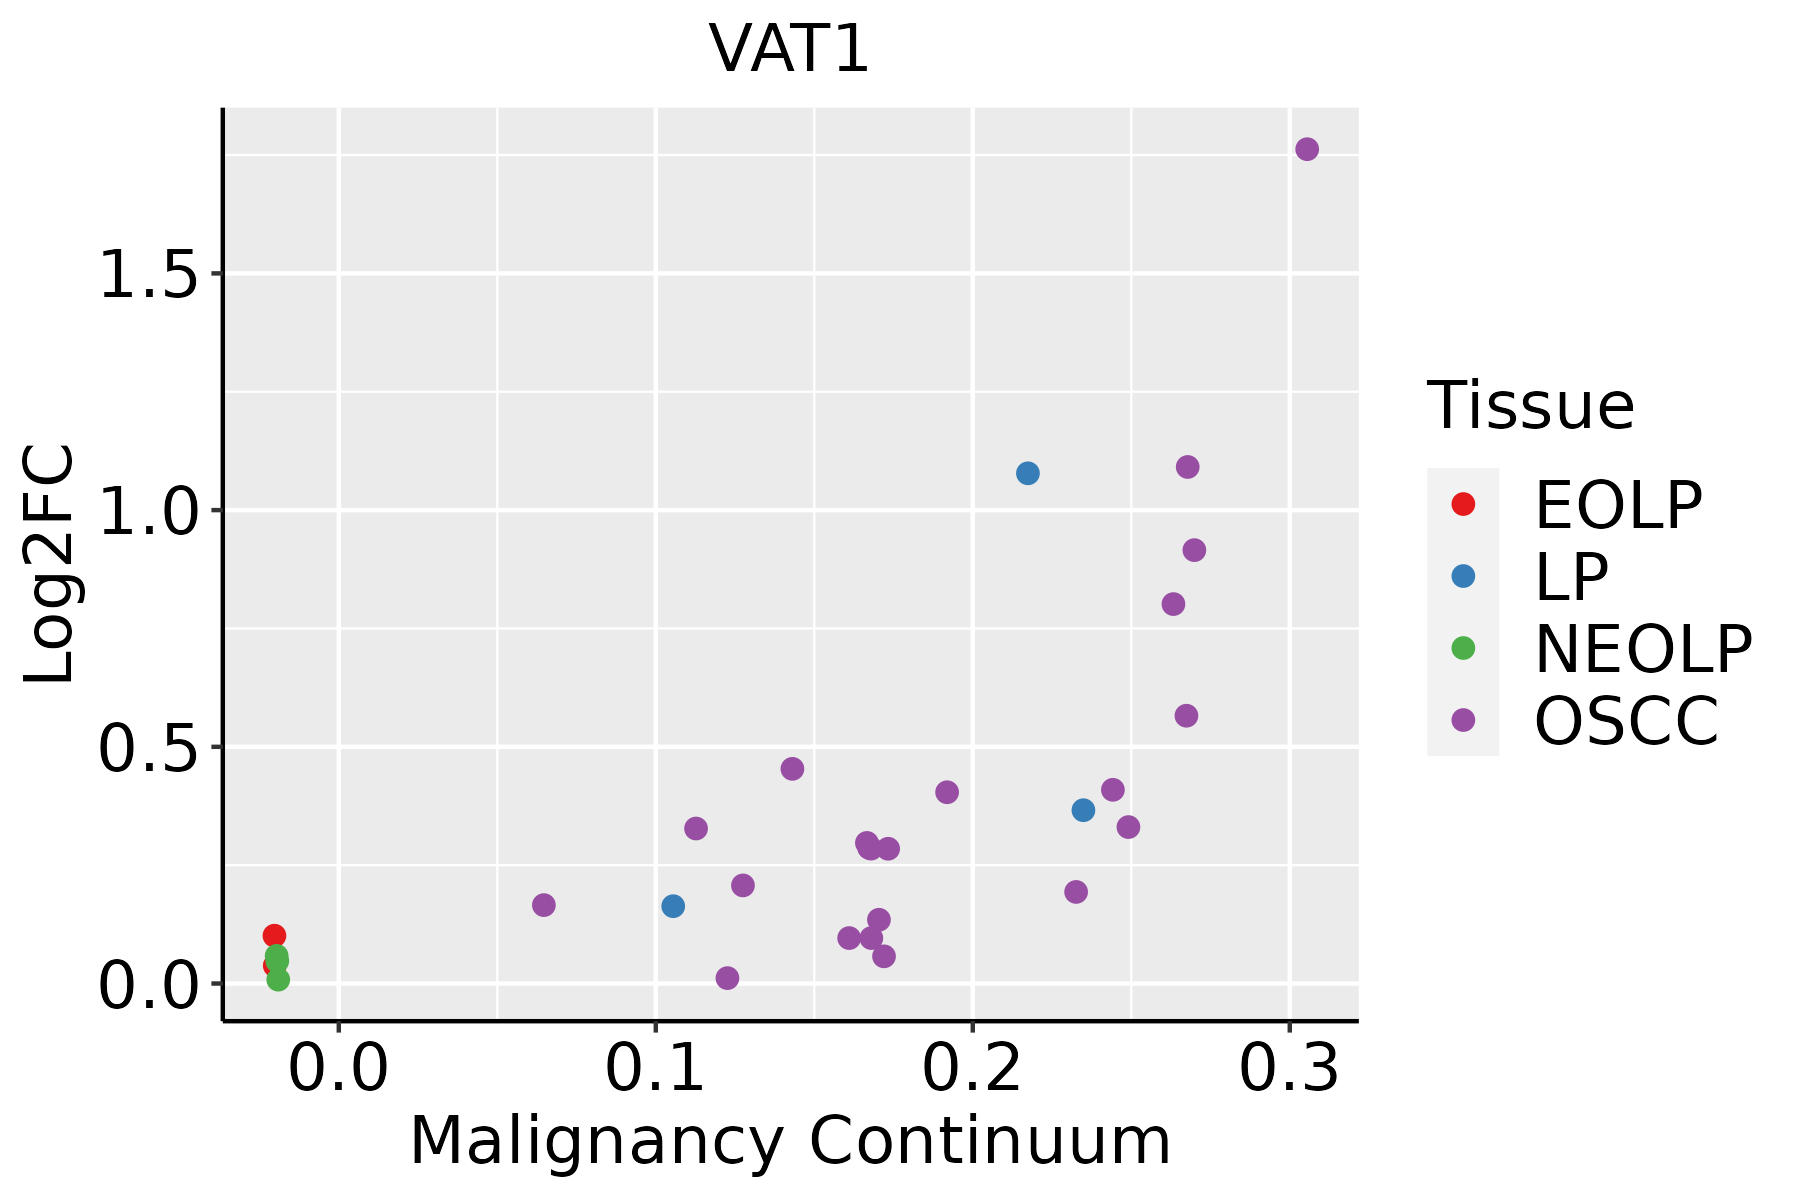 | EOLP: Erosive Oral lichen planus |
| LP: leukoplakia | ||
| NEOLP: Non-erosive oral lichen planus | ||
| OSCC: Oral squamous cell carcinoma | ||
| Thyroid | 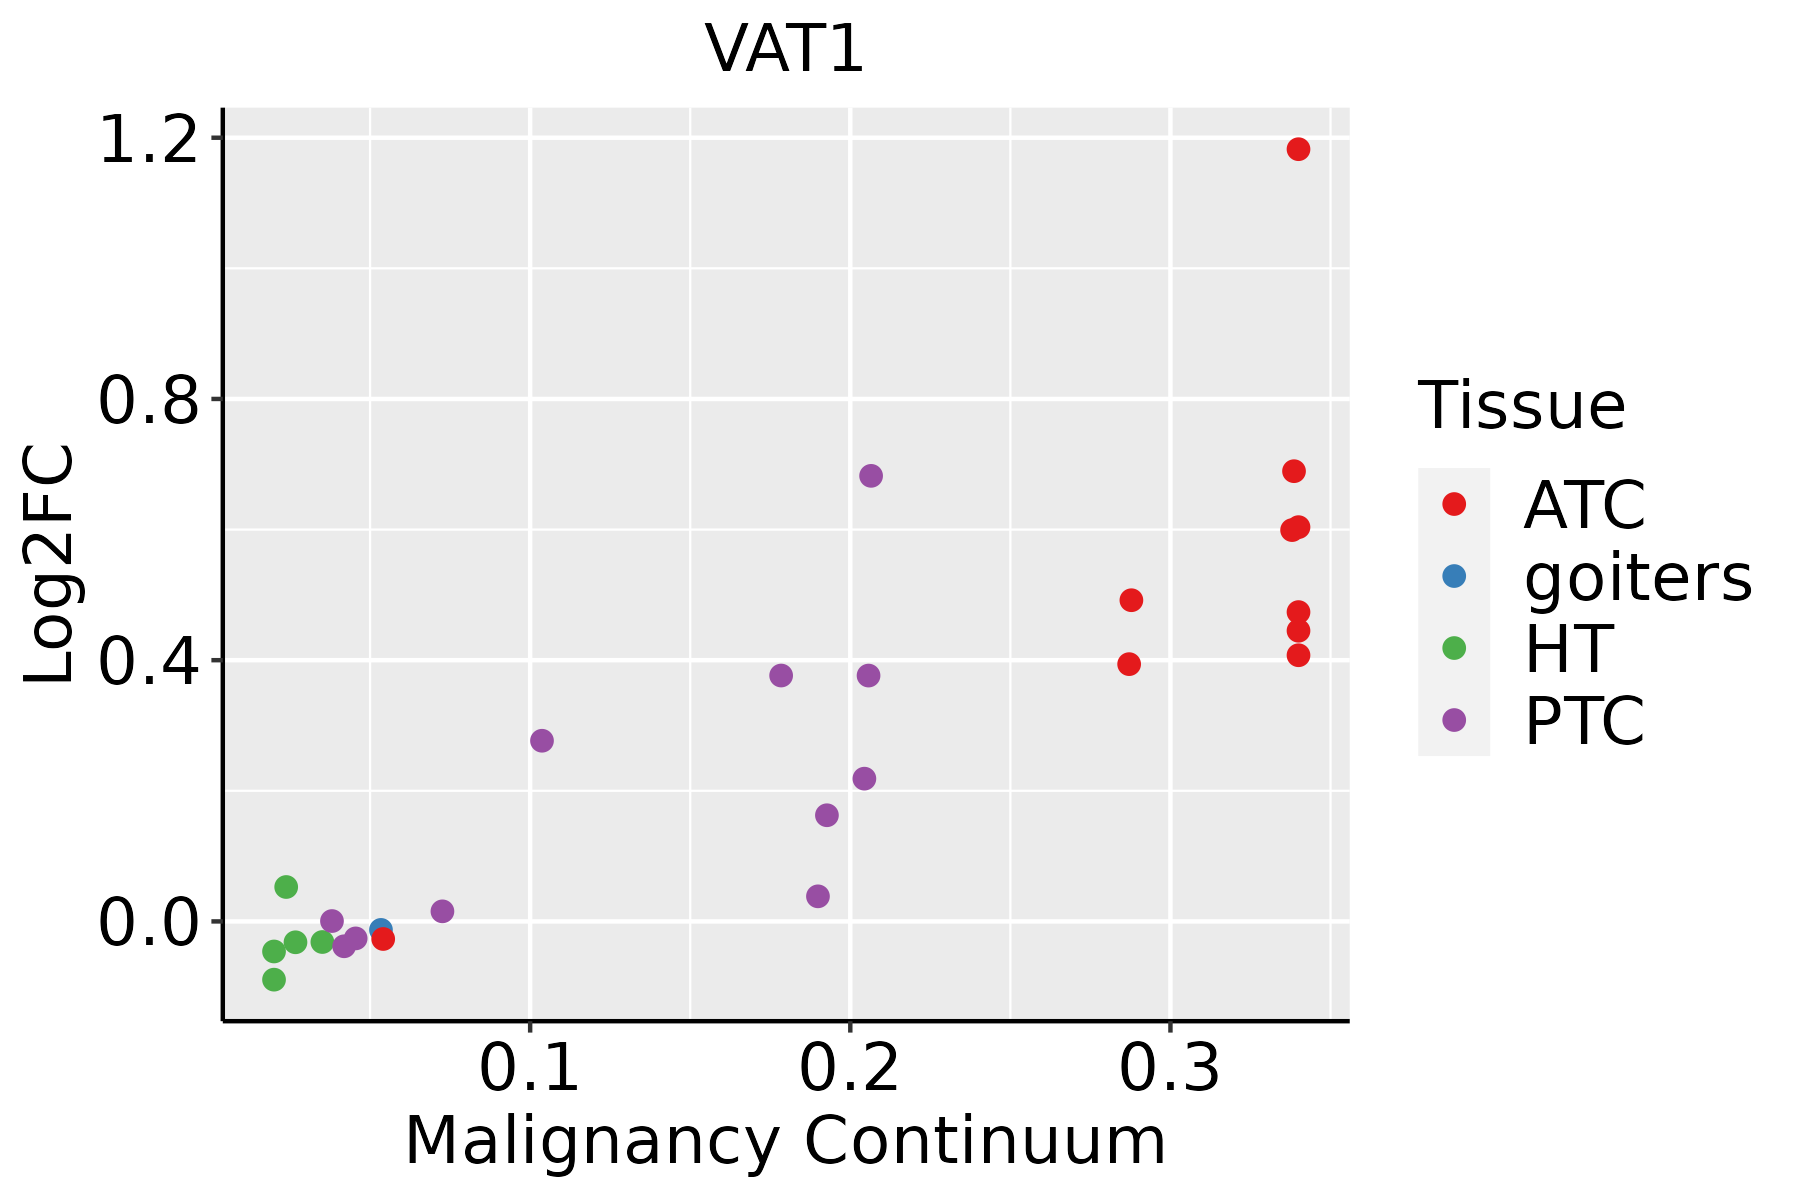 | ATC: Anaplastic thyroid cancer |
| HT: Hashimoto's thyroiditis | ||
| PTC: Papillary thyroid cancer |
| ∗log2FC in expression of this searched gene in stem-like cells from each diseased tissue sample relative to stem-like cells in normal samples in each tissue plotted against the malignancy continuum. Samples are colored based on if they are from different disease stage. |
Top |
Malignant transformation related pathway analysis |
| Find out the enriched GO biological processes and KEGG pathways involved in transition from healthy to precancer to cancer |
| Tissue | Disease Stage | Enriched GO biological Processes |
| Colorectum | AD |  |
| Colorectum | SER |  |
| Colorectum | MSS |  |
| Colorectum | MSI-H |  |
| Colorectum | FAP |  |
| ∗Top 15 enriched GO BP terms are showed in the bar plot of each disease state in each tissue. Each row represents a significant GO biological process which is colored according to the -log10(p.adjust). |
| Page: 1 2 3 4 5 6 7 8 9 |
| GO ID | Tissue | Disease Stage | Description | Gene Ratio | Bg Ratio | pvalue | p.adjust | Count |
| GO:0010821110 | Esophagus | ESCC | regulation of mitochondrion organization | 107/8552 | 144/18723 | 2.31e-12 | 9.41e-11 | 107 |
| GO:0010639110 | Esophagus | ESCC | negative regulation of organelle organization | 215/8552 | 348/18723 | 8.20e-10 | 2.01e-08 | 215 |
| GO:00482844 | Esophagus | ESCC | organelle fusion | 94/8552 | 141/18723 | 3.72e-07 | 5.16e-06 | 94 |
| GO:001082315 | Esophagus | ESCC | negative regulation of mitochondrion organization | 36/8552 | 49/18723 | 7.24e-05 | 5.45e-04 | 36 |
| GO:00080532 | Esophagus | ESCC | mitochondrial fusion | 20/8552 | 27/18723 | 2.61e-03 | 1.11e-02 | 20 |
| GO:00108216 | Liver | Cirrhotic | regulation of mitochondrion organization | 62/4634 | 144/18723 | 1.09e-06 | 2.22e-05 | 62 |
| GO:00106397 | Liver | Cirrhotic | negative regulation of organelle organization | 124/4634 | 348/18723 | 3.20e-06 | 5.60e-05 | 124 |
| GO:00482842 | Liver | Cirrhotic | organelle fusion | 52/4634 | 141/18723 | 8.77e-04 | 6.31e-03 | 52 |
| GO:00108236 | Liver | Cirrhotic | negative regulation of mitochondrion organization | 22/4634 | 49/18723 | 1.64e-03 | 1.05e-02 | 22 |
| GO:001063912 | Liver | HCC | negative regulation of organelle organization | 204/7958 | 348/18723 | 7.67e-10 | 2.37e-08 | 204 |
| GO:001082112 | Liver | HCC | regulation of mitochondrion organization | 96/7958 | 144/18723 | 3.82e-09 | 1.02e-07 | 96 |
| GO:001082312 | Liver | HCC | negative regulation of mitochondrion organization | 36/7958 | 49/18723 | 1.08e-05 | 1.24e-04 | 36 |
| GO:004828411 | Liver | HCC | organelle fusion | 84/7958 | 141/18723 | 3.13e-05 | 3.20e-04 | 84 |
| GO:0008053 | Liver | HCC | mitochondrial fusion | 19/7958 | 27/18723 | 3.18e-03 | 1.47e-02 | 19 |
| GO:001082117 | Oral cavity | OSCC | regulation of mitochondrion organization | 97/7305 | 144/18723 | 4.78e-12 | 1.83e-10 | 97 |
| GO:001063918 | Oral cavity | OSCC | negative regulation of organelle organization | 190/7305 | 348/18723 | 2.12e-09 | 4.97e-08 | 190 |
| GO:00482843 | Oral cavity | OSCC | organelle fusion | 82/7305 | 141/18723 | 3.08e-06 | 3.72e-05 | 82 |
| GO:00108239 | Oral cavity | OSCC | negative regulation of mitochondrion organization | 34/7305 | 49/18723 | 1.59e-05 | 1.59e-04 | 34 |
| GO:00080531 | Oral cavity | OSCC | mitochondrial fusion | 18/7305 | 27/18723 | 3.34e-03 | 1.42e-02 | 18 |
| GO:001082118 | Oral cavity | LP | regulation of mitochondrion organization | 65/4623 | 144/18723 | 6.61e-08 | 2.24e-06 | 65 |
| Page: 1 2 |
| Pathway ID | Tissue | Disease Stage | Description | Gene Ratio | Bg Ratio | pvalue | p.adjust | qvalue | Count |
| Page: 1 |
Top |
Cell-cell communication analysis |
| Identification of potential cell-cell interactions between two cell types and their ligand-receptor pairs for different disease states |
| Ligand | Receptor | LRpair | Pathway | Tissue | Disease Stage |
| Page: 1 |
Top |
Single-cell gene regulatory network inference analysis |
| Find out the significant the regulons (TFs) and the target genes of each regulon across cell types for different disease states |
| TF | Cell Type | Tissue | Disease Stage | Target Gene | RSS | Regulon Activity |
| ∗The dot plots of a searched regulon are shown for all cell subpopulations in each disease state of each tissue based on the regulon specific score inferred using pySCENIC and by calculating the average expression. |
| Page: 1 |
Top |
Somatic mutation of malignant transformation related genes |
| Annotation of somatic variants for genes involved in malignant transformation |
| Hugo Symbol | Variant Class | Variant Classification | dbSNP RS | HGVSc | HGVSp | HGVSp Short | SWISSPROT | BIOTYPE | SIFT | PolyPhen | Tumor Sample Barcode | Tissue | Histology | Sex | Age | Stage | Therapy Types | Drugs | Outcome |
| VAT1 | SNV | Missense_Mutation | novel | c.416N>A | p.Arg139Gln | p.R139Q | Q99536 | protein_coding | tolerated(0.15) | benign(0.228) | TCGA-EA-A410-01 | Cervix | cervical & endocervical cancer | Female | <65 | I/II | Unknown | Unknown | SD |
| VAT1 | SNV | Missense_Mutation | c.901N>A | p.Leu301Met | p.L301M | Q99536 | protein_coding | tolerated(0.62) | benign(0.091) | TCGA-A6-2686-01 | Colorectum | colon adenocarcinoma | Female | >=65 | I/II | Unknown | Unknown | SD | |
| VAT1 | SNV | Missense_Mutation | novel | c.587T>C | p.Met196Thr | p.M196T | Q99536 | protein_coding | tolerated(0.24) | benign(0.029) | TCGA-AA-3949-01 | Colorectum | colon adenocarcinoma | Female | >=65 | III/IV | Unknown | Unknown | SD |
| VAT1 | SNV | Missense_Mutation | rs751509304 | c.514N>G | p.Asn172Asp | p.N172D | Q99536 | protein_coding | deleterious(0) | benign(0.091) | TCGA-A5-A0GA-01 | Endometrium | uterine corpus endometrioid carcinoma | Female | >=65 | III/IV | Chemotherapy | taxol | PD |
| VAT1 | SNV | Missense_Mutation | rs145195905 | c.679G>A | p.Glu227Lys | p.E227K | Q99536 | protein_coding | deleterious(0.03) | benign(0.11) | TCGA-AJ-A2QO-01 | Endometrium | uterine corpus endometrioid carcinoma | Female | >=65 | I/II | Unknown | Unknown | SD |
| VAT1 | SNV | Missense_Mutation | novel | c.1133A>G | p.Lys378Arg | p.K378R | Q99536 | protein_coding | tolerated(0.12) | benign(0.005) | TCGA-AJ-A3BG-01 | Endometrium | uterine corpus endometrioid carcinoma | Female | >=65 | I/II | Chemotherapy | carboplatin | PD |
| VAT1 | SNV | Missense_Mutation | novel | c.500N>A | p.Ala167Asp | p.A167D | Q99536 | protein_coding | deleterious(0) | probably_damaging(0.991) | TCGA-AP-A059-01 | Endometrium | uterine corpus endometrioid carcinoma | Female | >=65 | I/II | Unknown | Unknown | SD |
| VAT1 | SNV | Missense_Mutation | novel | c.479N>T | p.Ala160Val | p.A160V | Q99536 | protein_coding | deleterious(0.05) | benign(0.078) | TCGA-AX-A1CE-01 | Endometrium | uterine corpus endometrioid carcinoma | Female | <65 | I/II | Unspecific | Paclitaxel | SD |
| VAT1 | SNV | Missense_Mutation | rs764944133 | c.908N>A | p.Arg303Gln | p.R303Q | Q99536 | protein_coding | deleterious(0) | possibly_damaging(0.625) | TCGA-D1-A167-01 | Endometrium | uterine corpus endometrioid carcinoma | Female | >=65 | I/II | Unknown | Unknown | SD |
| VAT1 | SNV | Missense_Mutation | novel | c.713N>A | p.Ile238Asn | p.I238N | Q99536 | protein_coding | deleterious(0) | probably_damaging(0.992) | TCGA-EO-A3AZ-01 | Endometrium | uterine corpus endometrioid carcinoma | Female | >=65 | I/II | Unknown | Unknown | SD |
| Page: 1 2 |
Top |
Related drugs of malignant transformation related genes |
| Identification of chemicals and drugs interact with genes involved in malignant transfromation |
| (DGIdb 4.0) |
| Entrez ID | Symbol | Category | Interaction Types | Drug Claim Name | Drug Name | PMIDs |
| Page: 1 |

Copyright 2023-Present -The University of Texas Health Science Center at Houston |