| Tissue | Expression Dynamics | Abbreviation |
| Esophagus | 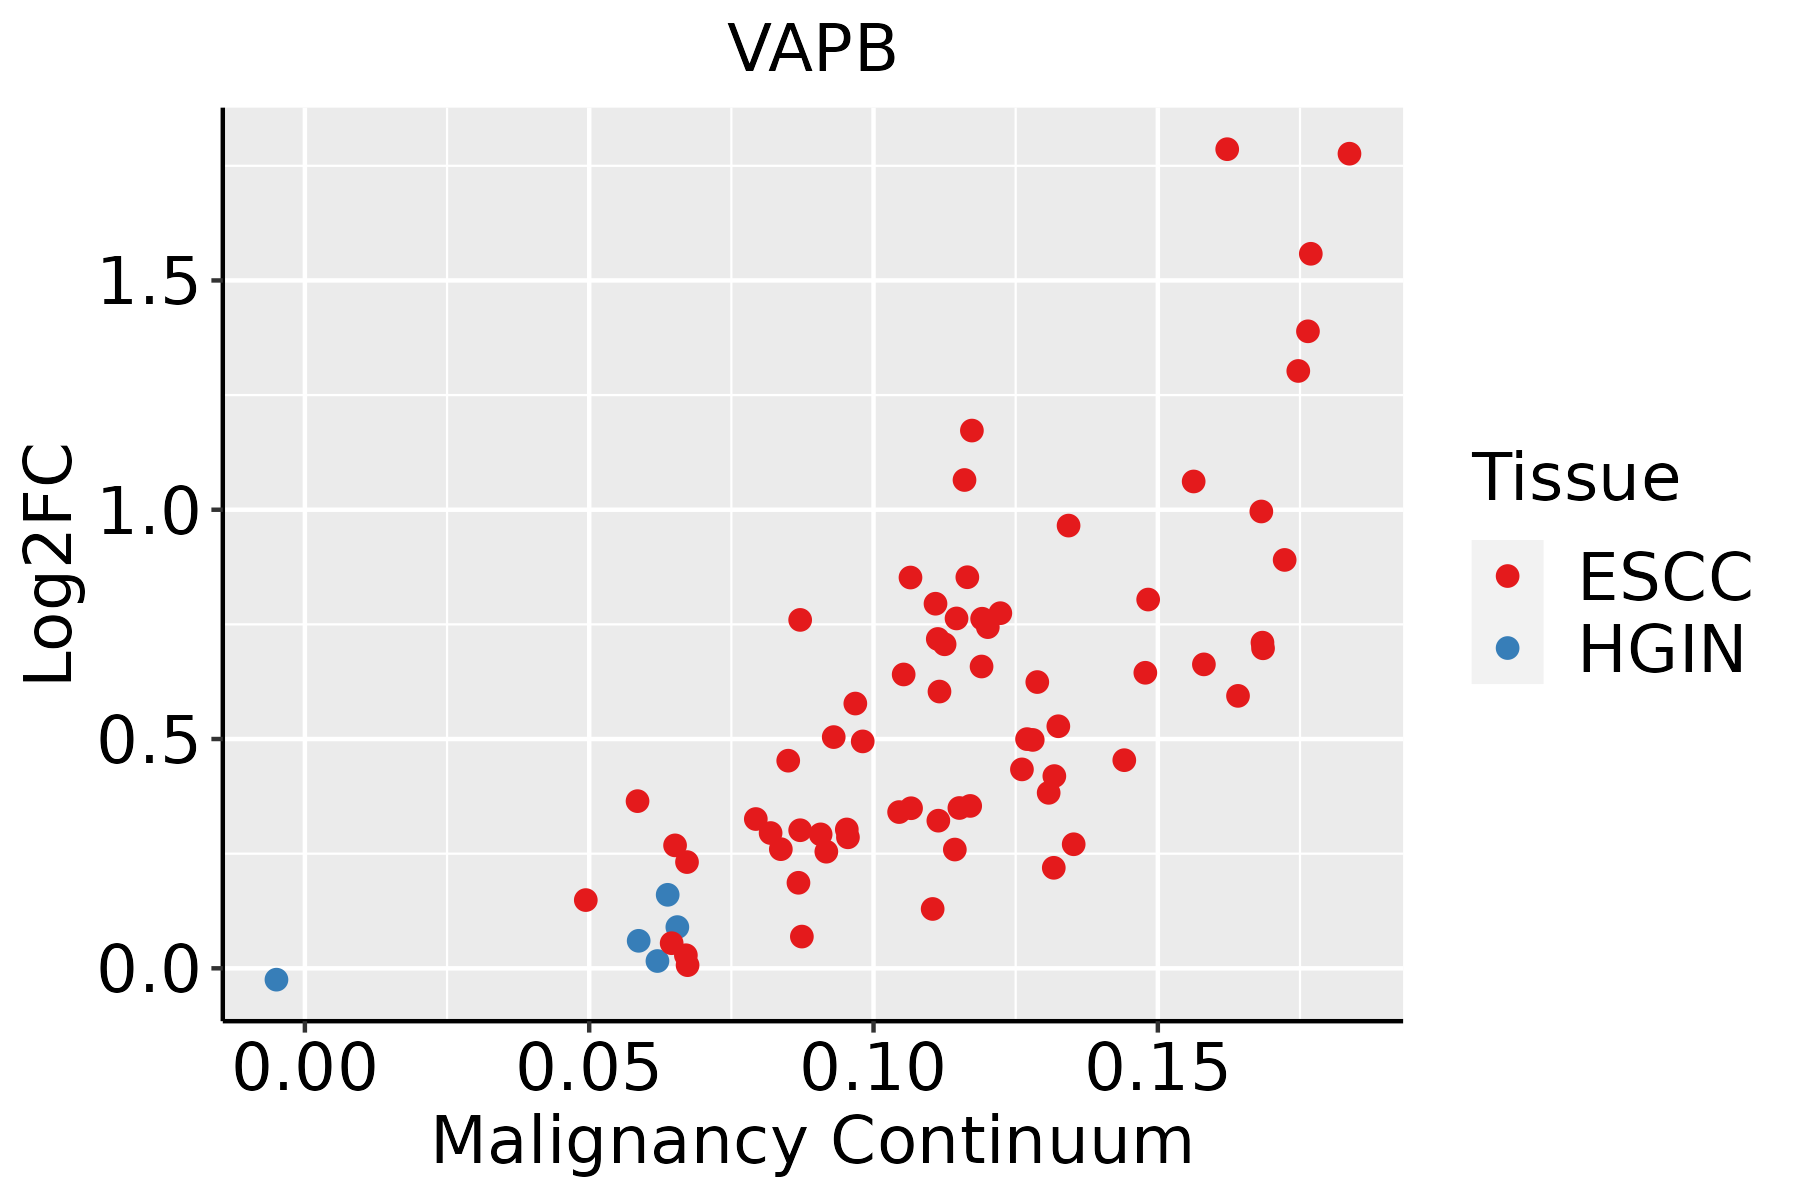 | ESCC: Esophageal squamous cell carcinoma |
| HGIN: High-grade intraepithelial neoplasias |
| LGIN: Low-grade intraepithelial neoplasias |
| Liver | 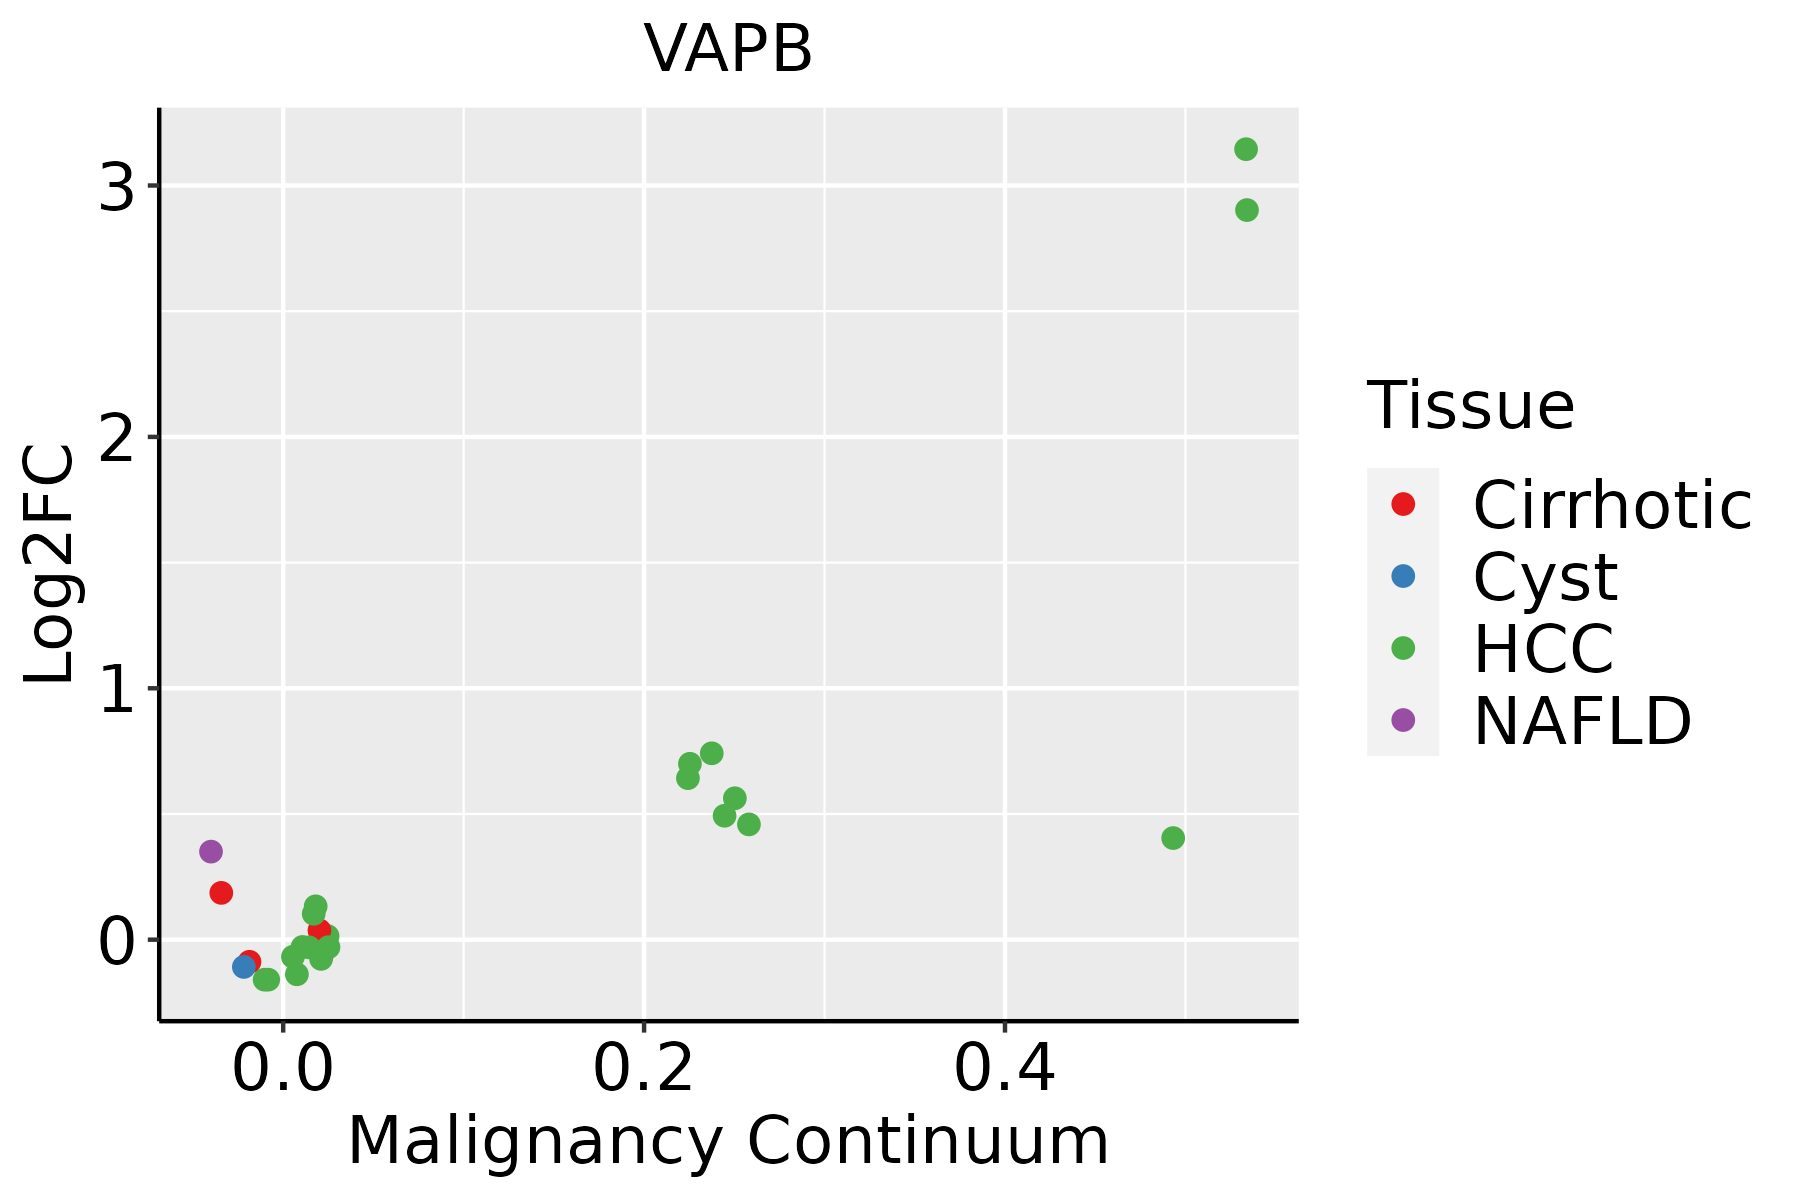 | HCC: Hepatocellular carcinoma |
| NAFLD: Non-alcoholic fatty liver disease |
| Oral Cavity | 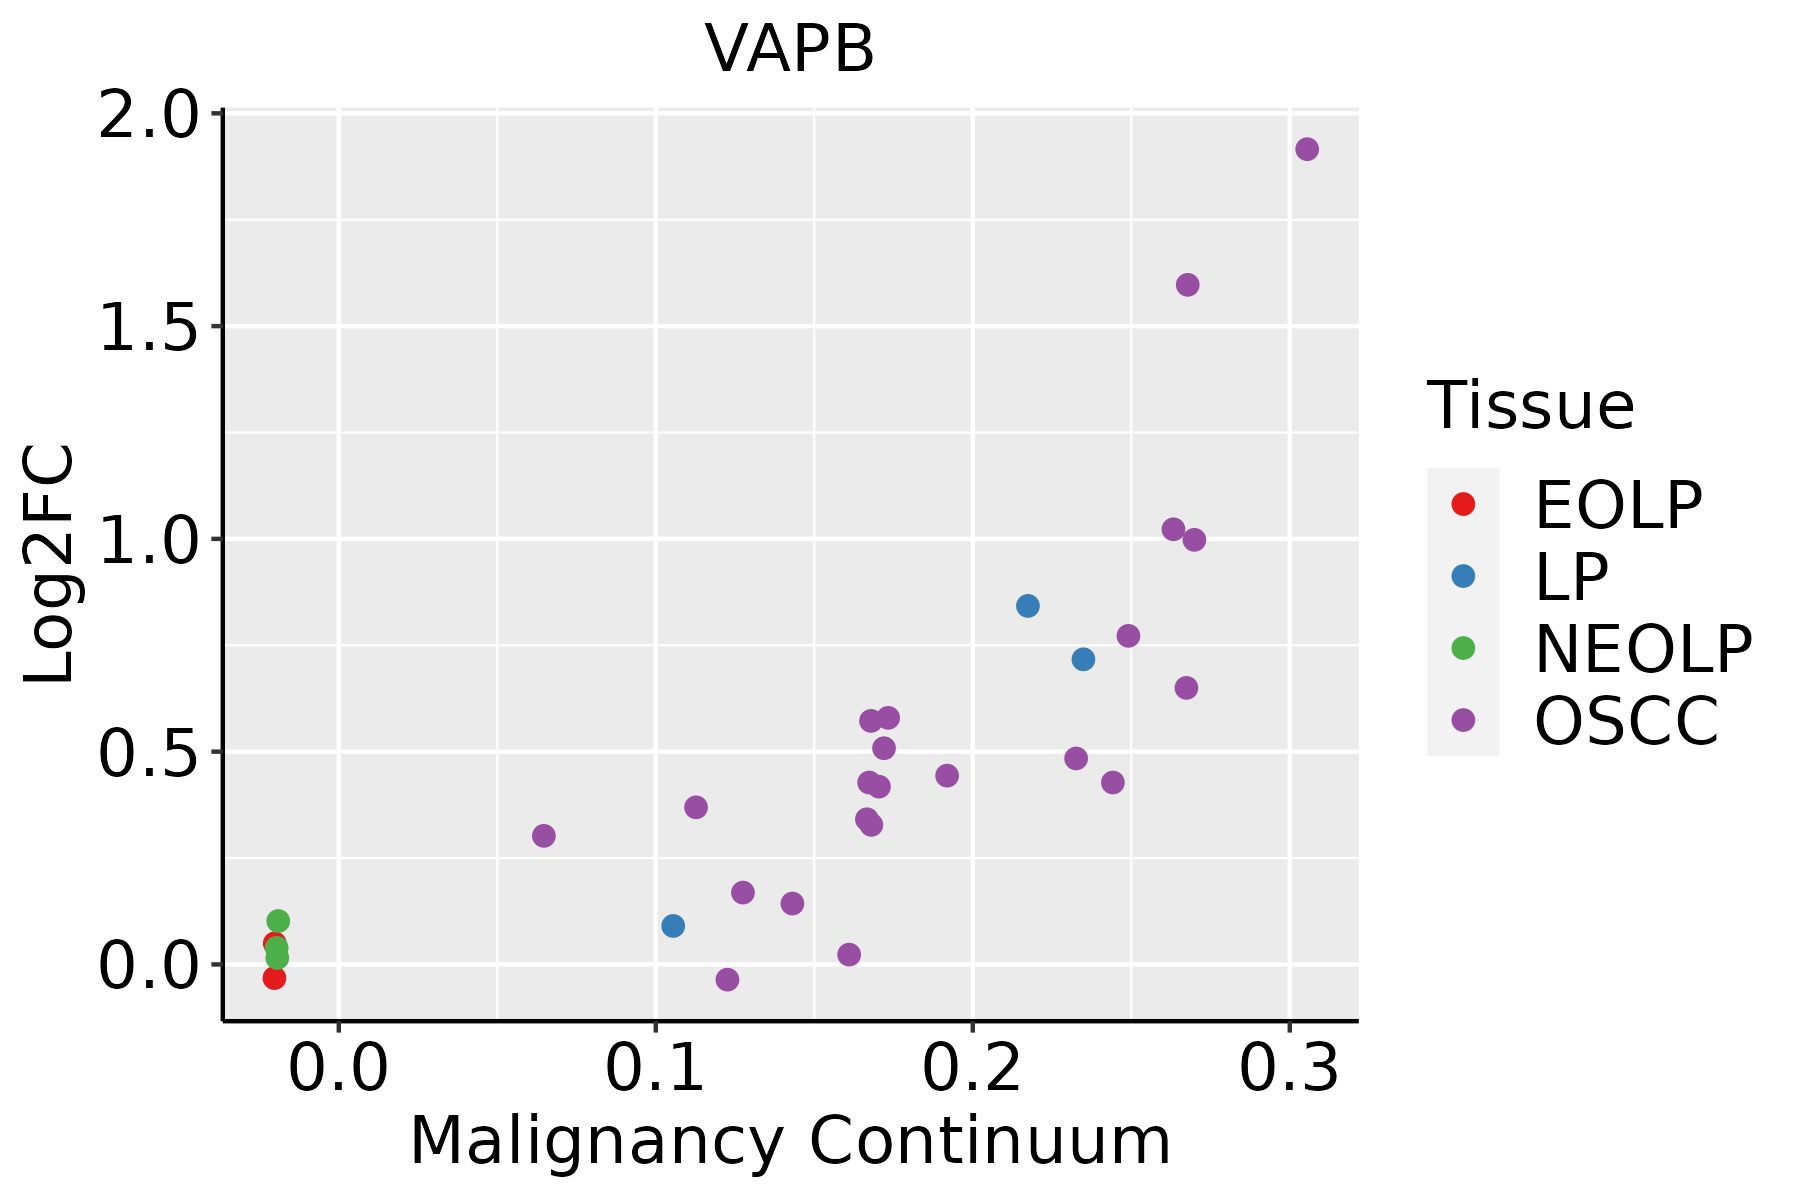 | EOLP: Erosive Oral lichen planus |
| LP: leukoplakia |
| NEOLP: Non-erosive oral lichen planus |
| OSCC: Oral squamous cell carcinoma |
| Prostate |  | BPH: Benign Prostatic Hyperplasia |
| Skin | 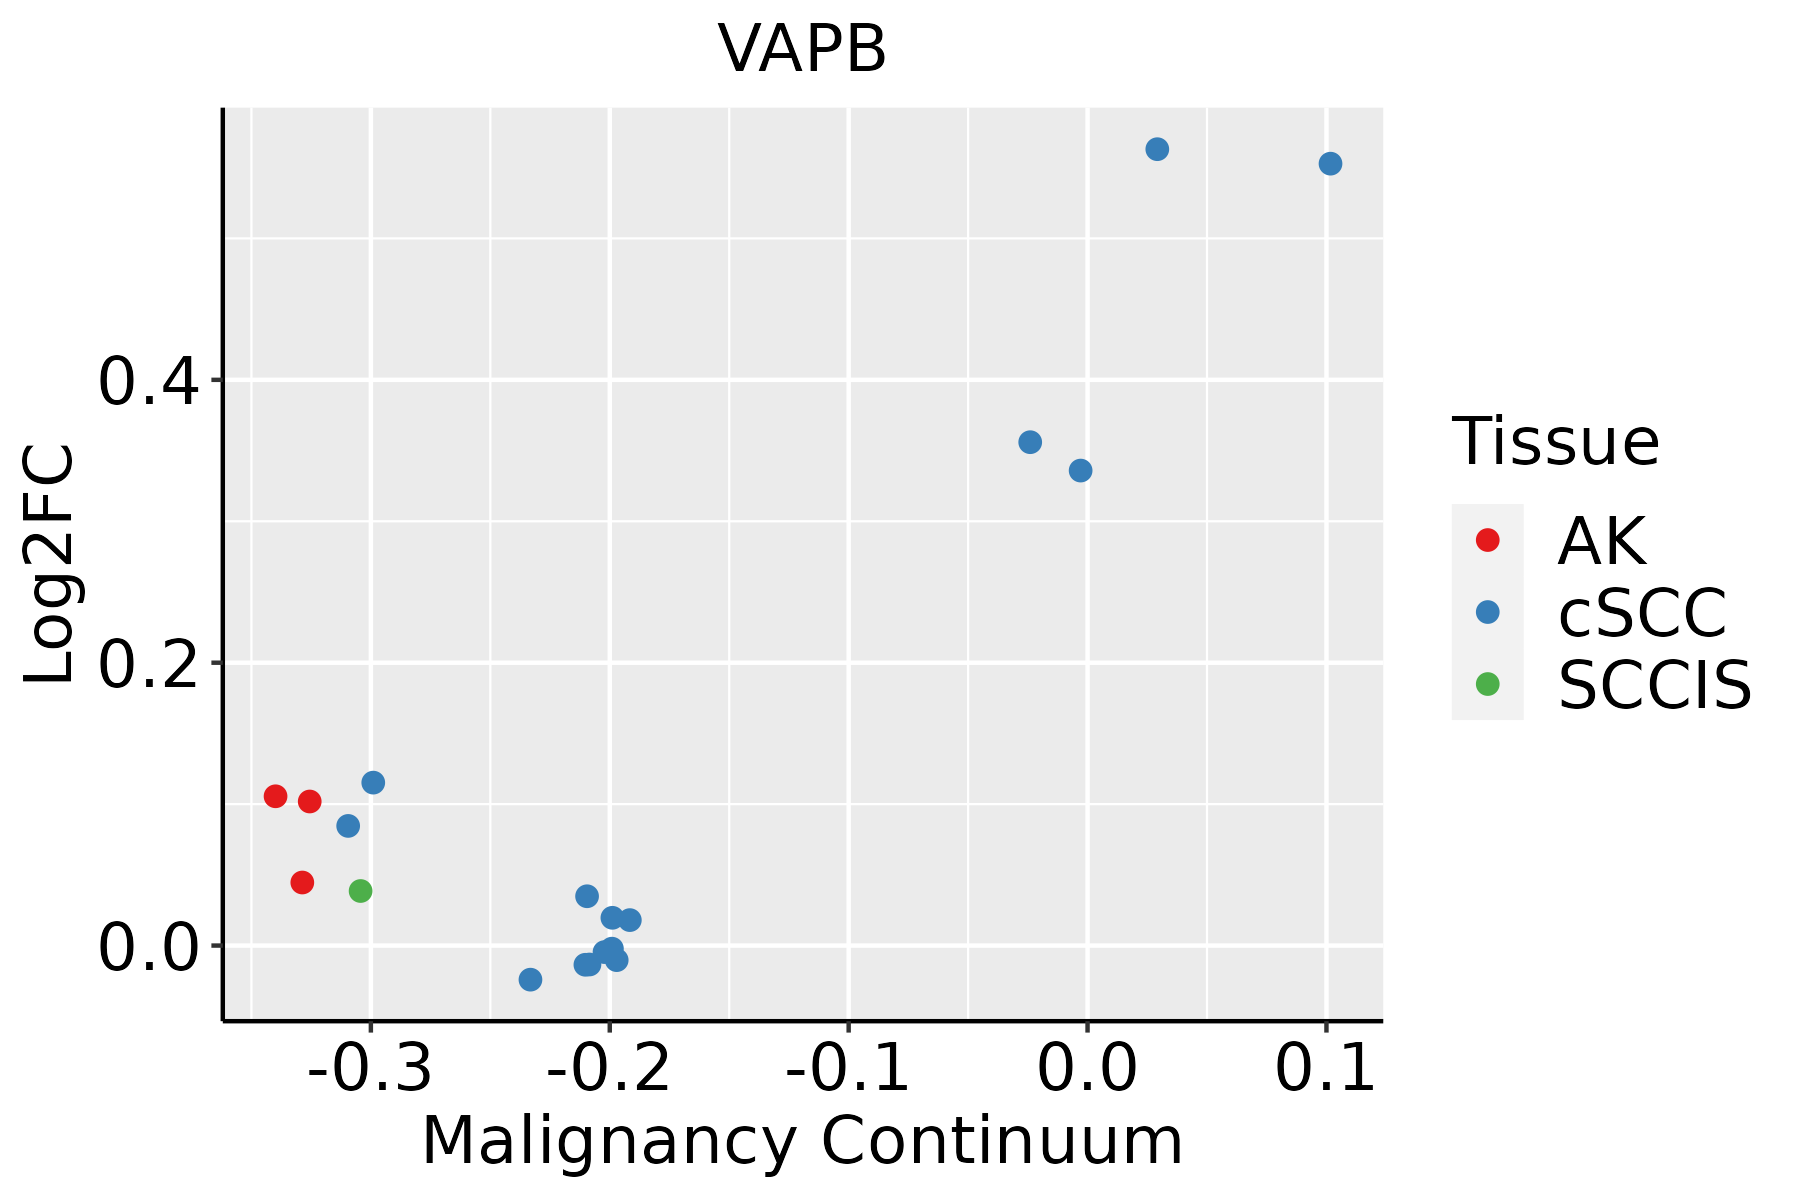 | AK: Actinic keratosis |
| cSCC: Cutaneous squamous cell carcinoma |
| SCCIS:squamous cell carcinoma in situ |
| Thyroid |  | ATC: Anaplastic thyroid cancer |
| HT: Hashimoto's thyroiditis |
| PTC: Papillary thyroid cancer |
| GO ID | Tissue | Disease Stage | Description | Gene Ratio | Bg Ratio | pvalue | p.adjust | Count |
| GO:004819318 | Esophagus | ESCC | Golgi vesicle transport | 231/8552 | 296/18723 | 1.82e-30 | 9.63e-28 | 231 |
| GO:0016032111 | Esophagus | ESCC | viral process | 301/8552 | 415/18723 | 3.34e-29 | 1.32e-26 | 301 |
| GO:0034976111 | Esophagus | ESCC | response to endoplasmic reticulum stress | 192/8552 | 256/18723 | 7.15e-22 | 1.30e-19 | 192 |
| GO:0019058111 | Esophagus | ESCC | viral life cycle | 226/8552 | 317/18723 | 1.17e-20 | 1.76e-18 | 226 |
| GO:001605014 | Esophagus | ESCC | vesicle organization | 211/8552 | 300/18723 | 2.85e-18 | 2.87e-16 | 211 |
| GO:0035966111 | Esophagus | ESCC | response to topologically incorrect protein | 125/8552 | 159/18723 | 1.44e-17 | 1.27e-15 | 125 |
| GO:0006986111 | Esophagus | ESCC | response to unfolded protein | 107/8552 | 137/18723 | 7.01e-15 | 3.87e-13 | 107 |
| GO:000688815 | Esophagus | ESCC | endoplasmic reticulum to Golgi vesicle-mediated transport | 102/8552 | 130/18723 | 1.73e-14 | 9.22e-13 | 102 |
| GO:0019079111 | Esophagus | ESCC | viral genome replication | 102/8552 | 131/18723 | 4.31e-14 | 2.19e-12 | 102 |
| GO:0035967111 | Esophagus | ESCC | cellular response to topologically incorrect protein | 90/8552 | 116/18723 | 1.94e-12 | 8.11e-11 | 90 |
| GO:0050792111 | Esophagus | ESCC | regulation of viral process | 119/8552 | 164/18723 | 2.19e-12 | 9.03e-11 | 119 |
| GO:0006900111 | Esophagus | ESCC | vesicle budding from membrane | 54/8552 | 61/18723 | 2.66e-12 | 1.07e-10 | 54 |
| GO:1903900111 | Esophagus | ESCC | regulation of viral life cycle | 106/8552 | 148/18723 | 1.26e-10 | 3.72e-09 | 106 |
| GO:0044403111 | Esophagus | ESCC | biological process involved in symbiotic interaction | 186/8552 | 290/18723 | 1.43e-10 | 4.16e-09 | 186 |
| GO:0034620111 | Esophagus | ESCC | cellular response to unfolded protein | 74/8552 | 96/18723 | 3.10e-10 | 8.66e-09 | 74 |
| GO:0045069110 | Esophagus | ESCC | regulation of viral genome replication | 67/8552 | 85/18723 | 3.81e-10 | 1.04e-08 | 67 |
| GO:0051701111 | Esophagus | ESCC | biological process involved in interaction with host | 135/8552 | 203/18723 | 1.49e-09 | 3.49e-08 | 135 |
| GO:003096818 | Esophagus | ESCC | endoplasmic reticulum unfolded protein response | 59/8552 | 74/18723 | 1.90e-09 | 4.36e-08 | 59 |
| GO:0048524110 | Esophagus | ESCC | positive regulation of viral process | 52/8552 | 65/18723 | 1.41e-08 | 2.77e-07 | 52 |
| GO:000702914 | Esophagus | ESCC | endoplasmic reticulum organization | 65/8552 | 87/18723 | 3.28e-08 | 6.08e-07 | 65 |
| Pathway ID | Tissue | Disease Stage | Description | Gene Ratio | Bg Ratio | pvalue | p.adjust | qvalue | Count |
| hsa05014210 | Esophagus | ESCC | Amyotrophic lateral sclerosis | 266/4205 | 364/8465 | 1.31e-20 | 2.20e-18 | 1.13e-18 | 266 |
| hsa05022210 | Esophagus | ESCC | Pathways of neurodegeneration - multiple diseases | 318/4205 | 476/8465 | 6.10e-15 | 2.04e-13 | 1.05e-13 | 318 |
| hsa0501438 | Esophagus | ESCC | Amyotrophic lateral sclerosis | 266/4205 | 364/8465 | 1.31e-20 | 2.20e-18 | 1.13e-18 | 266 |
| hsa0502238 | Esophagus | ESCC | Pathways of neurodegeneration - multiple diseases | 318/4205 | 476/8465 | 6.10e-15 | 2.04e-13 | 1.05e-13 | 318 |
| hsa0501414 | Liver | Cirrhotic | Amyotrophic lateral sclerosis | 187/2530 | 364/8465 | 1.56e-18 | 6.50e-17 | 4.01e-17 | 187 |
| hsa0502214 | Liver | Cirrhotic | Pathways of neurodegeneration - multiple diseases | 217/2530 | 476/8465 | 7.30e-14 | 2.03e-12 | 1.25e-12 | 217 |
| hsa049792 | Liver | Cirrhotic | Cholesterol metabolism | 30/2530 | 51/8465 | 1.59e-05 | 1.39e-04 | 8.60e-05 | 30 |
| hsa0501415 | Liver | Cirrhotic | Amyotrophic lateral sclerosis | 187/2530 | 364/8465 | 1.56e-18 | 6.50e-17 | 4.01e-17 | 187 |
| hsa0502215 | Liver | Cirrhotic | Pathways of neurodegeneration - multiple diseases | 217/2530 | 476/8465 | 7.30e-14 | 2.03e-12 | 1.25e-12 | 217 |
| hsa049793 | Liver | Cirrhotic | Cholesterol metabolism | 30/2530 | 51/8465 | 1.59e-05 | 1.39e-04 | 8.60e-05 | 30 |
| hsa0501422 | Liver | HCC | Amyotrophic lateral sclerosis | 252/4020 | 364/8465 | 8.85e-18 | 7.41e-16 | 4.12e-16 | 252 |
| hsa0502222 | Liver | HCC | Pathways of neurodegeneration - multiple diseases | 298/4020 | 476/8465 | 6.59e-12 | 1.30e-10 | 7.22e-11 | 298 |
| hsa049794 | Liver | HCC | Cholesterol metabolism | 41/4020 | 51/8465 | 1.33e-06 | 1.35e-05 | 7.49e-06 | 41 |
| hsa0501432 | Liver | HCC | Amyotrophic lateral sclerosis | 252/4020 | 364/8465 | 8.85e-18 | 7.41e-16 | 4.12e-16 | 252 |
| hsa0502232 | Liver | HCC | Pathways of neurodegeneration - multiple diseases | 298/4020 | 476/8465 | 6.59e-12 | 1.30e-10 | 7.22e-11 | 298 |
| hsa049795 | Liver | HCC | Cholesterol metabolism | 41/4020 | 51/8465 | 1.33e-06 | 1.35e-05 | 7.49e-06 | 41 |
| hsa0501428 | Oral cavity | OSCC | Amyotrophic lateral sclerosis | 246/3704 | 364/8465 | 6.65e-21 | 1.11e-18 | 5.67e-19 | 246 |
| hsa0502228 | Oral cavity | OSCC | Pathways of neurodegeneration - multiple diseases | 292/3704 | 476/8465 | 1.60e-15 | 4.47e-14 | 2.28e-14 | 292 |
| hsa05014112 | Oral cavity | OSCC | Amyotrophic lateral sclerosis | 246/3704 | 364/8465 | 6.65e-21 | 1.11e-18 | 5.67e-19 | 246 |
| hsa05022112 | Oral cavity | OSCC | Pathways of neurodegeneration - multiple diseases | 292/3704 | 476/8465 | 1.60e-15 | 4.47e-14 | 2.28e-14 | 292 |
| Hugo Symbol | Variant Class | Variant Classification | dbSNP RS | HGVSc | HGVSp | HGVSp Short | SWISSPROT | BIOTYPE | SIFT | PolyPhen | Tumor Sample Barcode | Tissue | Histology | Sex | Age | Stage | Therapy Types | Drugs | Outcome |
| VAPB | SNV | Missense_Mutation | | c.441G>C | p.Lys147Asn | p.K147N | O95292 | protein_coding | tolerated(0.08) | probably_damaging(0.994) | TCGA-AC-A23H-01 | Breast | breast invasive carcinoma | Female | >=65 | I/II | Unknown | Unknown | PD |
| VAPB | SNV | Missense_Mutation | novel | c.88N>G | p.Leu30Val | p.L30V | O95292 | protein_coding | deleterious(0) | probably_damaging(0.993) | TCGA-AC-A6IW-01 | Breast | breast invasive carcinoma | Female | >=65 | I/II | Unknown | Unknown | SD |
| VAPB | insertion | Nonsense_Mutation | novel | c.385_386insCAATGCATGGTTAGGTCTCAGTGGACTTTCTCTGTTCCC | p.Asn129delinsThrMetHisGlyTerValSerValAspPheLeuCysSerHis | p.N129delinsTMHG*VSVDFLCSH | O95292 | protein_coding | | | TCGA-A2-A0EM-01 | Breast | breast invasive carcinoma | Female | >=65 | I/II | Hormone Therapy | tamoxiphen | SD |
| VAPB | SNV | Missense_Mutation | novel | c.142N>T | p.Ala48Ser | p.A48S | O95292 | protein_coding | deleterious(0) | possibly_damaging(0.729) | TCGA-2W-A8YY-01 | Cervix | cervical & endocervical cancer | Female | <65 | I/II | Chemotherapy | cisplatin | CR |
| VAPB | SNV | Missense_Mutation | novel | c.404N>C | p.Val135Ala | p.V135A | O95292 | protein_coding | tolerated(0.25) | benign(0.003) | TCGA-CA-6717-01 | Colorectum | colon adenocarcinoma | Male | <65 | I/II | Chemotherapy | oxaliplatin | CR |
| VAPB | SNV | Missense_Mutation | | c.487N>A | p.Asp163Asn | p.D163N | O95292 | protein_coding | deleterious(0.01) | probably_damaging(0.996) | TCGA-QG-A5Z2-01 | Colorectum | colon adenocarcinoma | Male | <65 | I/II | Unknown | Unknown | SD |
| VAPB | SNV | Missense_Mutation | novel | c.340N>A | p.Leu114Ile | p.L114I | O95292 | protein_coding | tolerated(0.12) | probably_damaging(0.99) | TCGA-A5-A0G2-01 | Endometrium | uterine corpus endometrioid carcinoma | Female | <65 | III/IV | Unknown | Unknown | SD |
| VAPB | SNV | Missense_Mutation | novel | c.329A>C | p.Lys110Thr | p.K110T | O95292 | protein_coding | tolerated(0.05) | probably_damaging(0.998) | TCGA-AJ-A5DW-01 | Endometrium | uterine corpus endometrioid carcinoma | Female | <65 | I/II | Unknown | Unknown | SD |
| VAPB | SNV | Missense_Mutation | rs149215094 | c.700N>A | p.Val234Ile | p.V234I | O95292 | protein_coding | tolerated(0.88) | benign(0.003) | TCGA-AP-A051-01 | Endometrium | uterine corpus endometrioid carcinoma | Female | >=65 | I/II | Unknown | Unknown | SD |
| VAPB | SNV | Missense_Mutation | | c.151N>G | p.Arg51Gly | p.R51G | O95292 | protein_coding | deleterious(0) | probably_damaging(0.998) | TCGA-AP-A056-01 | Endometrium | uterine corpus endometrioid carcinoma | Female | <65 | I/II | Unknown | Unknown | SD |


