
|
|||||
|
 | |
| |
| |
| |
| |
| |
|
Gene: VAPA |
Gene summary for VAPA |
| Gene information | Species | Human | Gene symbol | VAPA | Gene ID | 9218 |
| Gene name | VAMP associated protein A | |
| Gene Alias | VAMP-A | |
| Cytomap | 18p11.22 | |
| Gene Type | protein-coding | GO ID | GO:0006810 | UniProtAcc | Q9P0L0 |
Top |
Malignant transformation analysis |
| Identification of the aberrant gene expression in precancerous and cancerous lesions by comparing the gene expression of stem-like cells in diseased tissues with normal stem cells |
| Entrez ID | Symbol | Replicates | Species | Organ | Tissue | Adj P-value | Log2FC | Malignancy |
| 9218 | VAPA | GSM4909285 | Human | Breast | IDC | 1.17e-03 | -1.03e-01 | 0.21 |
| 9218 | VAPA | GSM4909286 | Human | Breast | IDC | 5.23e-11 | -3.16e-01 | 0.1081 |
| 9218 | VAPA | GSM4909293 | Human | Breast | IDC | 2.76e-06 | -1.01e-01 | 0.1581 |
| 9218 | VAPA | GSM4909294 | Human | Breast | IDC | 2.65e-03 | -3.47e-01 | 0.2022 |
| 9218 | VAPA | GSM4909296 | Human | Breast | IDC | 4.32e-18 | -5.85e-01 | 0.1524 |
| 9218 | VAPA | GSM4909297 | Human | Breast | IDC | 4.20e-18 | -2.31e-01 | 0.1517 |
| 9218 | VAPA | GSM4909298 | Human | Breast | IDC | 2.58e-04 | -2.17e-01 | 0.1551 |
| 9218 | VAPA | GSM4909301 | Human | Breast | IDC | 2.56e-03 | -3.48e-01 | 0.1577 |
| 9218 | VAPA | GSM4909311 | Human | Breast | IDC | 1.84e-43 | -7.11e-01 | 0.1534 |
| 9218 | VAPA | GSM4909312 | Human | Breast | IDC | 3.79e-17 | -5.10e-01 | 0.1552 |
| 9218 | VAPA | GSM4909313 | Human | Breast | IDC | 3.54e-02 | -1.73e-01 | 0.0391 |
| 9218 | VAPA | GSM4909319 | Human | Breast | IDC | 5.22e-57 | -6.49e-01 | 0.1563 |
| 9218 | VAPA | GSM4909320 | Human | Breast | IDC | 1.70e-09 | -5.64e-01 | 0.1575 |
| 9218 | VAPA | GSM4909321 | Human | Breast | IDC | 4.62e-22 | -3.83e-01 | 0.1559 |
| 9218 | VAPA | brca1 | Human | Breast | Precancer | 4.59e-13 | 3.33e-01 | -0.0338 |
| 9218 | VAPA | brca2 | Human | Breast | Precancer | 1.17e-11 | 2.82e-01 | -0.024 |
| 9218 | VAPA | brca3 | Human | Breast | Precancer | 4.09e-12 | 3.45e-01 | -0.0263 |
| 9218 | VAPA | M1 | Human | Breast | IDC | 1.95e-05 | -4.29e-01 | 0.1577 |
| 9218 | VAPA | NCCBC14 | Human | Breast | DCIS | 2.88e-20 | -2.48e-01 | 0.2021 |
| 9218 | VAPA | NCCBC2 | Human | Breast | DCIS | 1.50e-05 | -2.53e-01 | 0.1554 |
| Page: 1 2 3 4 5 6 7 8 9 10 11 12 |
| Tissue | Expression Dynamics | Abbreviation |
| Breast | 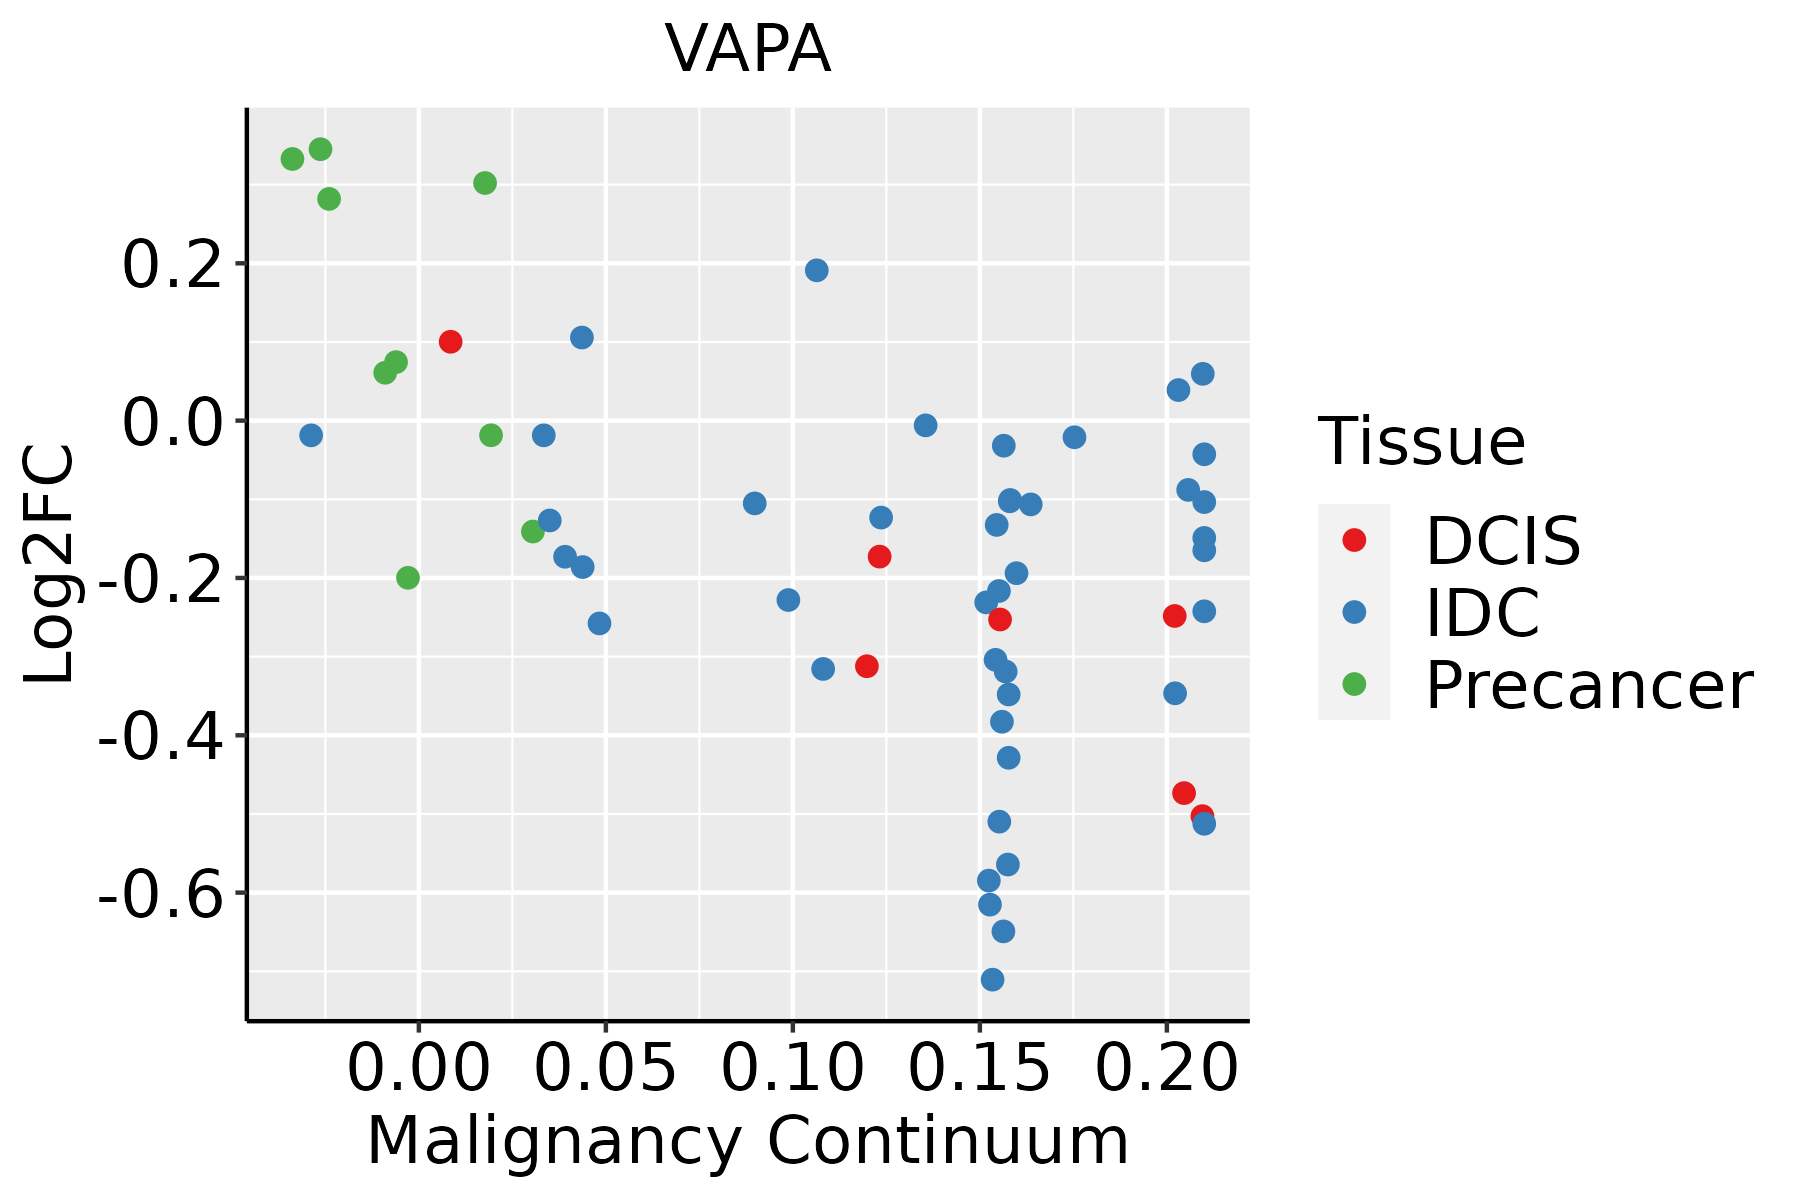 | IDC: Invasive ductal carcinoma |
| DCIS: Ductal carcinoma in situ | ||
| Precancer(BRCA1-mut): Precancerous lesion from BRCA1 mutation carriers | ||
| Endometrium | 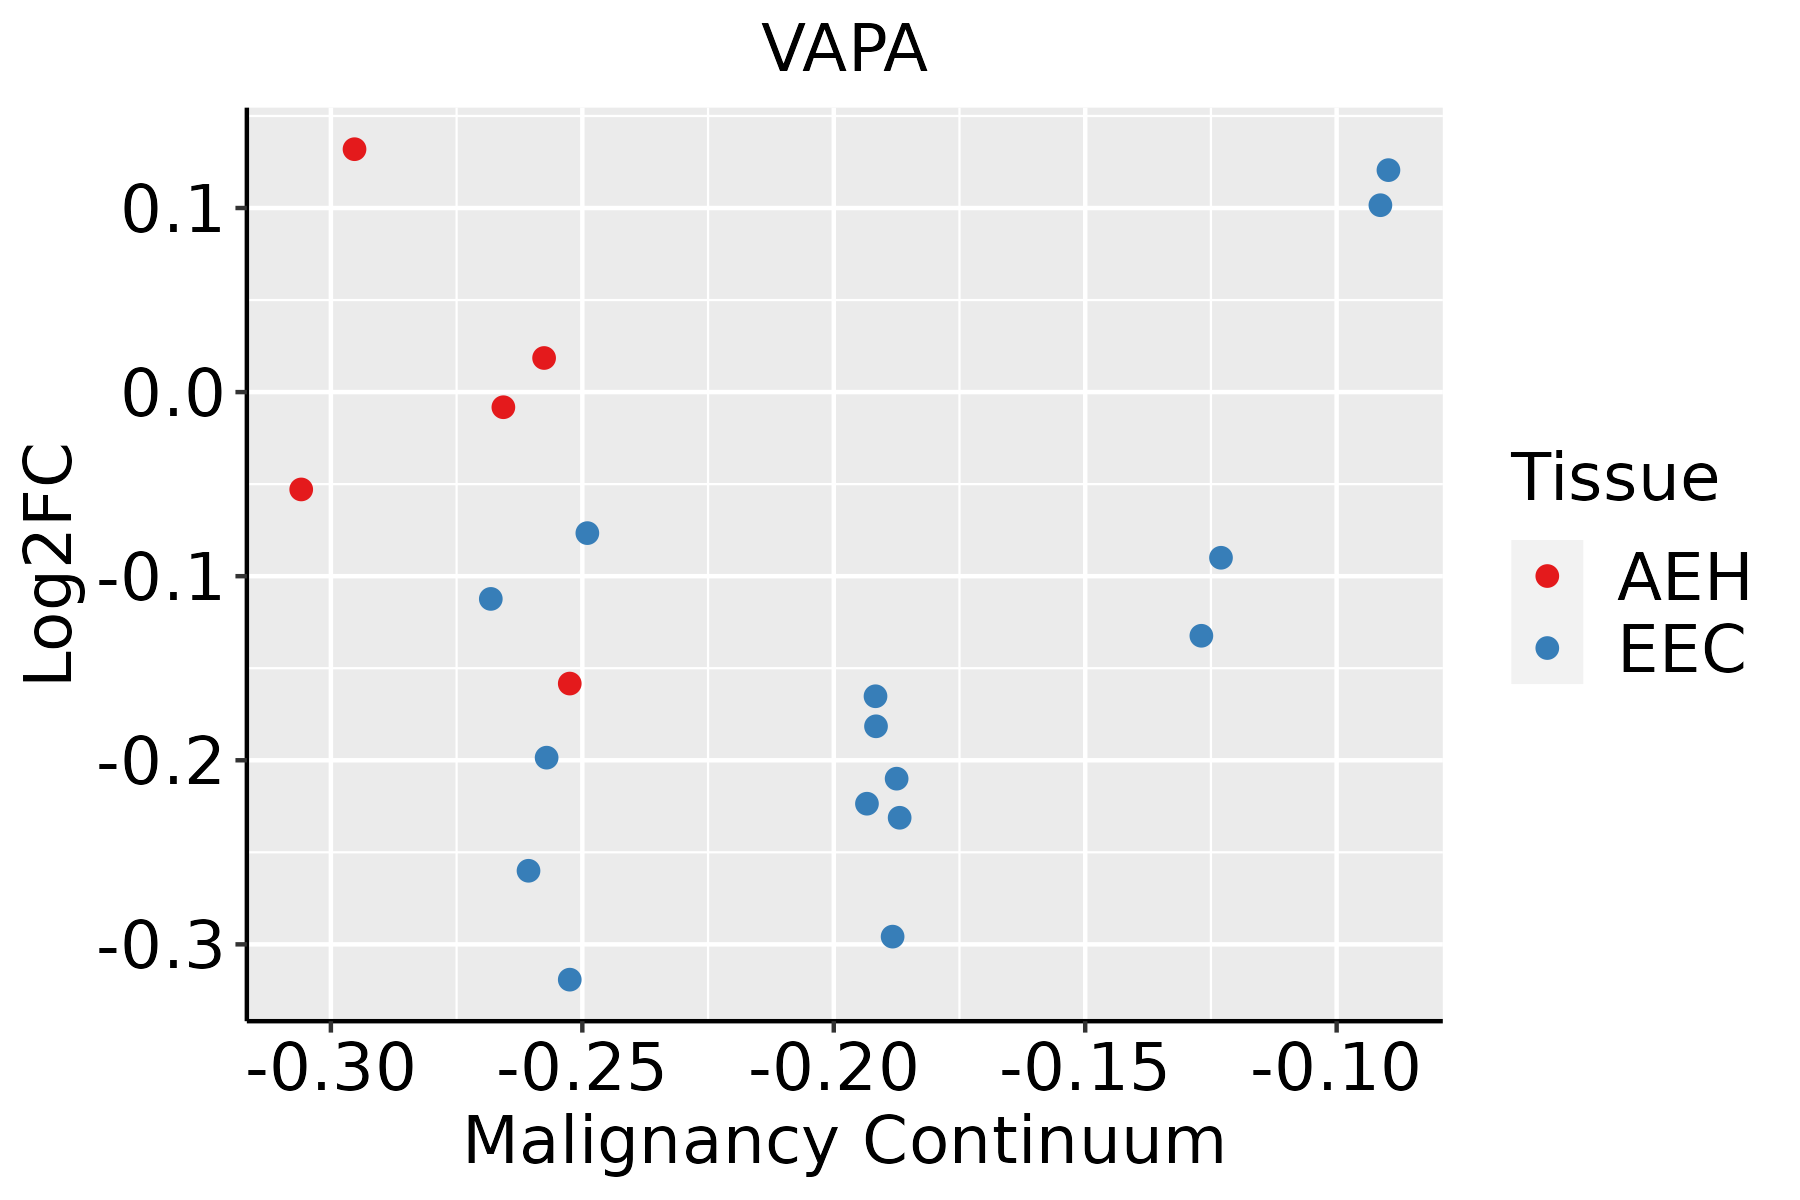 | AEH: Atypical endometrial hyperplasia |
| EEC: Endometrioid Cancer | ||
| Esophagus | 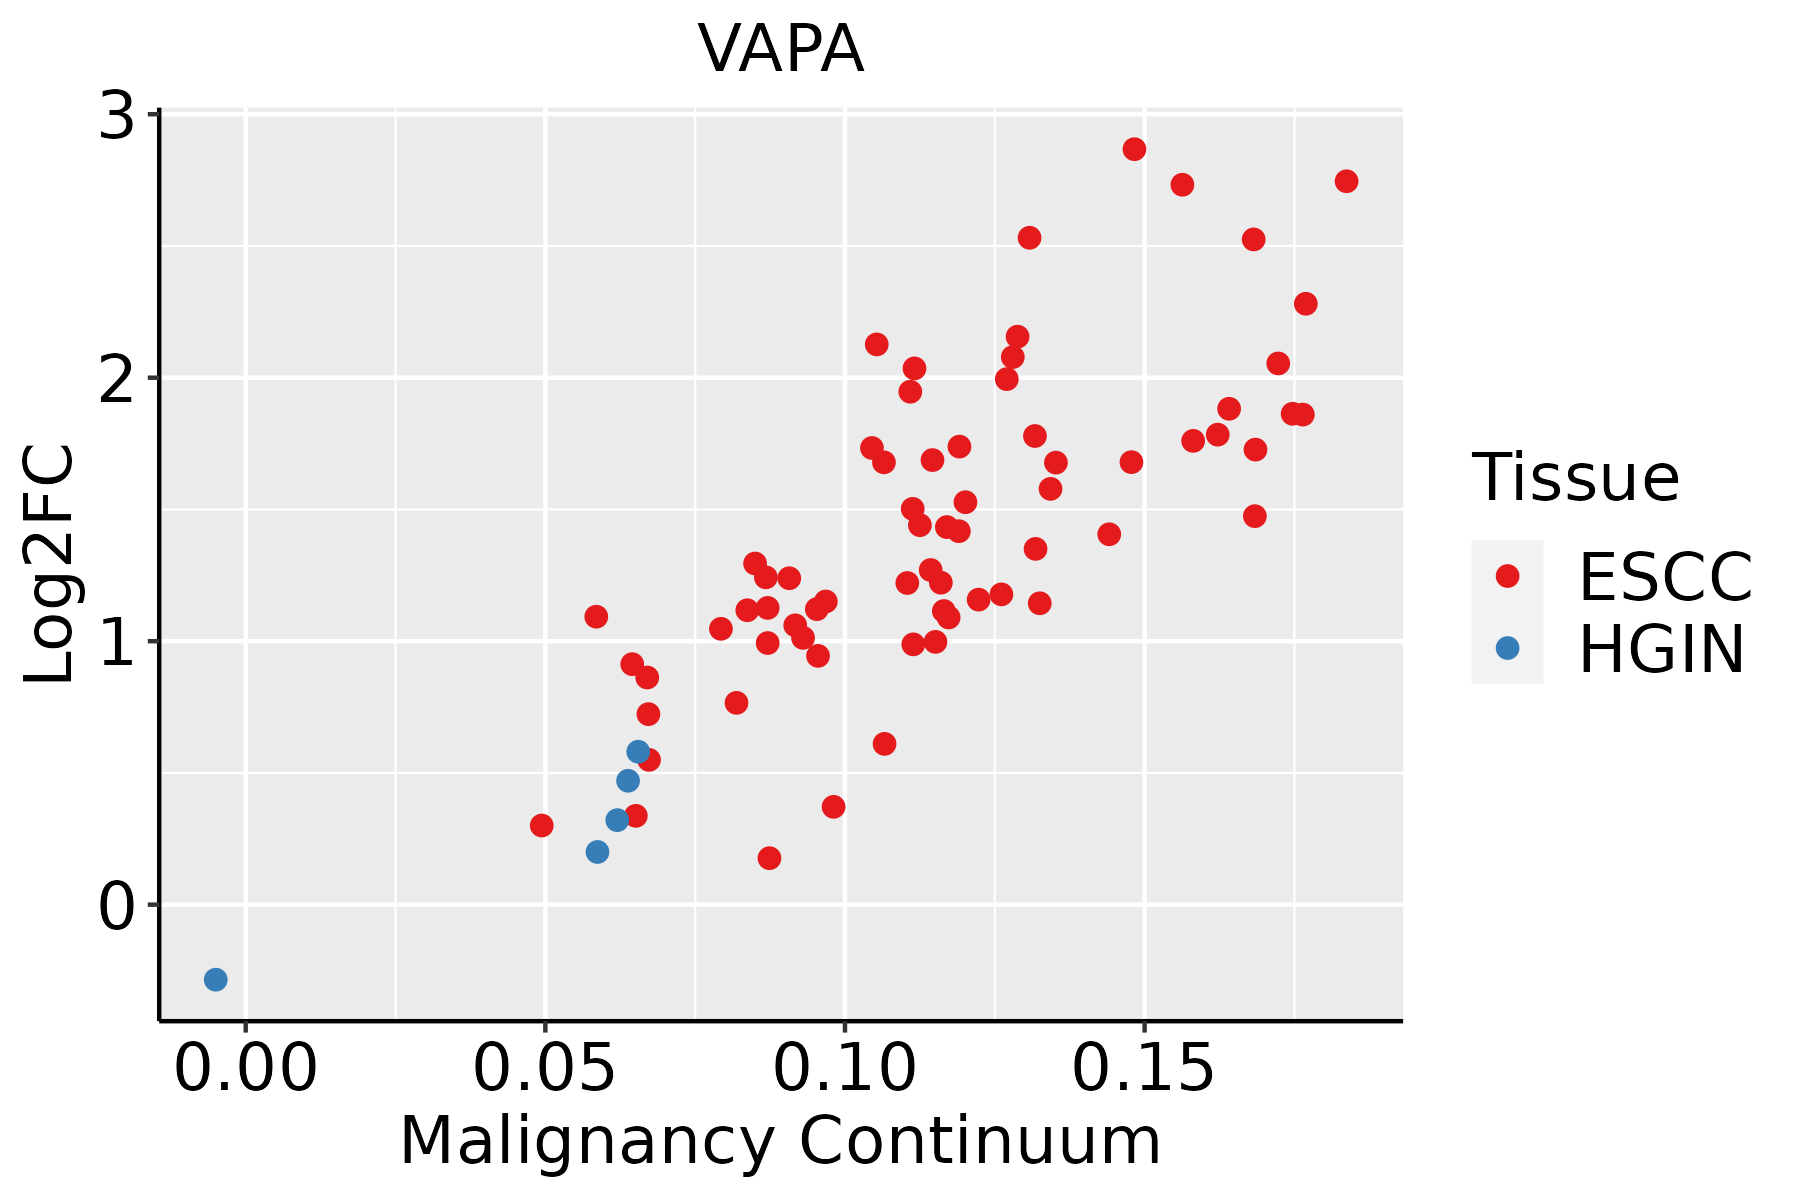 | ESCC: Esophageal squamous cell carcinoma |
| HGIN: High-grade intraepithelial neoplasias | ||
| LGIN: Low-grade intraepithelial neoplasias | ||
| Liver | 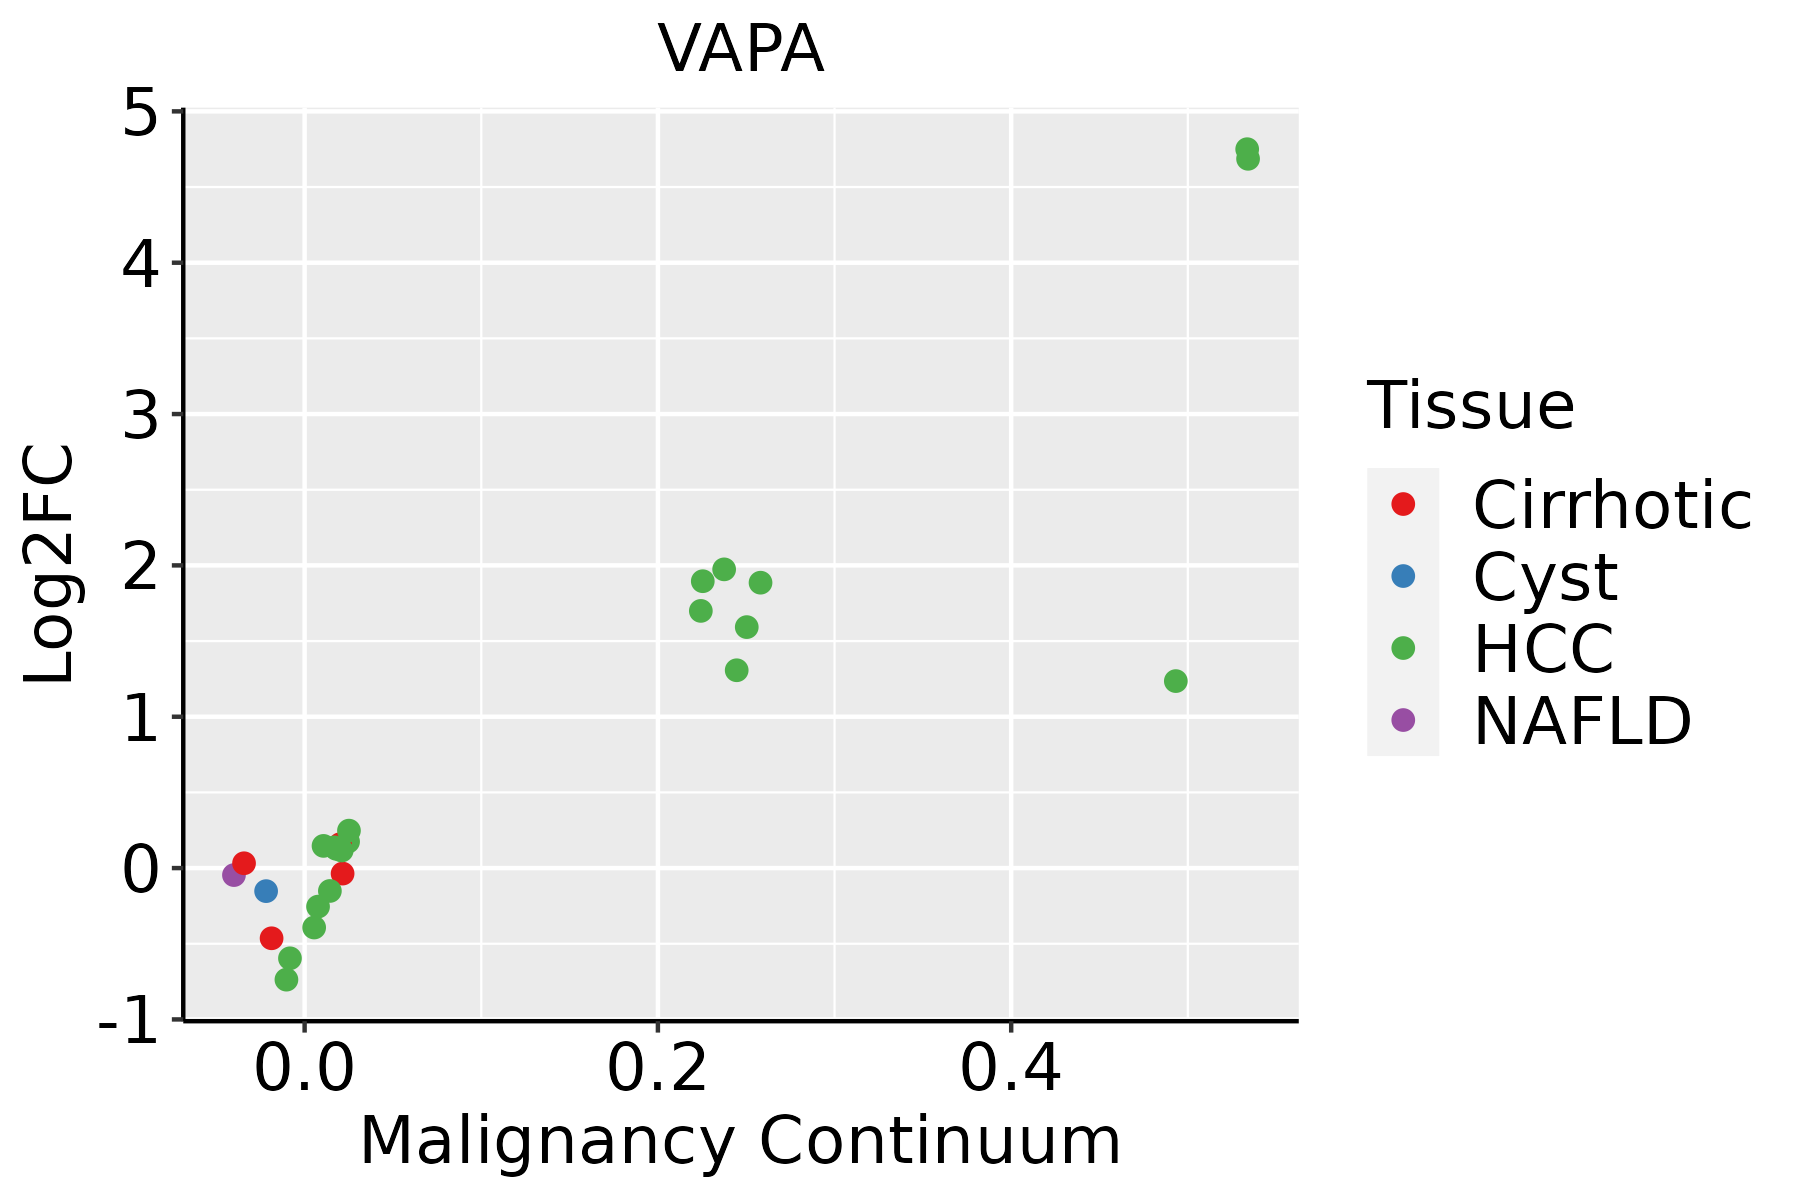 | HCC: Hepatocellular carcinoma |
| NAFLD: Non-alcoholic fatty liver disease | ||
| Lung | 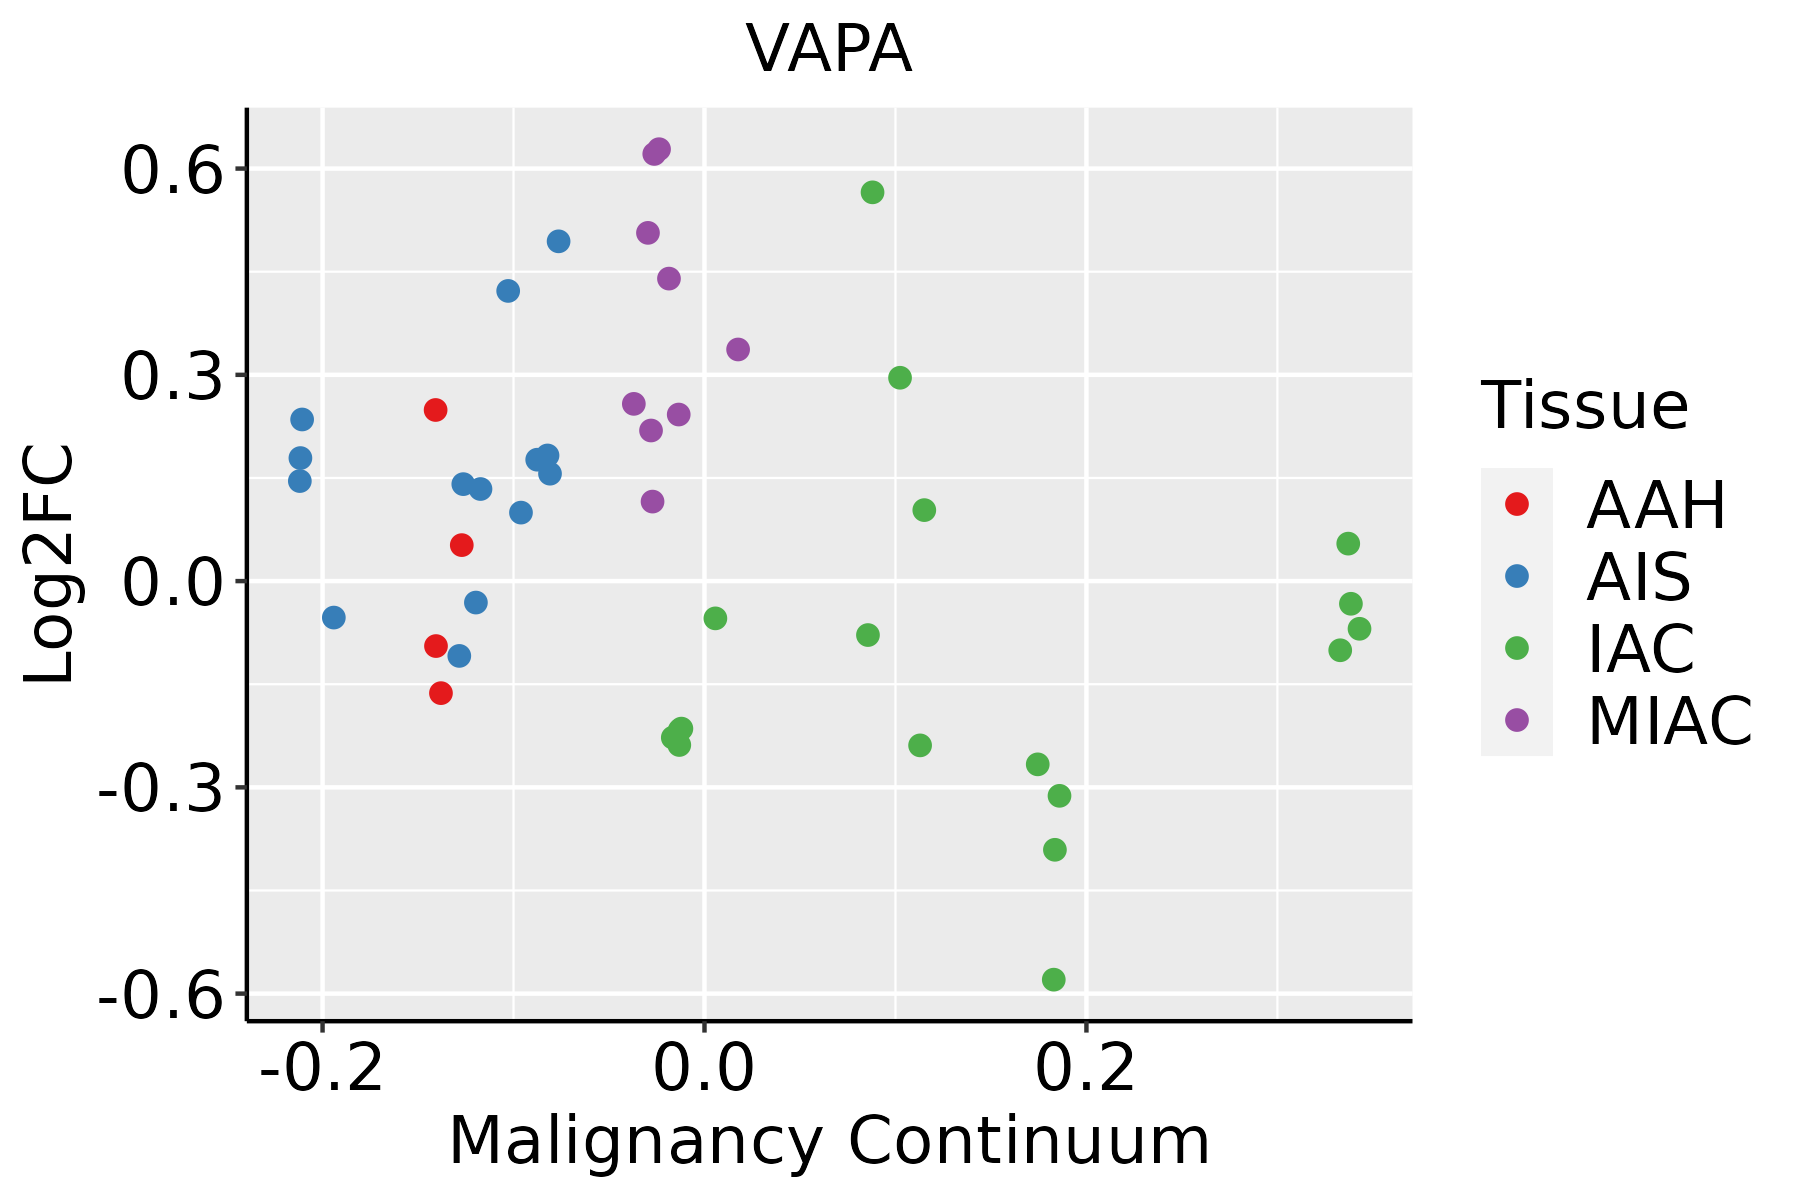 | AAH: Atypical adenomatous hyperplasia |
| AIS: Adenocarcinoma in situ | ||
| IAC: Invasive lung adenocarcinoma | ||
| MIA: Minimally invasive adenocarcinoma | ||
| Oral Cavity | 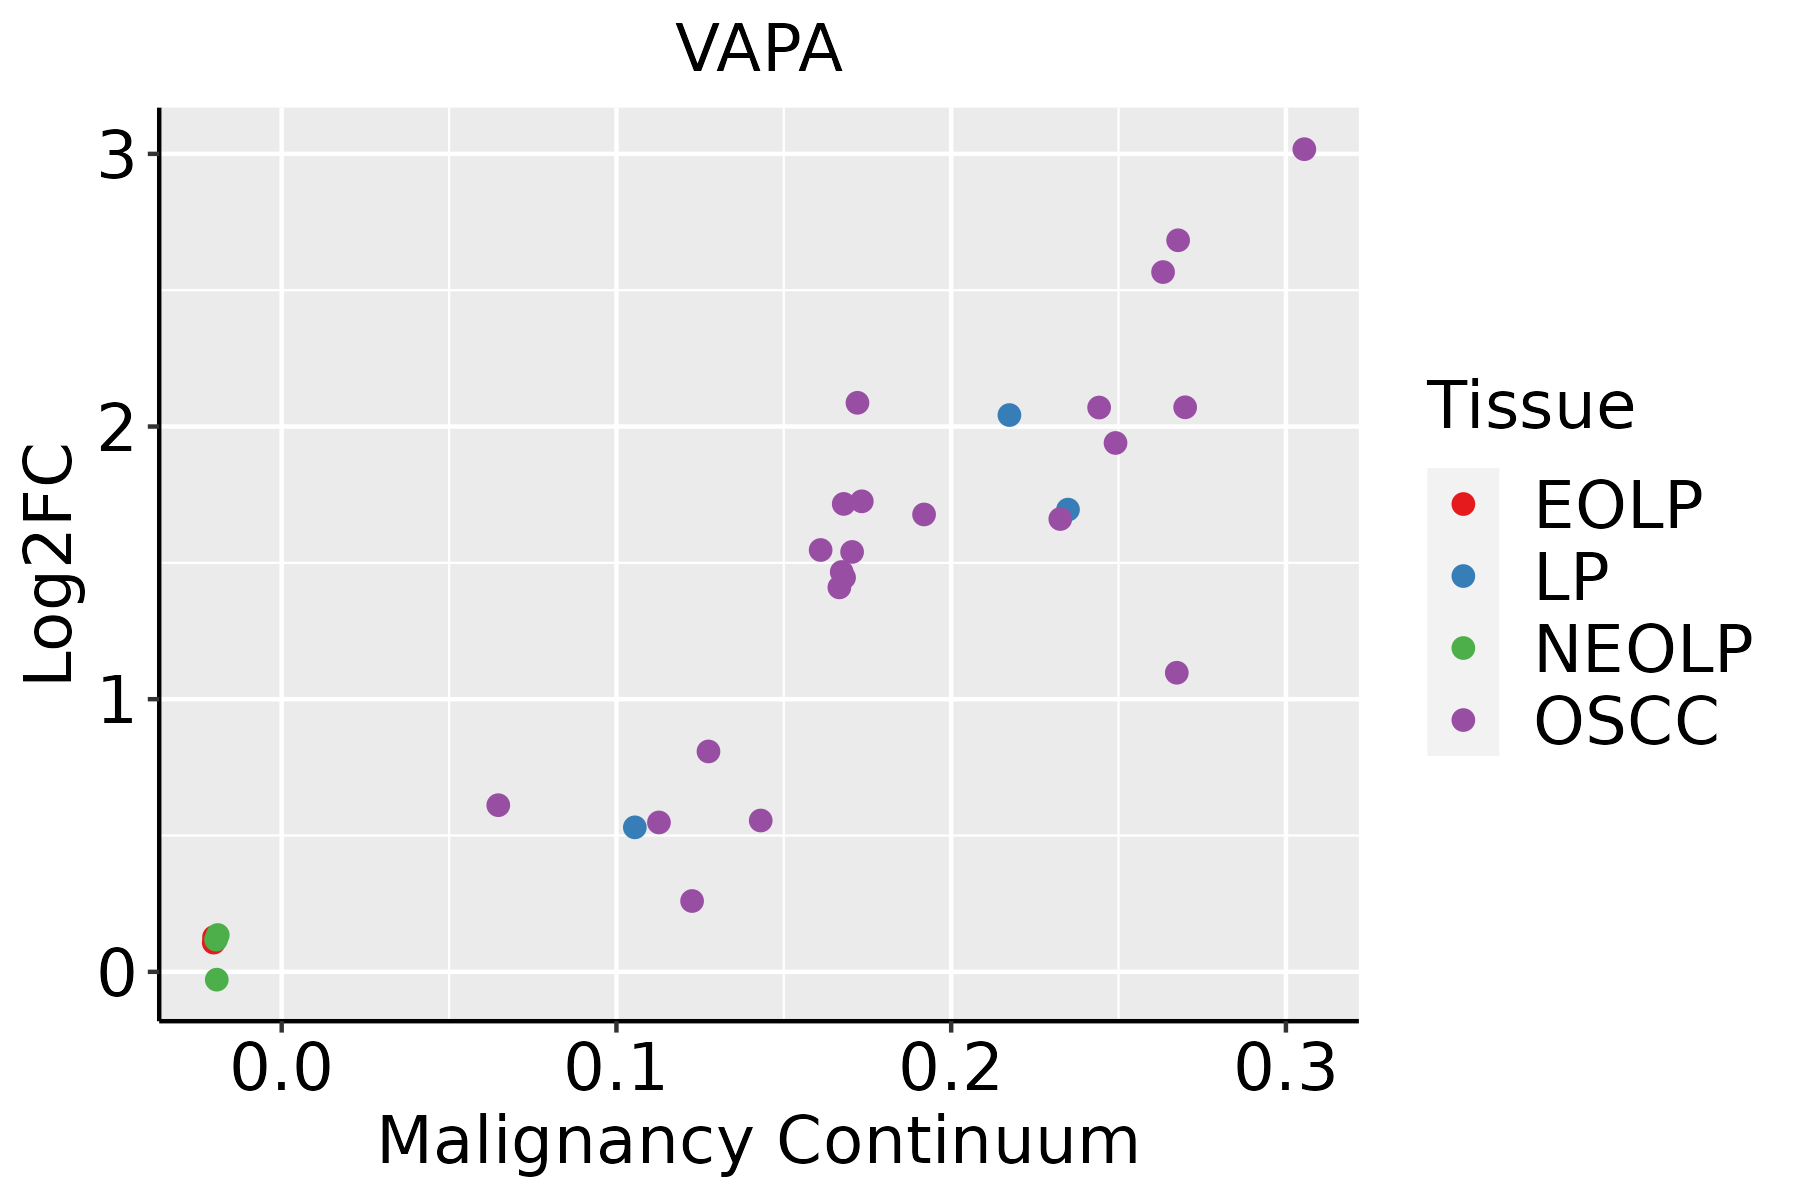 | EOLP: Erosive Oral lichen planus |
| LP: leukoplakia | ||
| NEOLP: Non-erosive oral lichen planus | ||
| OSCC: Oral squamous cell carcinoma | ||
| Prostate | 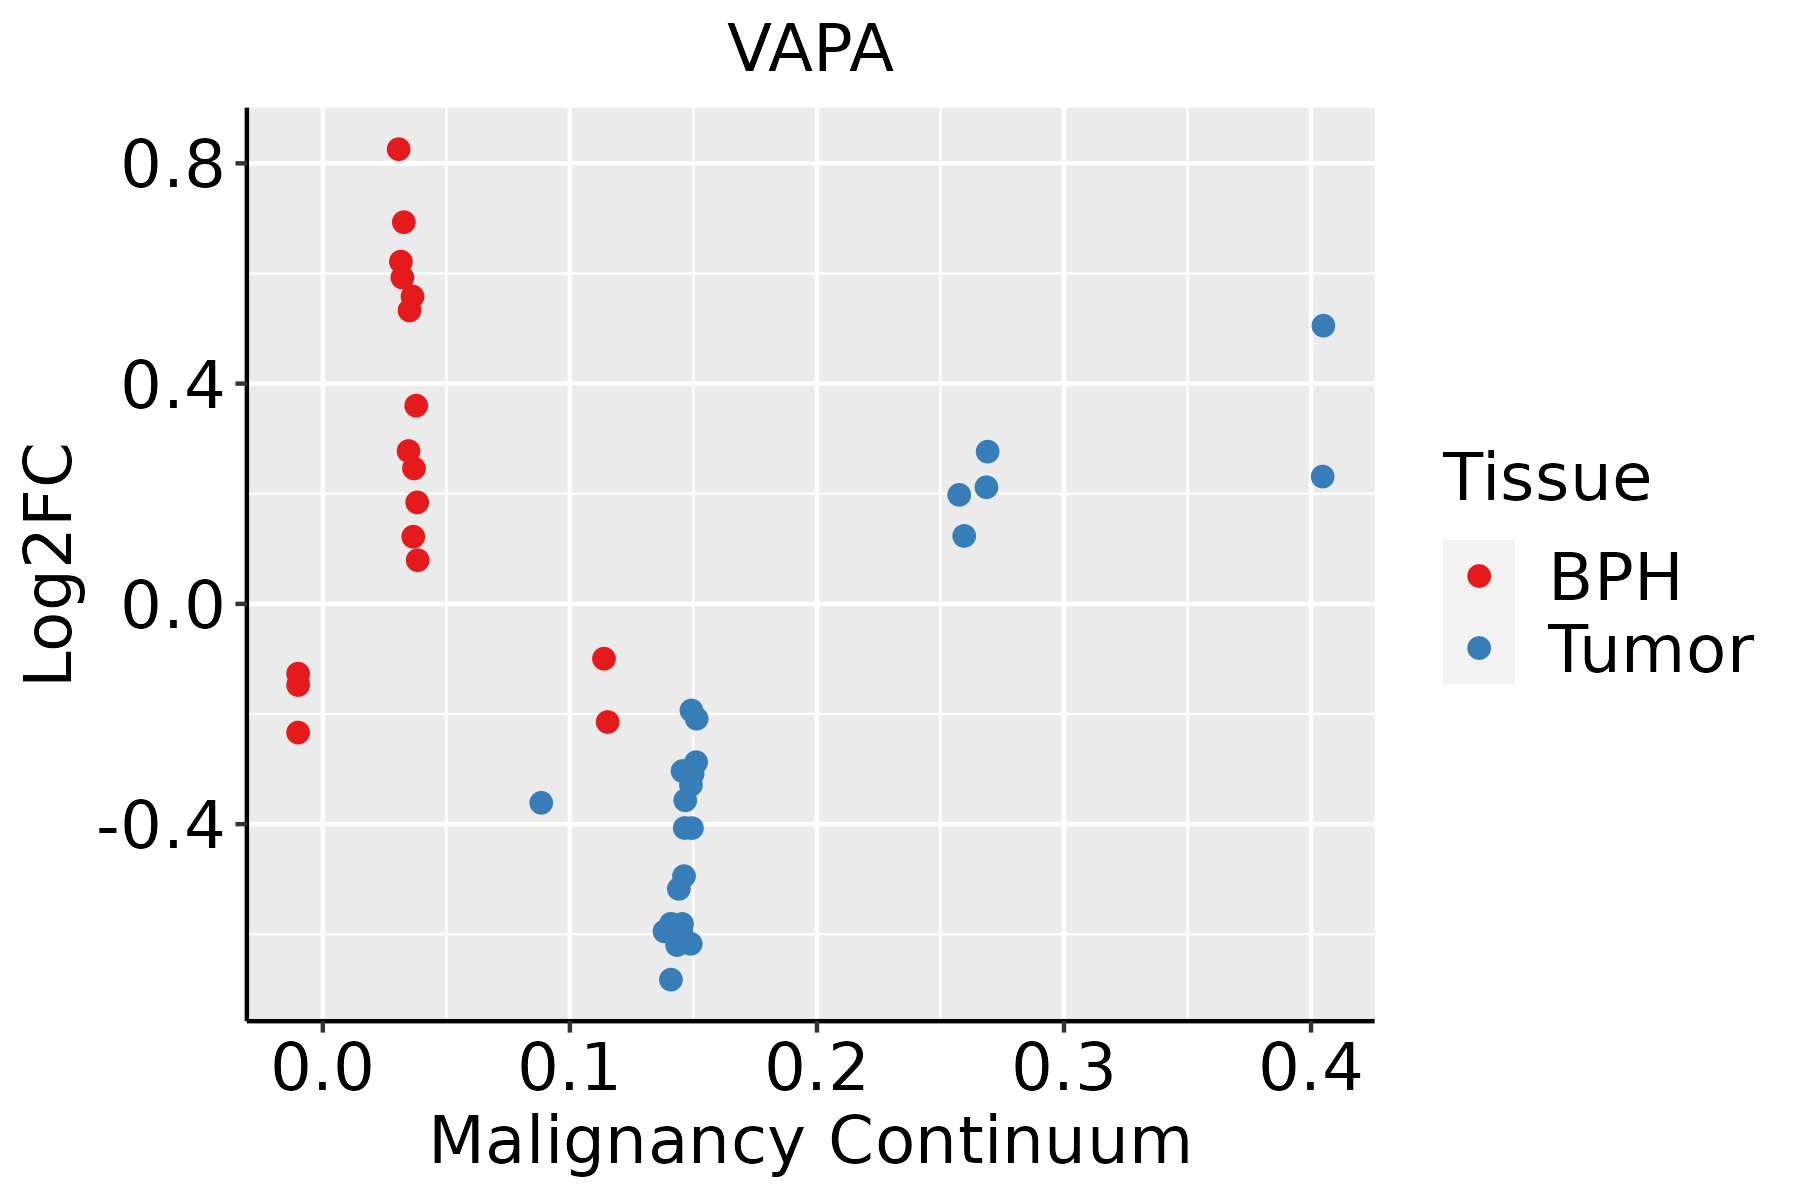 | BPH: Benign Prostatic Hyperplasia |
| Skin |  | AK: Actinic keratosis |
| cSCC: Cutaneous squamous cell carcinoma | ||
| SCCIS:squamous cell carcinoma in situ | ||
| Thyroid | 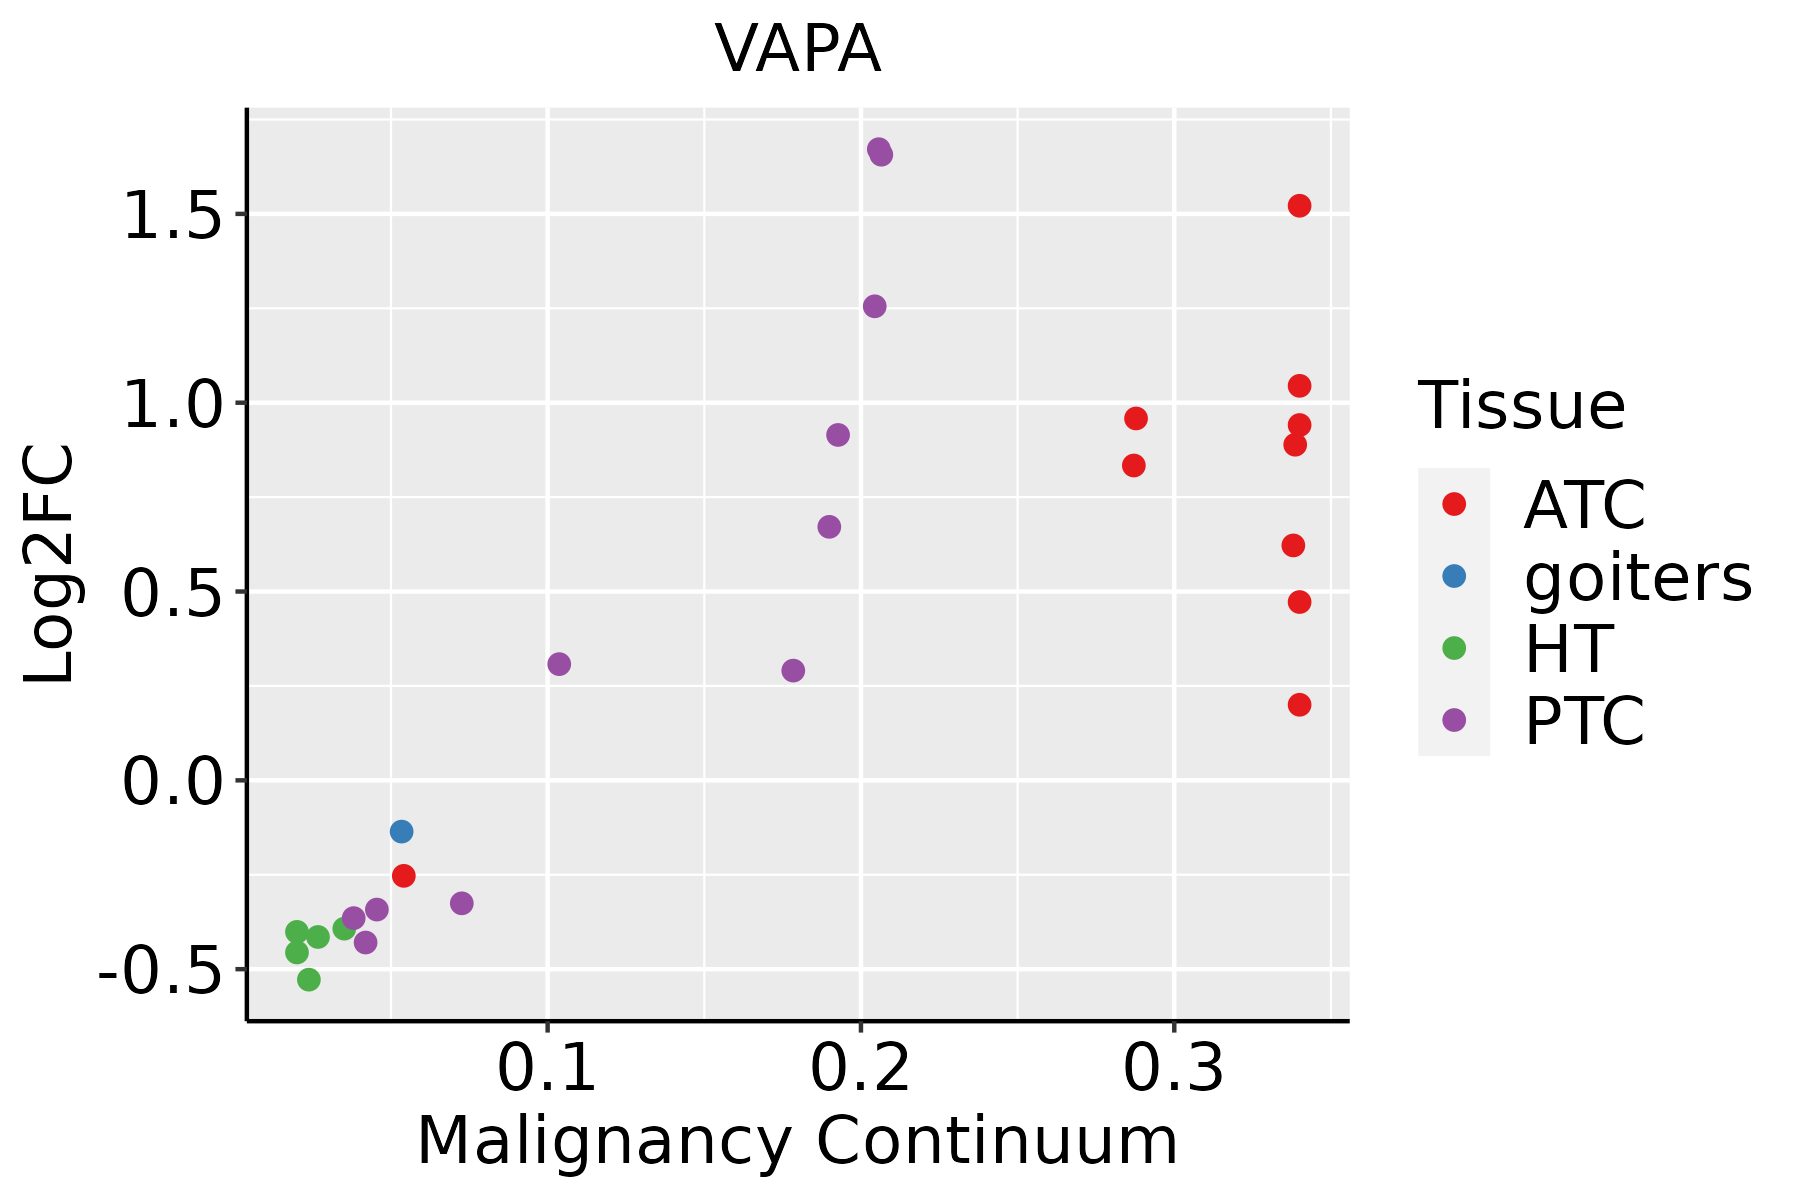 | ATC: Anaplastic thyroid cancer |
| HT: Hashimoto's thyroiditis | ||
| PTC: Papillary thyroid cancer |
| ∗log2FC in expression of this searched gene in stem-like cells from each diseased tissue sample relative to stem-like cells in normal samples in each tissue plotted against the malignancy continuum. Samples are colored based on if they are from different disease stage. |
Top |
Malignant transformation related pathway analysis |
| Find out the enriched GO biological processes and KEGG pathways involved in transition from healthy to precancer to cancer |
| Tissue | Disease Stage | Enriched GO biological Processes |
| Colorectum | AD |  |
| Colorectum | SER |  |
| Colorectum | MSS |  |
| Colorectum | MSI-H |  |
| Colorectum | FAP |  |
| ∗Top 15 enriched GO BP terms are showed in the bar plot of each disease state in each tissue. Each row represents a significant GO biological process which is colored according to the -log10(p.adjust). |
| Page: 1 2 3 4 5 6 7 8 9 |
| GO ID | Tissue | Disease Stage | Description | Gene Ratio | Bg Ratio | pvalue | p.adjust | Count |
| GO:00160329 | Breast | Precancer | viral process | 58/1080 | 415/18723 | 3.42e-10 | 3.16e-08 | 58 |
| GO:00190589 | Breast | Precancer | viral life cycle | 47/1080 | 317/18723 | 2.42e-09 | 1.99e-07 | 47 |
| GO:00444039 | Breast | Precancer | biological process involved in symbiotic interaction | 42/1080 | 290/18723 | 3.40e-08 | 2.11e-06 | 42 |
| GO:00521269 | Breast | Precancer | movement in host environment | 29/1080 | 175/18723 | 2.59e-07 | 1.28e-05 | 29 |
| GO:00517019 | Breast | Precancer | biological process involved in interaction with host | 31/1080 | 203/18723 | 6.52e-07 | 2.71e-05 | 31 |
| GO:00507929 | Breast | Precancer | regulation of viral process | 27/1080 | 164/18723 | 7.59e-07 | 3.05e-05 | 27 |
| GO:00190799 | Breast | Precancer | viral genome replication | 22/1080 | 131/18723 | 5.63e-06 | 1.66e-04 | 22 |
| GO:00439039 | Breast | Precancer | regulation of biological process involved in symbiotic interaction | 15/1080 | 72/18723 | 1.23e-05 | 3.17e-04 | 15 |
| GO:19039009 | Breast | Precancer | regulation of viral life cycle | 23/1080 | 148/18723 | 1.31e-05 | 3.30e-04 | 23 |
| GO:00709725 | Breast | Precancer | protein localization to endoplasmic reticulum | 15/1080 | 74/18723 | 1.74e-05 | 4.17e-04 | 15 |
| GO:00069009 | Breast | Precancer | vesicle budding from membrane | 12/1080 | 61/18723 | 1.61e-04 | 2.69e-03 | 12 |
| GO:00485249 | Breast | Precancer | positive regulation of viral process | 12/1080 | 65/18723 | 3.00e-04 | 4.34e-03 | 12 |
| GO:19039026 | Breast | Precancer | positive regulation of viral life cycle | 6/1080 | 29/18723 | 5.49e-03 | 4.01e-02 | 6 |
| GO:00072496 | Breast | Precancer | I-kappaB kinase/NF-kappaB signaling | 27/1080 | 281/18723 | 6.58e-03 | 4.53e-02 | 27 |
| GO:001603214 | Breast | IDC | viral process | 75/1434 | 415/18723 | 1.98e-12 | 4.02e-10 | 75 |
| GO:001905814 | Breast | IDC | viral life cycle | 61/1434 | 317/18723 | 1.61e-11 | 2.77e-09 | 61 |
| GO:001907914 | Breast | IDC | viral genome replication | 32/1434 | 131/18723 | 2.82e-09 | 2.46e-07 | 32 |
| GO:004440314 | Breast | IDC | biological process involved in symbiotic interaction | 52/1434 | 290/18723 | 6.55e-09 | 5.03e-07 | 52 |
| GO:005079214 | Breast | IDC | regulation of viral process | 36/1434 | 164/18723 | 6.55e-09 | 5.03e-07 | 36 |
| GO:190390014 | Breast | IDC | regulation of viral life cycle | 30/1434 | 148/18723 | 7.25e-07 | 3.35e-05 | 30 |
| Page: 1 2 3 4 5 6 7 8 9 10 11 12 13 14 15 16 17 18 19 20 21 22 23 24 25 26 27 28 |
| Pathway ID | Tissue | Disease Stage | Description | Gene Ratio | Bg Ratio | pvalue | p.adjust | qvalue | Count |
| hsa049792 | Liver | Cirrhotic | Cholesterol metabolism | 30/2530 | 51/8465 | 1.59e-05 | 1.39e-04 | 8.60e-05 | 30 |
| hsa049793 | Liver | Cirrhotic | Cholesterol metabolism | 30/2530 | 51/8465 | 1.59e-05 | 1.39e-04 | 8.60e-05 | 30 |
| hsa049794 | Liver | HCC | Cholesterol metabolism | 41/4020 | 51/8465 | 1.33e-06 | 1.35e-05 | 7.49e-06 | 41 |
| hsa049795 | Liver | HCC | Cholesterol metabolism | 41/4020 | 51/8465 | 1.33e-06 | 1.35e-05 | 7.49e-06 | 41 |
| Page: 1 |
Top |
Cell-cell communication analysis |
| Identification of potential cell-cell interactions between two cell types and their ligand-receptor pairs for different disease states |
| Ligand | Receptor | LRpair | Pathway | Tissue | Disease Stage |
| Page: 1 |
Top |
Single-cell gene regulatory network inference analysis |
| Find out the significant the regulons (TFs) and the target genes of each regulon across cell types for different disease states |
| TF | Cell Type | Tissue | Disease Stage | Target Gene | RSS | Regulon Activity |
| ∗The dot plots of a searched regulon are shown for all cell subpopulations in each disease state of each tissue based on the regulon specific score inferred using pySCENIC and by calculating the average expression. |
| Page: 1 |
Top |
Somatic mutation of malignant transformation related genes |
| Annotation of somatic variants for genes involved in malignant transformation |
| Hugo Symbol | Variant Class | Variant Classification | dbSNP RS | HGVSc | HGVSp | HGVSp Short | SWISSPROT | BIOTYPE | SIFT | PolyPhen | Tumor Sample Barcode | Tissue | Histology | Sex | Age | Stage | Therapy Types | Drugs | Outcome |
| VAPA | SNV | Missense_Mutation | rs376344309 | c.782N>T | p.Ser261Leu | p.S261L | Q9P0L0 | protein_coding | tolerated(0.22) | benign(0.306) | TCGA-C8-A26Y-01 | Breast | breast invasive carcinoma | Female | >=65 | I/II | Unknown | Unknown | SD |
| VAPA | SNV | Missense_Mutation | c.757C>G | p.His253Asp | p.H253D | Q9P0L0 | protein_coding | tolerated(0.41) | possibly_damaging(0.6) | TCGA-GM-A2DB-01 | Breast | breast invasive carcinoma | Female | <65 | I/II | Chemotherapy | taxol | CR | |
| VAPA | SNV | Missense_Mutation | rs773854854 | c.743T>C | p.Leu248Pro | p.L248P | Q9P0L0 | protein_coding | deleterious(0.02) | probably_damaging(0.988) | TCGA-A6-A565-01 | Colorectum | colon adenocarcinoma | Female | <65 | III/IV | Unspecific | 5FU | PD |
| VAPA | SNV | Missense_Mutation | c.128N>T | p.Ser43Leu | p.S43L | Q9P0L0 | protein_coding | deleterious(0.04) | probably_damaging(0.968) | TCGA-AA-3510-01 | Colorectum | colon adenocarcinoma | Male | >=65 | I/II | Unknown | Unknown | SD | |
| VAPA | SNV | Missense_Mutation | novel | c.194N>A | p.Ser65Asn | p.S65N | Q9P0L0 | protein_coding | deleterious(0) | probably_damaging(0.979) | TCGA-AA-3950-01 | Colorectum | colon adenocarcinoma | Female | >=65 | I/II | Unknown | Unknown | SD |
| VAPA | deletion | Frame_Shift_Del | c.348delN | p.Lys117AsnfsTer5 | p.K117Nfs*5 | Q9P0L0 | protein_coding | TCGA-G4-6588-01 | Colorectum | colon adenocarcinoma | Female | <65 | I/II | Unknown | Unknown | SD | |||
| VAPA | SNV | Missense_Mutation | c.763N>A | p.Asp255Asn | p.D255N | Q9P0L0 | protein_coding | tolerated(0.29) | possibly_damaging(0.526) | TCGA-A5-A1OF-01 | Endometrium | uterine corpus endometrioid carcinoma | Female | <65 | I/II | Unknown | Unknown | SD | |
| VAPA | SNV | Missense_Mutation | novel | c.248T>C | p.Phe83Ser | p.F83S | Q9P0L0 | protein_coding | deleterious(0) | probably_damaging(0.999) | TCGA-AJ-A2QO-01 | Endometrium | uterine corpus endometrioid carcinoma | Female | >=65 | I/II | Unknown | Unknown | SD |
| VAPA | SNV | Missense_Mutation | novel | c.461G>A | p.Ser154Asn | p.S154N | Q9P0L0 | protein_coding | tolerated(0.44) | benign(0.003) | TCGA-AJ-A3EL-01 | Endometrium | uterine corpus endometrioid carcinoma | Female | <65 | I/II | Unknown | Unknown | SD |
| VAPA | SNV | Missense_Mutation | rs773084616 | c.560N>C | p.Met187Thr | p.M187T | Q9P0L0 | protein_coding | deleterious(0.04) | benign(0.046) | TCGA-B5-A0JT-01 | Endometrium | uterine corpus endometrioid carcinoma | Female | <65 | III/IV | Hormone Therapy | megace | SD |
| Page: 1 2 3 |
Top |
Related drugs of malignant transformation related genes |
| Identification of chemicals and drugs interact with genes involved in malignant transfromation |
| (DGIdb 4.0) |
| Entrez ID | Symbol | Category | Interaction Types | Drug Claim Name | Drug Name | PMIDs |
| Page: 1 |

Copyright 2023-Present -The University of Texas Health Science Center at Houston |