
|
|||||
|
 | |
| |
| |
| |
| |
| |
|
Gene: VANGL1 |
Gene summary for VANGL1 |
| Gene information | Species | Human | Gene symbol | VANGL1 | Gene ID | 81839 |
| Gene name | VANGL planar cell polarity protein 1 | |
| Gene Alias | KITENIN | |
| Cytomap | 1p13.1 | |
| Gene Type | protein-coding | GO ID | GO:0001736 | UniProtAcc | Q8TAA9 |
Top |
Malignant transformation analysis |
| Identification of the aberrant gene expression in precancerous and cancerous lesions by comparing the gene expression of stem-like cells in diseased tissues with normal stem cells |
| Entrez ID | Symbol | Replicates | Species | Organ | Tissue | Adj P-value | Log2FC | Malignancy |
| 81839 | VANGL1 | LZE4T | Human | Esophagus | ESCC | 4.05e-11 | 2.96e-01 | 0.0811 |
| 81839 | VANGL1 | LZE7T | Human | Esophagus | ESCC | 1.86e-03 | 1.91e-01 | 0.0667 |
| 81839 | VANGL1 | LZE24T | Human | Esophagus | ESCC | 7.38e-12 | 7.42e-02 | 0.0596 |
| 81839 | VANGL1 | P1T-E | Human | Esophagus | ESCC | 2.16e-04 | 2.02e-01 | 0.0875 |
| 81839 | VANGL1 | P2T-E | Human | Esophagus | ESCC | 1.13e-32 | 6.15e-01 | 0.1177 |
| 81839 | VANGL1 | P4T-E | Human | Esophagus | ESCC | 2.38e-11 | 2.76e-01 | 0.1323 |
| 81839 | VANGL1 | P5T-E | Human | Esophagus | ESCC | 1.73e-14 | 2.09e-01 | 0.1327 |
| 81839 | VANGL1 | P8T-E | Human | Esophagus | ESCC | 4.42e-18 | 2.88e-01 | 0.0889 |
| 81839 | VANGL1 | P9T-E | Human | Esophagus | ESCC | 5.84e-11 | 1.59e-01 | 0.1131 |
| 81839 | VANGL1 | P10T-E | Human | Esophagus | ESCC | 7.11e-25 | 4.14e-01 | 0.116 |
| 81839 | VANGL1 | P11T-E | Human | Esophagus | ESCC | 3.19e-11 | 4.27e-01 | 0.1426 |
| 81839 | VANGL1 | P12T-E | Human | Esophagus | ESCC | 1.89e-14 | 2.93e-01 | 0.1122 |
| 81839 | VANGL1 | P15T-E | Human | Esophagus | ESCC | 7.43e-10 | 8.23e-02 | 0.1149 |
| 81839 | VANGL1 | P16T-E | Human | Esophagus | ESCC | 4.88e-12 | 9.80e-02 | 0.1153 |
| 81839 | VANGL1 | P17T-E | Human | Esophagus | ESCC | 5.30e-06 | 1.47e-01 | 0.1278 |
| 81839 | VANGL1 | P19T-E | Human | Esophagus | ESCC | 1.94e-04 | 2.39e-01 | 0.1662 |
| 81839 | VANGL1 | P20T-E | Human | Esophagus | ESCC | 9.63e-17 | 2.99e-01 | 0.1124 |
| 81839 | VANGL1 | P21T-E | Human | Esophagus | ESCC | 2.14e-40 | 8.24e-01 | 0.1617 |
| 81839 | VANGL1 | P22T-E | Human | Esophagus | ESCC | 1.11e-23 | 2.01e-01 | 0.1236 |
| 81839 | VANGL1 | P23T-E | Human | Esophagus | ESCC | 2.30e-23 | 5.71e-01 | 0.108 |
| Page: 1 2 3 4 |
| Tissue | Expression Dynamics | Abbreviation |
| Esophagus | 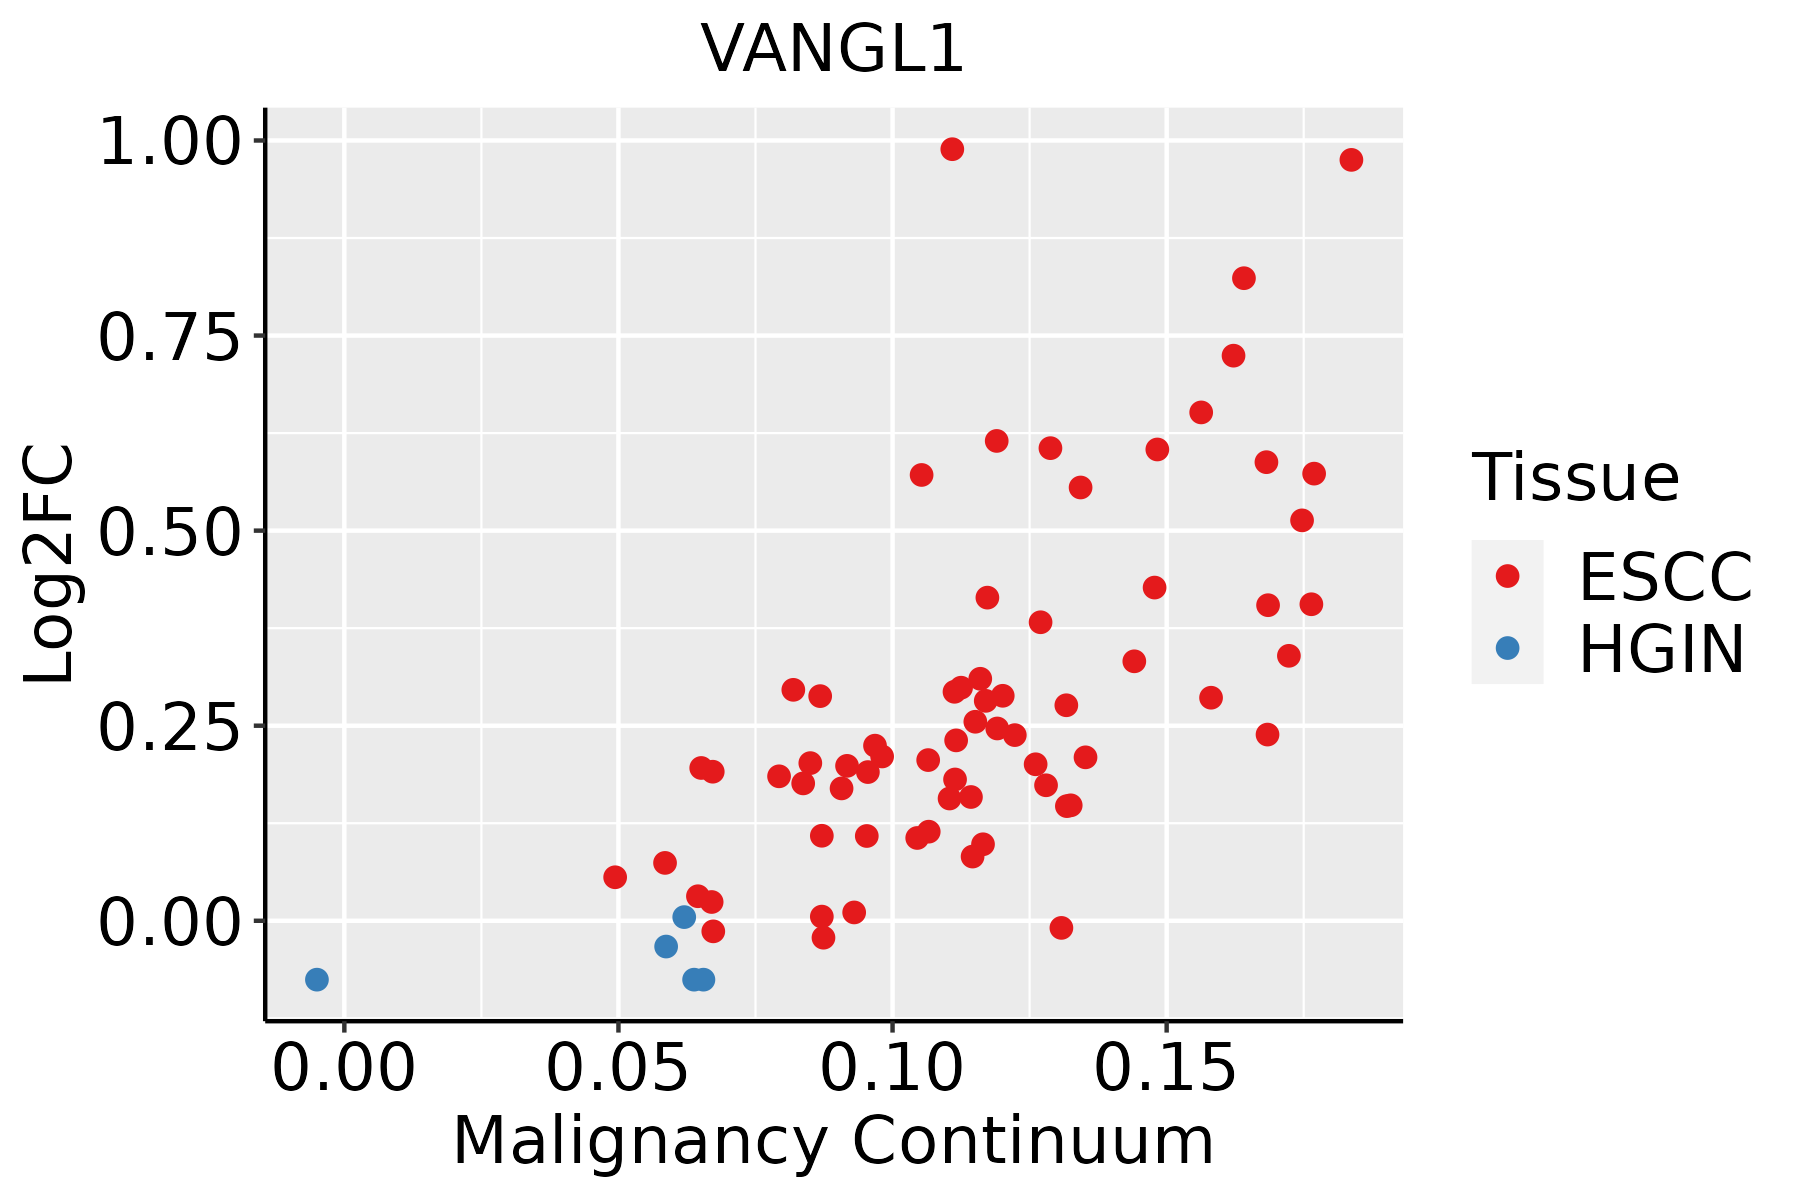 | ESCC: Esophageal squamous cell carcinoma |
| HGIN: High-grade intraepithelial neoplasias | ||
| LGIN: Low-grade intraepithelial neoplasias | ||
| Skin | 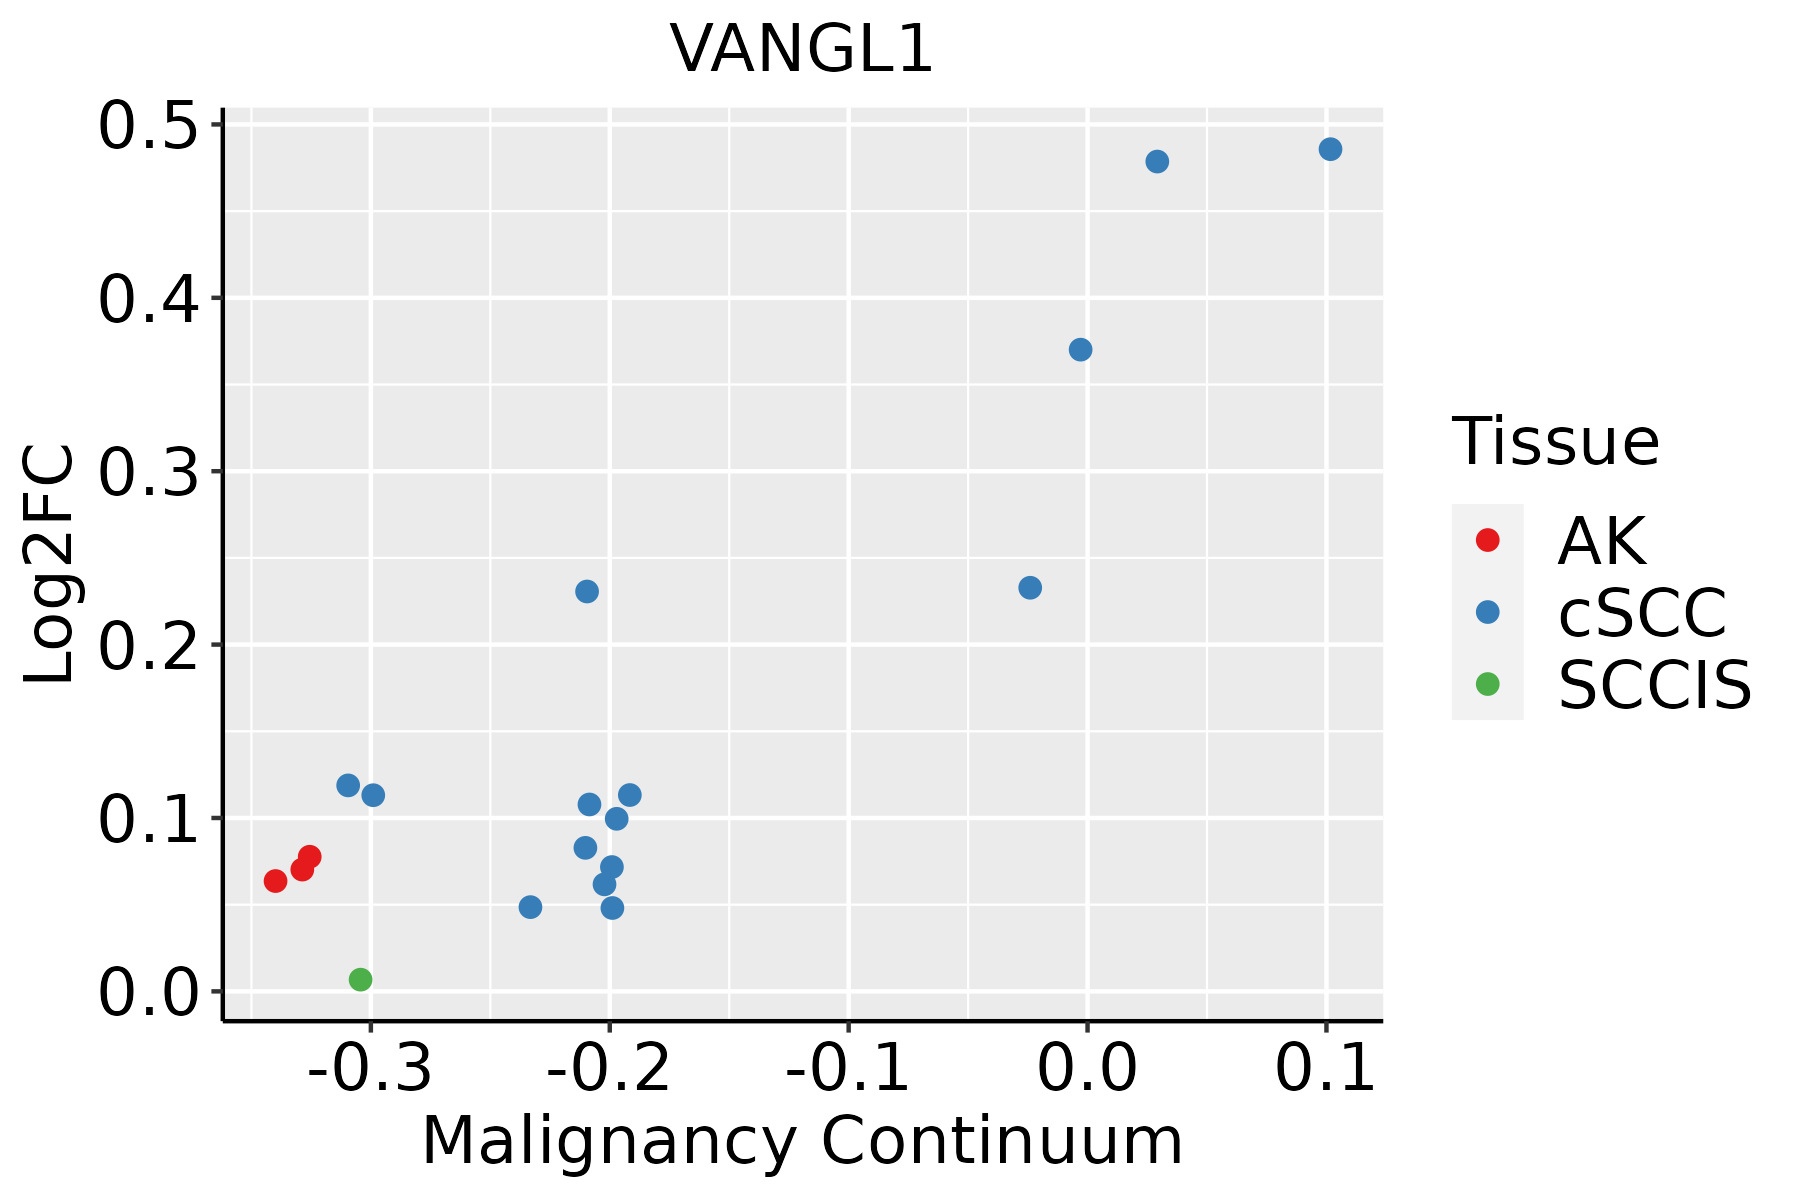 | AK: Actinic keratosis |
| cSCC: Cutaneous squamous cell carcinoma | ||
| SCCIS:squamous cell carcinoma in situ |
| ∗log2FC in expression of this searched gene in stem-like cells from each diseased tissue sample relative to stem-like cells in normal samples in each tissue plotted against the malignancy continuum. Samples are colored based on if they are from different disease stage. |
Top |
Malignant transformation related pathway analysis |
| Find out the enriched GO biological processes and KEGG pathways involved in transition from healthy to precancer to cancer |
| Tissue | Disease Stage | Enriched GO biological Processes |
| Colorectum | AD |  |
| Colorectum | SER |  |
| Colorectum | MSS |  |
| Colorectum | MSI-H |  |
| Colorectum | FAP |  |
| ∗Top 15 enriched GO BP terms are showed in the bar plot of each disease state in each tissue. Each row represents a significant GO biological process which is colored according to the -log10(p.adjust). |
| Page: 1 2 3 4 5 6 7 8 9 |
| GO ID | Tissue | Disease Stage | Description | Gene Ratio | Bg Ratio | pvalue | p.adjust | Count |
| GO:001605517 | Esophagus | ESCC | Wnt signaling pathway | 268/8552 | 444/18723 | 2.32e-10 | 6.58e-09 | 268 |
| GO:019873817 | Esophagus | ESCC | cell-cell signaling by wnt | 269/8552 | 446/18723 | 2.41e-10 | 6.79e-09 | 269 |
| GO:00017387 | Esophagus | ESCC | morphogenesis of a polarized epithelium | 63/8552 | 94/18723 | 2.34e-05 | 2.00e-04 | 63 |
| GO:00600714 | Esophagus | ESCC | Wnt signaling pathway, planar cell polarity pathway | 36/8552 | 52/18723 | 5.05e-04 | 2.79e-03 | 36 |
| GO:00901753 | Esophagus | ESCC | regulation of establishment of planar polarity | 37/8552 | 56/18723 | 1.65e-03 | 7.65e-03 | 37 |
| GO:00434731 | Esophagus | ESCC | pigmentation | 59/8552 | 98/18723 | 2.64e-03 | 1.12e-02 | 59 |
| GO:00017361 | Esophagus | ESCC | establishment of planar polarity | 45/8552 | 72/18723 | 2.97e-03 | 1.24e-02 | 45 |
| GO:00071641 | Esophagus | ESCC | establishment of tissue polarity | 45/8552 | 72/18723 | 2.97e-03 | 1.24e-02 | 45 |
| GO:00355671 | Esophagus | ESCC | non-canonical Wnt signaling pathway | 45/8552 | 72/18723 | 2.97e-03 | 1.24e-02 | 45 |
| GO:20000274 | Esophagus | ESCC | regulation of animal organ morphogenesis | 71/8552 | 125/18723 | 7.97e-03 | 2.84e-02 | 71 |
| GO:001605524 | Skin | cSCC | Wnt signaling pathway | 158/4864 | 444/18723 | 3.80e-06 | 5.70e-05 | 158 |
| GO:019873824 | Skin | cSCC | cell-cell signaling by wnt | 158/4864 | 446/18723 | 5.08e-06 | 7.38e-05 | 158 |
| GO:000173821 | Skin | cSCC | morphogenesis of a polarized epithelium | 35/4864 | 94/18723 | 1.05e-02 | 4.61e-02 | 35 |
| Page: 1 |
| Pathway ID | Tissue | Disease Stage | Description | Gene Ratio | Bg Ratio | pvalue | p.adjust | qvalue | Count |
| Page: 1 |
Top |
Cell-cell communication analysis |
| Identification of potential cell-cell interactions between two cell types and their ligand-receptor pairs for different disease states |
| Ligand | Receptor | LRpair | Pathway | Tissue | Disease Stage |
| Page: 1 |
Top |
Single-cell gene regulatory network inference analysis |
| Find out the significant the regulons (TFs) and the target genes of each regulon across cell types for different disease states |
| TF | Cell Type | Tissue | Disease Stage | Target Gene | RSS | Regulon Activity |
| ∗The dot plots of a searched regulon are shown for all cell subpopulations in each disease state of each tissue based on the regulon specific score inferred using pySCENIC and by calculating the average expression. |
| Page: 1 |
Top |
Somatic mutation of malignant transformation related genes |
| Annotation of somatic variants for genes involved in malignant transformation |
| Hugo Symbol | Variant Class | Variant Classification | dbSNP RS | HGVSc | HGVSp | HGVSp Short | SWISSPROT | BIOTYPE | SIFT | PolyPhen | Tumor Sample Barcode | Tissue | Histology | Sex | Age | Stage | Therapy Types | Drugs | Outcome |
| VANGL1 | SNV | Missense_Mutation | rs747601622 | c.1250N>G | p.Tyr417Cys | p.Y417C | Q8TAA9 | protein_coding | tolerated(0.2) | benign(0.003) | TCGA-A7-A0CE-01 | Breast | breast invasive carcinoma | Female | <65 | I/II | Chemotherapy | adriamycin | SD |
| VANGL1 | SNV | Missense_Mutation | c.542G>T | p.Arg181Leu | p.R181L | Q8TAA9 | protein_coding | deleterious(0) | probably_damaging(0.943) | TCGA-A7-A0DB-01 | Breast | breast invasive carcinoma | Female | <65 | I/II | Hormone Therapy | arimidex | SD | |
| VANGL1 | SNV | Missense_Mutation | c.1543G>T | p.Val515Phe | p.V515F | Q8TAA9 | protein_coding | deleterious(0.03) | possibly_damaging(0.717) | TCGA-B6-A0WZ-01 | Breast | breast invasive carcinoma | Female | <65 | I/II | Unknown | Unknown | PD | |
| VANGL1 | SNV | Missense_Mutation | rs368071458 | c.1001N>A | p.Arg334Gln | p.R334Q | Q8TAA9 | protein_coding | tolerated(0.06) | benign(0.005) | TCGA-BH-A0HL-01 | Breast | breast invasive carcinoma | Female | <65 | I/II | Chemotherapy | cyclophosphamide | SD |
| VANGL1 | SNV | Missense_Mutation | c.682N>A | p.Asp228Asn | p.D228N | Q8TAA9 | protein_coding | tolerated(0.07) | probably_damaging(0.999) | TCGA-BH-A2L8-01 | Breast | breast invasive carcinoma | Female | <65 | I/II | Chemotherapy | cytoxan | CR | |
| VANGL1 | SNV | Missense_Mutation | c.613G>C | p.Gly205Arg | p.G205R | Q8TAA9 | protein_coding | tolerated(0.12) | probably_damaging(1) | TCGA-D8-A1XQ-01 | Breast | breast invasive carcinoma | Female | >=65 | I/II | Unknown | Unknown | SD | |
| VANGL1 | SNV | Missense_Mutation | c.1561G>C | p.Glu521Gln | p.E521Q | Q8TAA9 | protein_coding | deleterious(0) | probably_damaging(0.998) | TCGA-E2-A15M-01 | Breast | breast invasive carcinoma | Female | >=65 | I/II | Hormone Therapy | arimidex | SD | |
| VANGL1 | insertion | Frame_Shift_Ins | novel | c.1252_1253insTTTCTTTCTCCCTTCCTCCCTCTCCACTCTCTGAGGG | p.His418LeufsTer49 | p.H418Lfs*49 | Q8TAA9 | protein_coding | TCGA-A7-A0CE-01 | Breast | breast invasive carcinoma | Female | <65 | I/II | Chemotherapy | adriamycin | SD | ||
| VANGL1 | insertion | Nonsense_Mutation | novel | c.157_158insCATAACTAAATCTGATCAGTTTACCCACCAGCTGAAATGTGT | p.Gly53delinsAlaTerLeuAsnLeuIleSerLeuProThrSerTerAsnValTer | p.G53delinsA*LNLISLPTS*NV* | Q8TAA9 | protein_coding | TCGA-AO-A0JB-01 | Breast | breast invasive carcinoma | Female | <65 | III/IV | Chemotherapy | cyclophosphamide | SD | ||
| VANGL1 | SNV | Missense_Mutation | c.1532N>T | p.Ser511Phe | p.S511F | Q8TAA9 | protein_coding | deleterious(0.03) | benign(0.046) | TCGA-AA-3685-01 | Colorectum | colon adenocarcinoma | Male | >=65 | I/II | Unknown | Unknown | SD |
| Page: 1 2 3 4 5 6 7 |
Top |
Related drugs of malignant transformation related genes |
| Identification of chemicals and drugs interact with genes involved in malignant transfromation |
| (DGIdb 4.0) |
| Entrez ID | Symbol | Category | Interaction Types | Drug Claim Name | Drug Name | PMIDs |
| Page: 1 |

Copyright 2023-Present -The University of Texas Health Science Center at Houston |