
|
|||||
|
 | |
| |
| |
| |
| |
| |
|
Gene: VAMP7 |
Gene summary for VAMP7 |
| Gene information | Species | Human | Gene symbol | VAMP7 | Gene ID | 6845 |
| Gene name | vesicle associated membrane protein 7 | |
| Gene Alias | SYBL1 | |
| Cytomap | Xq28 | |
| Gene Type | protein-coding | GO ID | GO:0001775 | UniProtAcc | P51809 |
Top |
Malignant transformation analysis |
| Identification of the aberrant gene expression in precancerous and cancerous lesions by comparing the gene expression of stem-like cells in diseased tissues with normal stem cells |
| Entrez ID | Symbol | Replicates | Species | Organ | Tissue | Adj P-value | Log2FC | Malignancy |
| 6845 | VAMP7 | LZE4T | Human | Esophagus | ESCC | 1.59e-14 | 2.30e-01 | 0.0811 |
| 6845 | VAMP7 | LZE7T | Human | Esophagus | ESCC | 7.19e-06 | 2.99e-01 | 0.0667 |
| 6845 | VAMP7 | LZE22T | Human | Esophagus | ESCC | 2.56e-02 | 1.24e-01 | 0.068 |
| 6845 | VAMP7 | LZE24D1 | Human | Esophagus | HGIN | 1.44e-02 | 4.17e-01 | 0.054 |
| 6845 | VAMP7 | LZE24T | Human | Esophagus | ESCC | 5.58e-32 | 7.38e-01 | 0.0596 |
| 6845 | VAMP7 | LZE6T | Human | Esophagus | ESCC | 6.97e-04 | 2.28e-01 | 0.0845 |
| 6845 | VAMP7 | P1T-E | Human | Esophagus | ESCC | 5.89e-05 | 3.14e-01 | 0.0875 |
| 6845 | VAMP7 | P2T-E | Human | Esophagus | ESCC | 5.19e-26 | 3.73e-01 | 0.1177 |
| 6845 | VAMP7 | P4T-E | Human | Esophagus | ESCC | 1.36e-18 | 3.47e-01 | 0.1323 |
| 6845 | VAMP7 | P5T-E | Human | Esophagus | ESCC | 1.29e-13 | 2.34e-01 | 0.1327 |
| 6845 | VAMP7 | P8T-E | Human | Esophagus | ESCC | 3.20e-26 | 2.97e-01 | 0.0889 |
| 6845 | VAMP7 | P9T-E | Human | Esophagus | ESCC | 2.00e-13 | 2.52e-01 | 0.1131 |
| 6845 | VAMP7 | P10T-E | Human | Esophagus | ESCC | 4.30e-26 | 4.86e-01 | 0.116 |
| 6845 | VAMP7 | P11T-E | Human | Esophagus | ESCC | 2.73e-15 | 4.82e-01 | 0.1426 |
| 6845 | VAMP7 | P12T-E | Human | Esophagus | ESCC | 2.93e-23 | 3.95e-01 | 0.1122 |
| 6845 | VAMP7 | P15T-E | Human | Esophagus | ESCC | 1.72e-20 | 3.03e-01 | 0.1149 |
| 6845 | VAMP7 | P16T-E | Human | Esophagus | ESCC | 4.02e-06 | 1.21e-01 | 0.1153 |
| 6845 | VAMP7 | P17T-E | Human | Esophagus | ESCC | 2.28e-03 | 2.46e-01 | 0.1278 |
| 6845 | VAMP7 | P19T-E | Human | Esophagus | ESCC | 1.03e-10 | 8.72e-01 | 0.1662 |
| 6845 | VAMP7 | P20T-E | Human | Esophagus | ESCC | 1.19e-17 | 3.54e-01 | 0.1124 |
| Page: 1 2 3 4 5 |
| Tissue | Expression Dynamics | Abbreviation |
| Esophagus | 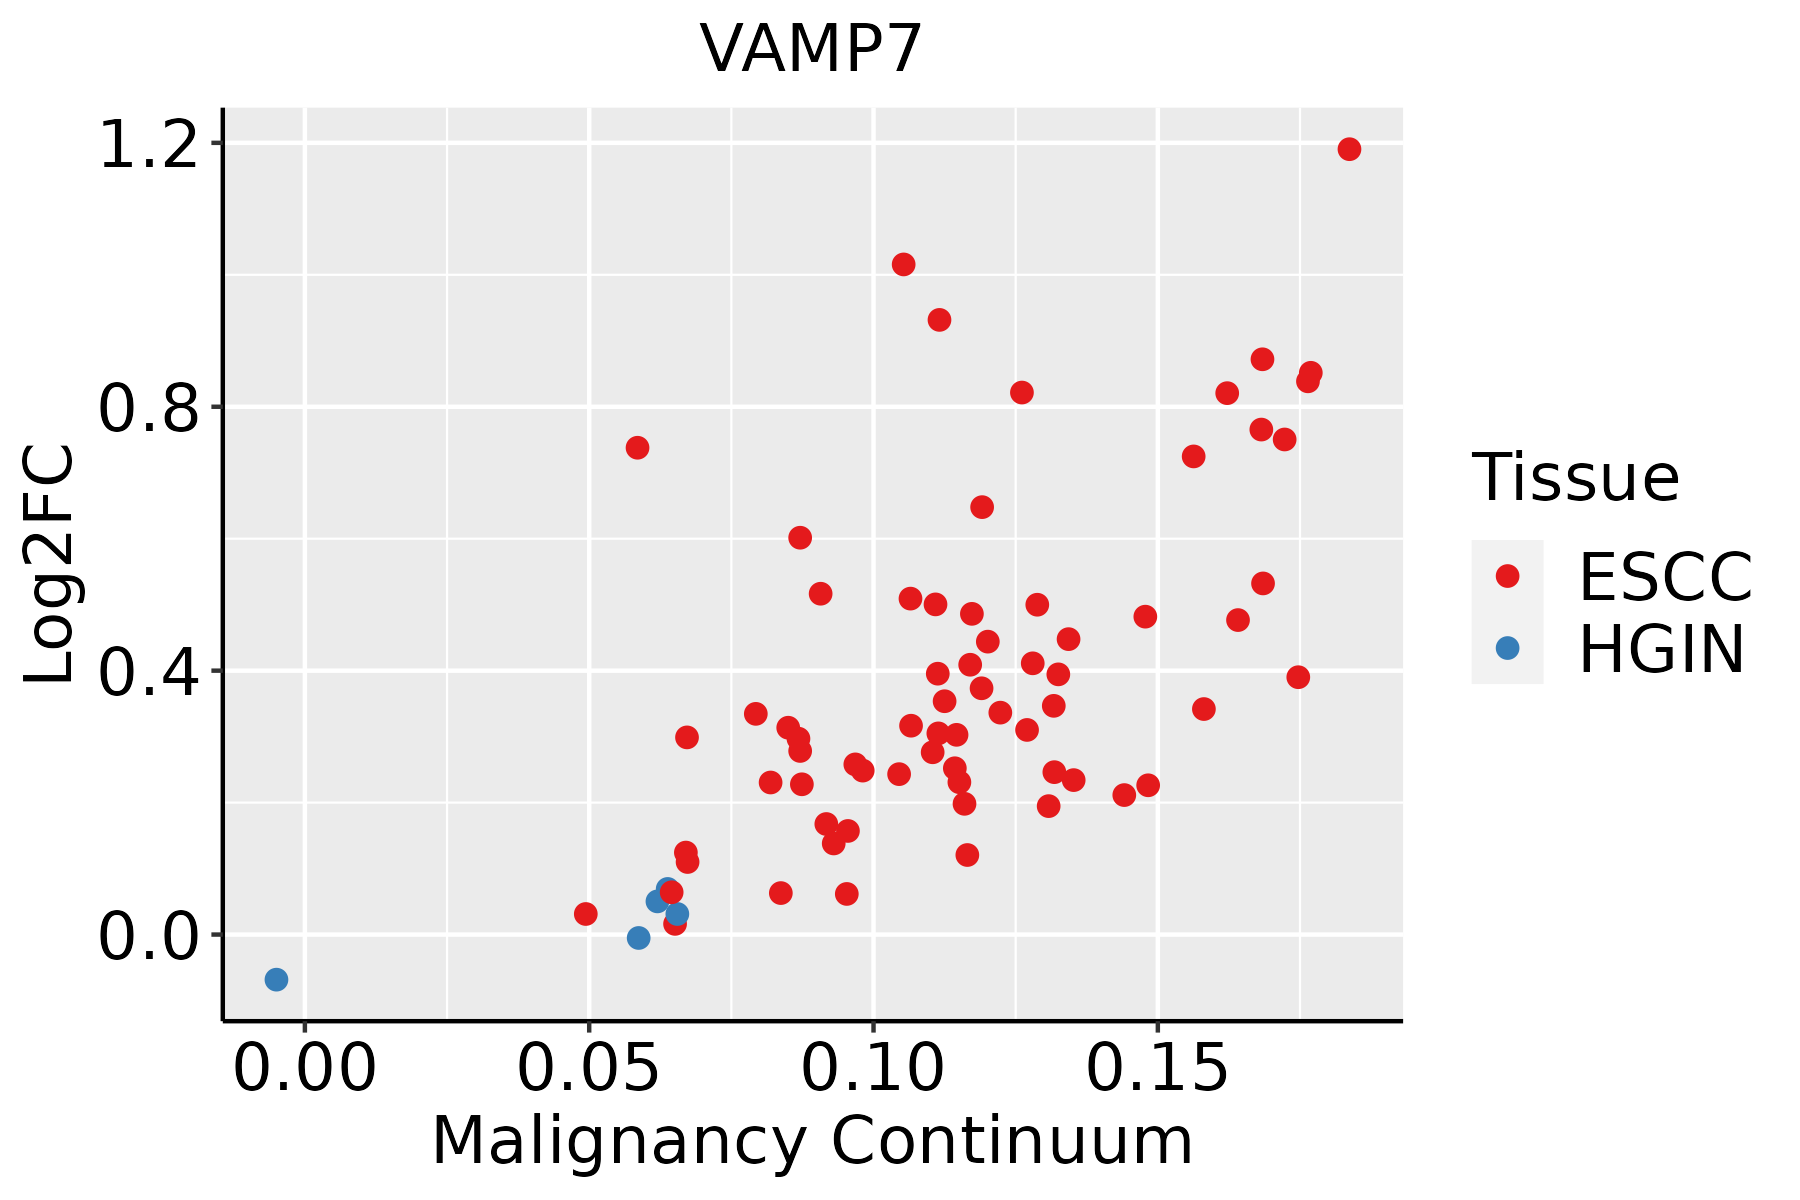 | ESCC: Esophageal squamous cell carcinoma |
| HGIN: High-grade intraepithelial neoplasias | ||
| LGIN: Low-grade intraepithelial neoplasias | ||
| Liver |  | HCC: Hepatocellular carcinoma |
| NAFLD: Non-alcoholic fatty liver disease | ||
| Oral Cavity |  | EOLP: Erosive Oral lichen planus |
| LP: leukoplakia | ||
| NEOLP: Non-erosive oral lichen planus | ||
| OSCC: Oral squamous cell carcinoma | ||
| Skin |  | AK: Actinic keratosis |
| cSCC: Cutaneous squamous cell carcinoma | ||
| SCCIS:squamous cell carcinoma in situ |
| ∗log2FC in expression of this searched gene in stem-like cells from each diseased tissue sample relative to stem-like cells in normal samples in each tissue plotted against the malignancy continuum. Samples are colored based on if they are from different disease stage. |
Top |
Malignant transformation related pathway analysis |
| Find out the enriched GO biological processes and KEGG pathways involved in transition from healthy to precancer to cancer |
| Tissue | Disease Stage | Enriched GO biological Processes |
| Colorectum | AD |  |
| Colorectum | SER |  |
| Colorectum | MSS |  |
| Colorectum | MSI-H |  |
| Colorectum | FAP |  |
| ∗Top 15 enriched GO BP terms are showed in the bar plot of each disease state in each tissue. Each row represents a significant GO biological process which is colored according to the -log10(p.adjust). |
| Page: 1 2 3 4 5 6 7 8 9 |
| GO ID | Tissue | Disease Stage | Description | Gene Ratio | Bg Ratio | pvalue | p.adjust | Count |
| GO:004819318 | Esophagus | ESCC | Golgi vesicle transport | 231/8552 | 296/18723 | 1.82e-30 | 9.63e-28 | 231 |
| GO:005165617 | Esophagus | ESCC | establishment of organelle localization | 273/8552 | 390/18723 | 9.13e-23 | 1.81e-20 | 273 |
| GO:001605014 | Esophagus | ESCC | vesicle organization | 211/8552 | 300/18723 | 2.85e-18 | 2.87e-16 | 211 |
| GO:000703417 | Esophagus | ESCC | vacuolar transport | 119/8552 | 157/18723 | 1.16e-14 | 6.30e-13 | 119 |
| GO:000688815 | Esophagus | ESCC | endoplasmic reticulum to Golgi vesicle-mediated transport | 102/8552 | 130/18723 | 1.73e-14 | 9.22e-13 | 102 |
| GO:005165016 | Esophagus | ESCC | establishment of vesicle localization | 114/8552 | 161/18723 | 8.20e-11 | 2.53e-09 | 114 |
| GO:003070518 | Esophagus | ESCC | cytoskeleton-dependent intracellular transport | 133/8552 | 195/18723 | 1.48e-10 | 4.27e-09 | 133 |
| GO:001097013 | Esophagus | ESCC | transport along microtubule | 107/8552 | 155/18723 | 3.17e-09 | 6.80e-08 | 107 |
| GO:00070419 | Esophagus | ESCC | lysosomal transport | 83/8552 | 114/18723 | 3.52e-09 | 7.41e-08 | 83 |
| GO:005164815 | Esophagus | ESCC | vesicle localization | 119/8552 | 177/18723 | 5.16e-09 | 1.08e-07 | 119 |
| GO:00723846 | Esophagus | ESCC | organelle transport along microtubule | 65/8552 | 85/18723 | 6.61e-09 | 1.35e-07 | 65 |
| GO:00482844 | Esophagus | ESCC | organelle fusion | 94/8552 | 141/18723 | 3.72e-07 | 5.16e-06 | 94 |
| GO:00070308 | Esophagus | ESCC | Golgi organization | 101/8552 | 157/18723 | 1.78e-06 | 2.10e-05 | 101 |
| GO:00901743 | Esophagus | ESCC | organelle membrane fusion | 73/8552 | 110/18723 | 9.29e-06 | 8.88e-05 | 73 |
| GO:00474962 | Esophagus | ESCC | vesicle transport along microtubule | 36/8552 | 47/18723 | 1.53e-05 | 1.38e-04 | 36 |
| GO:00069063 | Esophagus | ESCC | vesicle fusion | 70/8552 | 106/18723 | 1.82e-05 | 1.60e-04 | 70 |
| GO:00991114 | Esophagus | ESCC | microtubule-based transport | 115/8552 | 190/18723 | 2.54e-05 | 2.15e-04 | 115 |
| GO:00083333 | Esophagus | ESCC | endosome to lysosome transport | 40/8552 | 55/18723 | 4.27e-05 | 3.42e-04 | 40 |
| GO:00995185 | Esophagus | ESCC | vesicle cytoskeletal trafficking | 50/8552 | 73/18723 | 6.75e-05 | 5.12e-04 | 50 |
| GO:00610254 | Esophagus | ESCC | membrane fusion | 98/8552 | 163/18723 | 1.39e-04 | 9.41e-04 | 98 |
| Page: 1 2 3 4 5 6 |
| Pathway ID | Tissue | Disease Stage | Description | Gene Ratio | Bg Ratio | pvalue | p.adjust | qvalue | Count |
| hsa041305 | Esophagus | ESCC | SNARE interactions in vesicular transport | 28/4205 | 33/8465 | 2.75e-05 | 1.32e-04 | 6.75e-05 | 28 |
| hsa0413012 | Esophagus | ESCC | SNARE interactions in vesicular transport | 28/4205 | 33/8465 | 2.75e-05 | 1.32e-04 | 6.75e-05 | 28 |
| hsa041302 | Liver | HCC | SNARE interactions in vesicular transport | 25/4020 | 33/8465 | 8.78e-04 | 3.38e-03 | 1.88e-03 | 25 |
| hsa041303 | Liver | HCC | SNARE interactions in vesicular transport | 25/4020 | 33/8465 | 8.78e-04 | 3.38e-03 | 1.88e-03 | 25 |
| hsa041304 | Oral cavity | OSCC | SNARE interactions in vesicular transport | 28/3704 | 33/8465 | 1.31e-06 | 7.18e-06 | 3.66e-06 | 28 |
| hsa0413011 | Oral cavity | OSCC | SNARE interactions in vesicular transport | 28/3704 | 33/8465 | 1.31e-06 | 7.18e-06 | 3.66e-06 | 28 |
| Page: 1 |
Top |
Cell-cell communication analysis |
| Identification of potential cell-cell interactions between two cell types and their ligand-receptor pairs for different disease states |
| Ligand | Receptor | LRpair | Pathway | Tissue | Disease Stage |
| Page: 1 |
Top |
Single-cell gene regulatory network inference analysis |
| Find out the significant the regulons (TFs) and the target genes of each regulon across cell types for different disease states |
| TF | Cell Type | Tissue | Disease Stage | Target Gene | RSS | Regulon Activity |
| ∗The dot plots of a searched regulon are shown for all cell subpopulations in each disease state of each tissue based on the regulon specific score inferred using pySCENIC and by calculating the average expression. |
| Page: 1 |
Top |
Somatic mutation of malignant transformation related genes |
| Annotation of somatic variants for genes involved in malignant transformation |
| Hugo Symbol | Variant Class | Variant Classification | dbSNP RS | HGVSc | HGVSp | HGVSp Short | SWISSPROT | BIOTYPE | SIFT | PolyPhen | Tumor Sample Barcode | Tissue | Histology | Sex | Age | Stage | Therapy Types | Drugs | Outcome |
| VAMP7 | SNV | Missense_Mutation | novel | c.10C>A | p.Leu4Ile | p.L4I | P51809 | protein_coding | tolerated(0.64) | possibly_damaging(0.696) | TCGA-AN-A046-01 | Breast | breast invasive carcinoma | Female | >=65 | I/II | Unknown | Unknown | SD |
| VAMP7 | insertion | Frame_Shift_Ins | novel | c.712_713insC | p.Phe238SerfsTer5 | p.F238Sfs*5 | P51809 | protein_coding | TCGA-BH-A0BR-01 | Breast | breast invasive carcinoma | Female | <65 | I/II | Unknown | Unknown | SD | ||
| VAMP7 | insertion | Frame_Shift_Ins | novel | c.713_714insGATAATTATAATCCCCCTTAAACAAGAACTCTTTGGAGTC | p.Phe238LeufsTer18 | p.F238Lfs*18 | P51809 | protein_coding | TCGA-BH-A0BR-01 | Breast | breast invasive carcinoma | Female | <65 | I/II | Unknown | Unknown | SD | ||
| VAMP7 | SNV | Missense_Mutation | c.579N>C | p.Lys193Asn | p.K193N | P51809 | protein_coding | deleterious_low_confidence(0.01) | benign(0.261) | TCGA-AA-3982-01 | Colorectum | colon adenocarcinoma | Male | >=65 | III/IV | Unknown | Unknown | SD | |
| VAMP7 | SNV | Missense_Mutation | c.134N>G | p.Tyr45Cys | p.Y45C | P51809 | protein_coding | deleterious(0) | probably_damaging(0.996) | TCGA-AA-A00N-01 | Colorectum | colon adenocarcinoma | Male | >=65 | I/II | Unknown | Unknown | PD | |
| VAMP7 | SNV | Missense_Mutation | c.574N>A | p.Ala192Thr | p.A192T | P51809 | protein_coding | deleterious_low_confidence(0.01) | possibly_damaging(0.685) | TCGA-AD-6895-01 | Colorectum | colon adenocarcinoma | Male | >=65 | III/IV | Unknown | Unknown | SD | |
| VAMP7 | SNV | Missense_Mutation | novel | c.603G>T | p.Lys201Asn | p.K201N | P51809 | protein_coding | deleterious_low_confidence(0) | benign(0) | TCGA-AZ-4315-01 | Colorectum | colon adenocarcinoma | Male | <65 | I/II | Unknown | Unknown | SD |
| VAMP7 | SNV | Missense_Mutation | c.668N>A | p.Leu223His | p.L223H | P51809 | protein_coding | possibly_damaging(0.642) | TCGA-CK-6746-01 | Colorectum | colon adenocarcinoma | Female | >=65 | I/II | Unknown | Unknown | SD | ||
| VAMP7 | SNV | Missense_Mutation | novel | c.182N>C | p.Val61Ala | p.V61A | P51809 | protein_coding | tolerated(0.19) | probably_damaging(0.962) | TCGA-A5-A0G2-01 | Endometrium | uterine corpus endometrioid carcinoma | Female | <65 | III/IV | Unknown | Unknown | SD |
| VAMP7 | SNV | Missense_Mutation | novel | c.352T>C | p.Ser118Pro | p.S118P | P51809 | protein_coding | tolerated(0.19) | probably_damaging(0.995) | TCGA-A5-A1OF-01 | Endometrium | uterine corpus endometrioid carcinoma | Female | <65 | I/II | Unknown | Unknown | SD |
| Page: 1 2 3 4 |
Top |
Related drugs of malignant transformation related genes |
| Identification of chemicals and drugs interact with genes involved in malignant transfromation |
| (DGIdb 4.0) |
| Entrez ID | Symbol | Category | Interaction Types | Drug Claim Name | Drug Name | PMIDs |
| Page: 1 |

Copyright 2023-Present -The University of Texas Health Science Center at Houston |