
|
|||||
|
 | |
| |
| |
| |
| |
| |
|
Gene: VAMP5 |
Gene summary for VAMP5 |
| Gene information | Species | Human | Gene symbol | VAMP5 | Gene ID | 10791 |
| Gene name | vesicle associated membrane protein 5 | |
| Gene Alias | VAMP5 | |
| Cytomap | 2p11.2 | |
| Gene Type | protein-coding | GO ID | GO:0006810 | UniProtAcc | O95183 |
Top |
Malignant transformation analysis |
| Identification of the aberrant gene expression in precancerous and cancerous lesions by comparing the gene expression of stem-like cells in diseased tissues with normal stem cells |
| Entrez ID | Symbol | Replicates | Species | Organ | Tissue | Adj P-value | Log2FC | Malignancy |
| 10791 | VAMP5 | LZE4T | Human | Esophagus | ESCC | 7.66e-14 | 3.28e-01 | 0.0811 |
| 10791 | VAMP5 | LZE8T | Human | Esophagus | ESCC | 3.47e-03 | 1.24e-01 | 0.067 |
| 10791 | VAMP5 | LZE20T | Human | Esophagus | ESCC | 4.19e-04 | 3.97e-01 | 0.0662 |
| 10791 | VAMP5 | LZE22D1 | Human | Esophagus | HGIN | 1.61e-07 | 1.81e-01 | 0.0595 |
| 10791 | VAMP5 | LZE22T | Human | Esophagus | ESCC | 7.64e-06 | 1.10e+00 | 0.068 |
| 10791 | VAMP5 | LZE21T | Human | Esophagus | ESCC | 3.02e-02 | -4.95e-03 | 0.0655 |
| 10791 | VAMP5 | LZE6T | Human | Esophagus | ESCC | 1.03e-06 | 8.83e-02 | 0.0845 |
| 10791 | VAMP5 | P1T-E | Human | Esophagus | ESCC | 1.41e-02 | 6.13e-01 | 0.0875 |
| 10791 | VAMP5 | P2T-E | Human | Esophagus | ESCC | 4.95e-22 | 1.68e-01 | 0.1177 |
| 10791 | VAMP5 | P4T-E | Human | Esophagus | ESCC | 4.92e-17 | 7.00e-01 | 0.1323 |
| 10791 | VAMP5 | P5T-E | Human | Esophagus | ESCC | 3.61e-02 | 3.12e-01 | 0.1327 |
| 10791 | VAMP5 | P8T-E | Human | Esophagus | ESCC | 3.34e-42 | 1.03e+00 | 0.0889 |
| 10791 | VAMP5 | P9T-E | Human | Esophagus | ESCC | 4.88e-10 | 8.45e-01 | 0.1131 |
| 10791 | VAMP5 | P11T-E | Human | Esophagus | ESCC | 3.36e-35 | 1.66e+00 | 0.1426 |
| 10791 | VAMP5 | P12T-E | Human | Esophagus | ESCC | 5.67e-14 | 5.00e-01 | 0.1122 |
| 10791 | VAMP5 | P16T-E | Human | Esophagus | ESCC | 6.98e-25 | 2.71e-01 | 0.1153 |
| 10791 | VAMP5 | P19T-E | Human | Esophagus | ESCC | 4.13e-08 | 1.15e+00 | 0.1662 |
| 10791 | VAMP5 | P20T-E | Human | Esophagus | ESCC | 1.04e-11 | 6.67e-01 | 0.1124 |
| 10791 | VAMP5 | P21T-E | Human | Esophagus | ESCC | 1.80e-08 | 4.90e-01 | 0.1617 |
| 10791 | VAMP5 | P24T-E | Human | Esophagus | ESCC | 8.26e-31 | 1.06e+00 | 0.1287 |
| Page: 1 2 3 4 5 |
| Tissue | Expression Dynamics | Abbreviation |
| Esophagus | 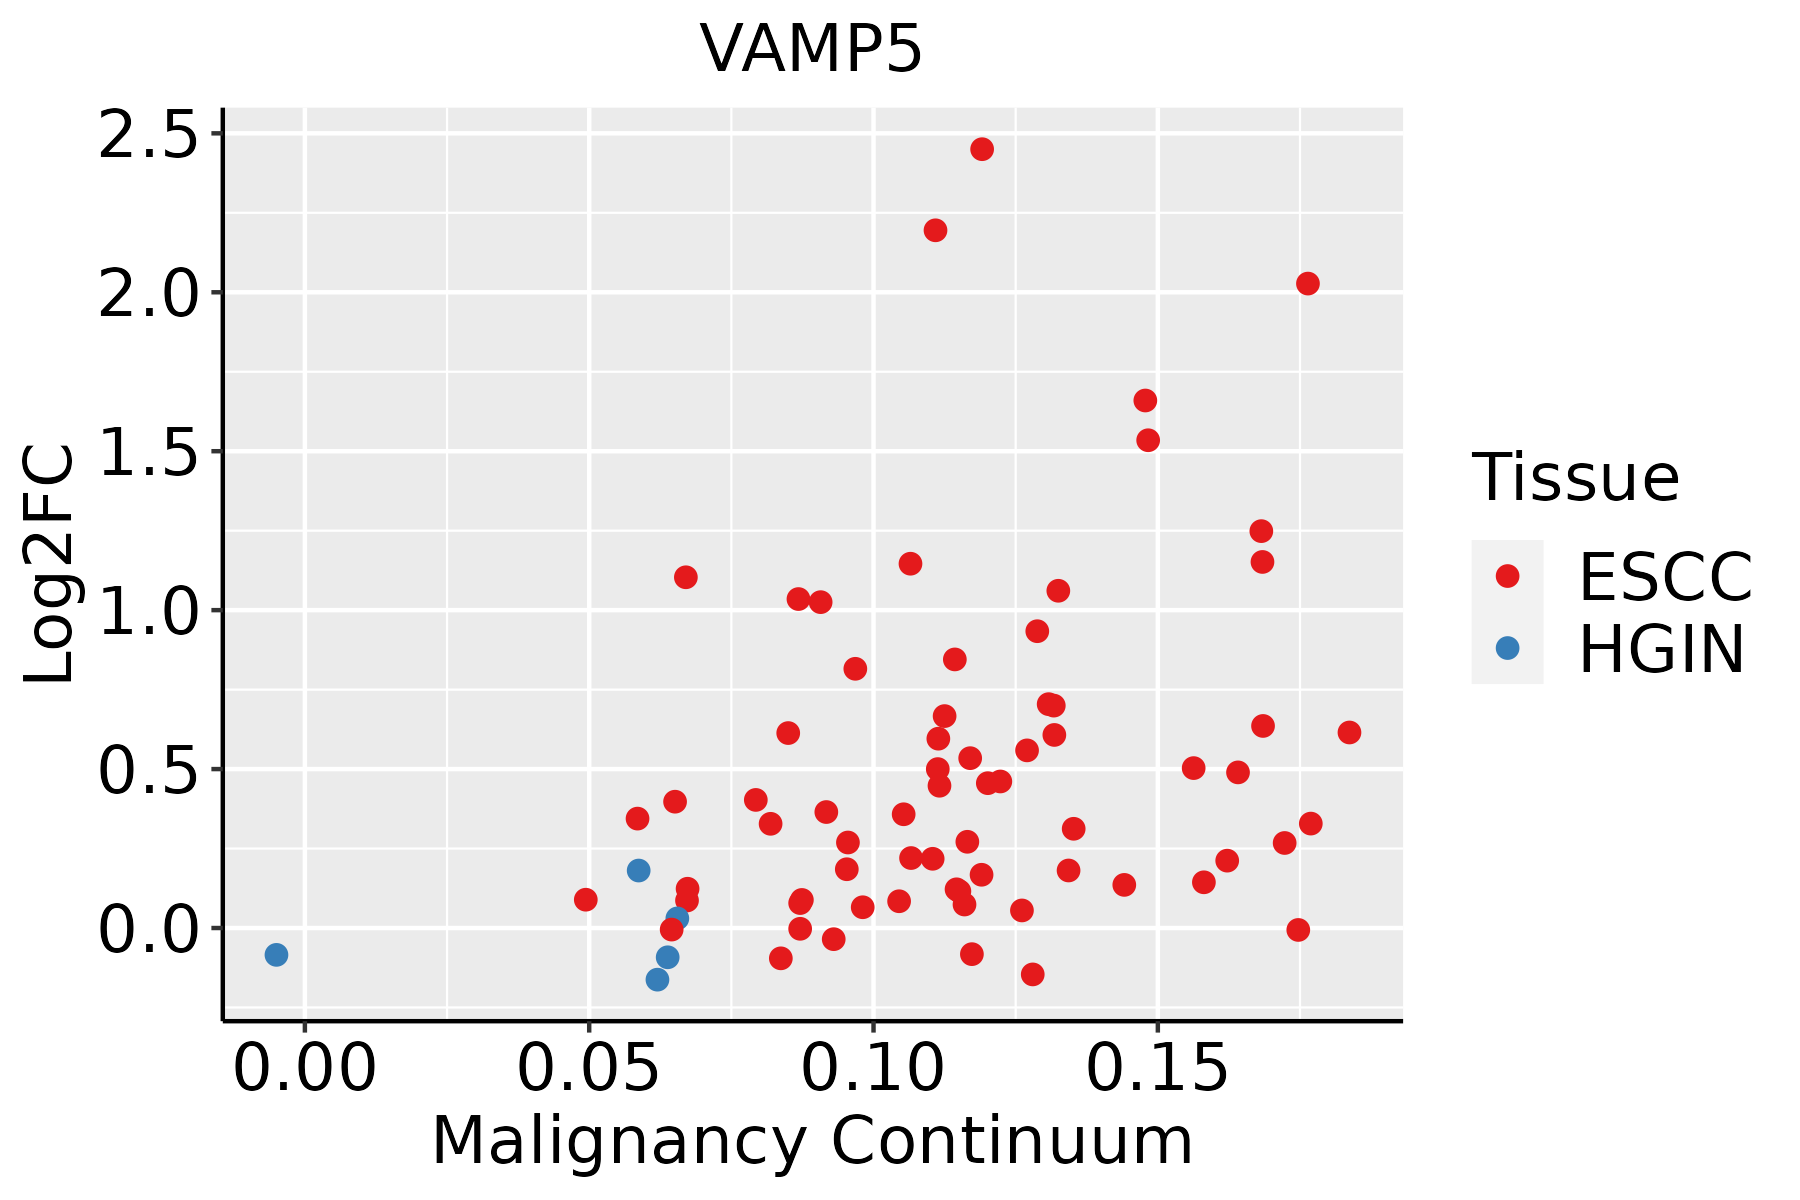 | ESCC: Esophageal squamous cell carcinoma |
| HGIN: High-grade intraepithelial neoplasias | ||
| LGIN: Low-grade intraepithelial neoplasias | ||
| Liver |  | HCC: Hepatocellular carcinoma |
| NAFLD: Non-alcoholic fatty liver disease | ||
| Oral Cavity | 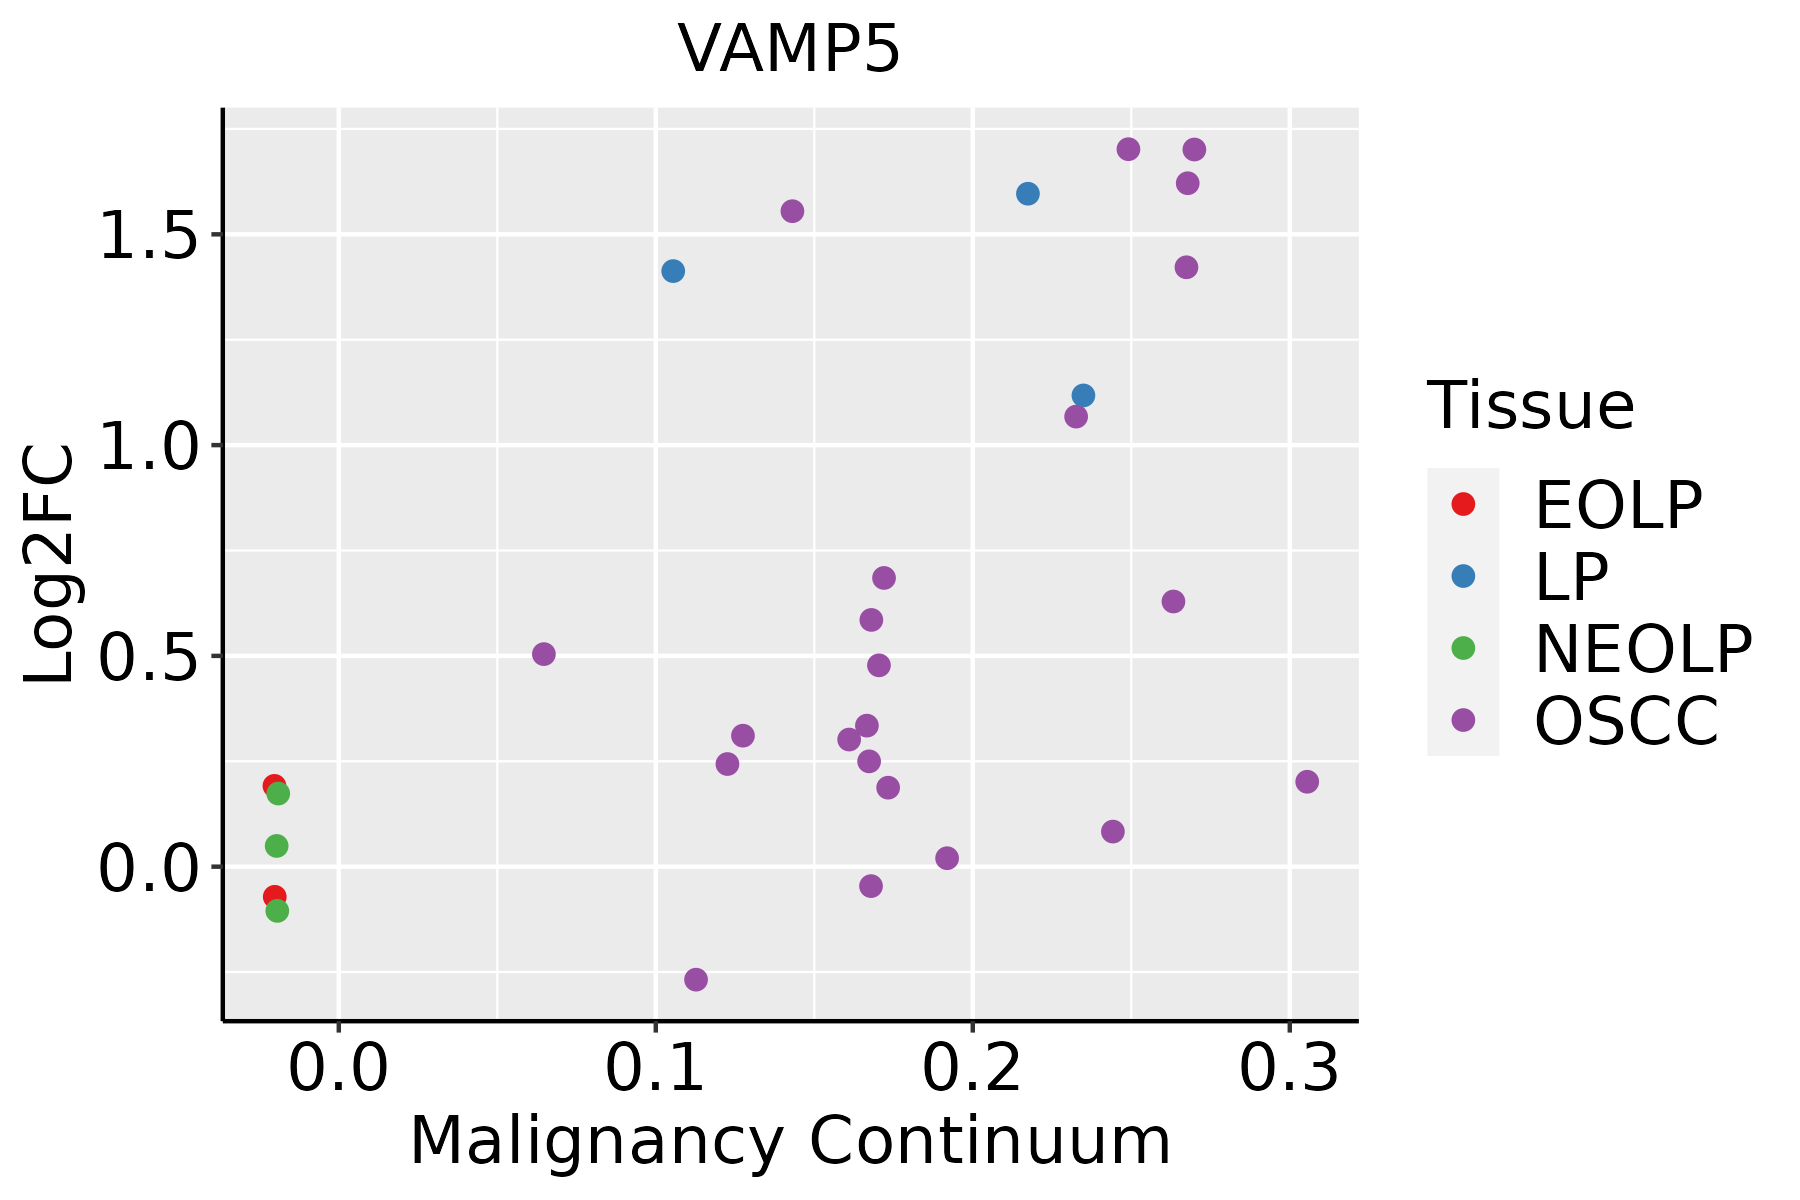 | EOLP: Erosive Oral lichen planus |
| LP: leukoplakia | ||
| NEOLP: Non-erosive oral lichen planus | ||
| OSCC: Oral squamous cell carcinoma | ||
| Thyroid | 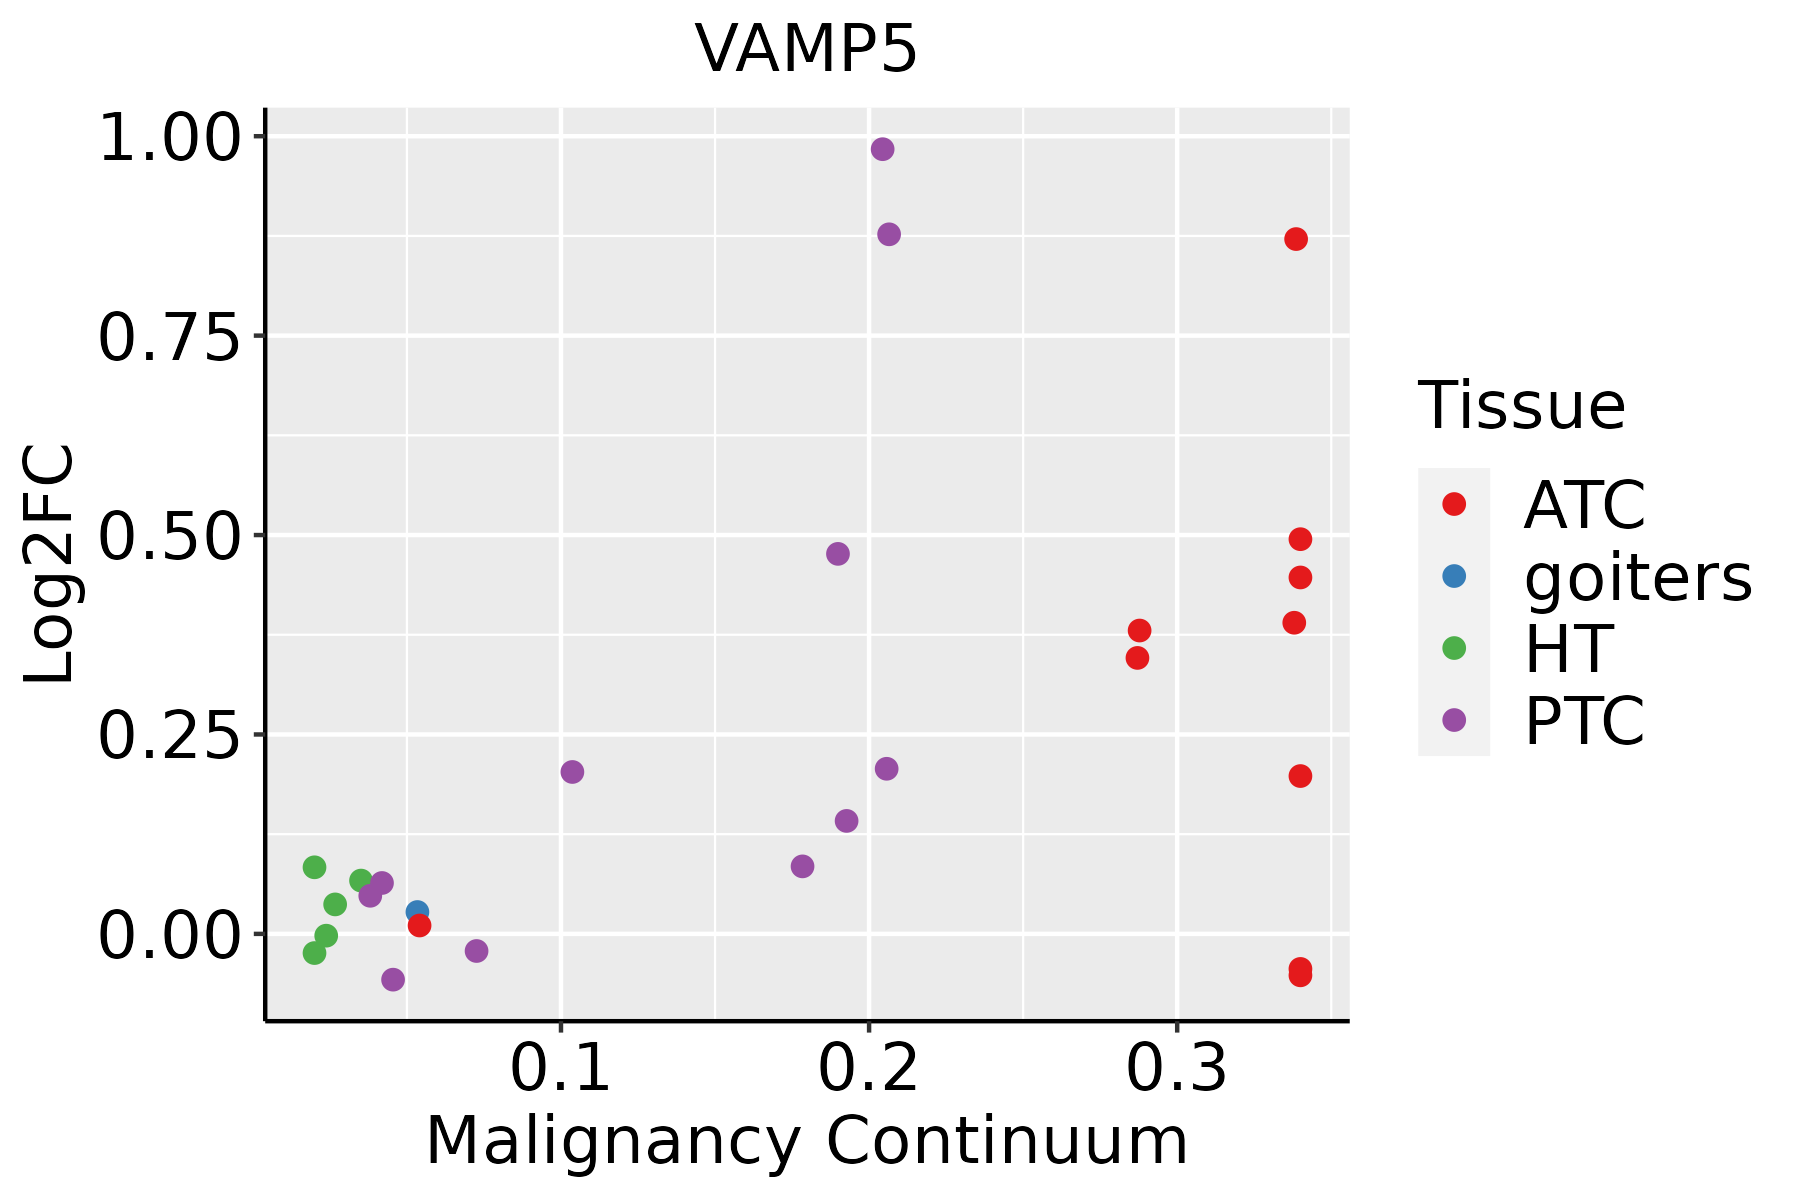 | ATC: Anaplastic thyroid cancer |
| HT: Hashimoto's thyroiditis | ||
| PTC: Papillary thyroid cancer |
| ∗log2FC in expression of this searched gene in stem-like cells from each diseased tissue sample relative to stem-like cells in normal samples in each tissue plotted against the malignancy continuum. Samples are colored based on if they are from different disease stage. |
Top |
Malignant transformation related pathway analysis |
| Find out the enriched GO biological processes and KEGG pathways involved in transition from healthy to precancer to cancer |
| Tissue | Disease Stage | Enriched GO biological Processes |
| Colorectum | AD |  |
| Colorectum | SER |  |
| Colorectum | MSS |  |
| Colorectum | MSI-H |  |
| Colorectum | FAP |  |
| ∗Top 15 enriched GO BP terms are showed in the bar plot of each disease state in each tissue. Each row represents a significant GO biological process which is colored according to the -log10(p.adjust). |
| Page: 1 2 3 4 5 6 7 8 9 |
| GO ID | Tissue | Disease Stage | Description | Gene Ratio | Bg Ratio | pvalue | p.adjust | Count |
| GO:004819317 | Esophagus | HGIN | Golgi vesicle transport | 83/2587 | 296/18723 | 8.59e-11 | 8.89e-09 | 83 |
| GO:009015020 | Esophagus | HGIN | establishment of protein localization to membrane | 67/2587 | 260/18723 | 1.96e-07 | 9.57e-06 | 67 |
| GO:007265920 | Esophagus | HGIN | protein localization to plasma membrane | 66/2587 | 284/18723 | 1.11e-05 | 3.18e-04 | 66 |
| GO:009887610 | Esophagus | HGIN | vesicle-mediated transport to the plasma membrane | 36/2587 | 136/18723 | 6.76e-05 | 1.55e-03 | 36 |
| GO:199077818 | Esophagus | HGIN | protein localization to cell periphery | 71/2587 | 333/18723 | 1.05e-04 | 2.24e-03 | 71 |
| GO:000689210 | Esophagus | HGIN | post-Golgi vesicle-mediated transport | 26/2587 | 104/18723 | 1.63e-03 | 1.81e-02 | 26 |
| GO:00430019 | Esophagus | HGIN | Golgi to plasma membrane protein transport | 13/2587 | 40/18723 | 2.04e-03 | 2.13e-02 | 13 |
| GO:00068939 | Esophagus | HGIN | Golgi to plasma membrane transport | 17/2587 | 60/18723 | 2.46e-03 | 2.45e-02 | 17 |
| GO:00619519 | Esophagus | HGIN | establishment of protein localization to plasma membrane | 17/2587 | 60/18723 | 2.46e-03 | 2.45e-02 | 17 |
| GO:00605379 | Esophagus | HGIN | muscle tissue development | 76/2587 | 403/18723 | 2.67e-03 | 2.63e-02 | 76 |
| GO:00147068 | Esophagus | HGIN | striated muscle tissue development | 72/2587 | 384/18723 | 3.94e-03 | 3.56e-02 | 72 |
| GO:004819318 | Esophagus | ESCC | Golgi vesicle transport | 231/8552 | 296/18723 | 1.82e-30 | 9.63e-28 | 231 |
| GO:0090150110 | Esophagus | ESCC | establishment of protein localization to membrane | 182/8552 | 260/18723 | 1.27e-15 | 8.19e-14 | 182 |
| GO:0072659110 | Esophagus | ESCC | protein localization to plasma membrane | 193/8552 | 284/18723 | 1.95e-14 | 1.03e-12 | 193 |
| GO:199077819 | Esophagus | ESCC | protein localization to cell periphery | 217/8552 | 333/18723 | 4.08e-13 | 1.88e-11 | 217 |
| GO:000689215 | Esophagus | ESCC | post-Golgi vesicle-mediated transport | 82/8552 | 104/18723 | 4.00e-12 | 1.55e-10 | 82 |
| GO:009887615 | Esophagus | ESCC | vesicle-mediated transport to the plasma membrane | 99/8552 | 136/18723 | 1.13e-10 | 3.39e-09 | 99 |
| GO:000689315 | Esophagus | ESCC | Golgi to plasma membrane transport | 48/8552 | 60/18723 | 5.11e-08 | 9.16e-07 | 48 |
| GO:004300114 | Esophagus | ESCC | Golgi to plasma membrane protein transport | 34/8552 | 40/18723 | 3.00e-07 | 4.27e-06 | 34 |
| GO:006195114 | Esophagus | ESCC | establishment of protein localization to plasma membrane | 44/8552 | 60/18723 | 1.25e-05 | 1.15e-04 | 44 |
| Page: 1 2 3 4 5 |
| Pathway ID | Tissue | Disease Stage | Description | Gene Ratio | Bg Ratio | pvalue | p.adjust | qvalue | Count |
| hsa041305 | Esophagus | ESCC | SNARE interactions in vesicular transport | 28/4205 | 33/8465 | 2.75e-05 | 1.32e-04 | 6.75e-05 | 28 |
| hsa0413012 | Esophagus | ESCC | SNARE interactions in vesicular transport | 28/4205 | 33/8465 | 2.75e-05 | 1.32e-04 | 6.75e-05 | 28 |
| hsa04130 | Liver | Cirrhotic | SNARE interactions in vesicular transport | 18/2530 | 33/8465 | 2.64e-03 | 1.10e-02 | 6.76e-03 | 18 |
| hsa041301 | Liver | Cirrhotic | SNARE interactions in vesicular transport | 18/2530 | 33/8465 | 2.64e-03 | 1.10e-02 | 6.76e-03 | 18 |
| hsa041302 | Liver | HCC | SNARE interactions in vesicular transport | 25/4020 | 33/8465 | 8.78e-04 | 3.38e-03 | 1.88e-03 | 25 |
| hsa041303 | Liver | HCC | SNARE interactions in vesicular transport | 25/4020 | 33/8465 | 8.78e-04 | 3.38e-03 | 1.88e-03 | 25 |
| hsa041304 | Oral cavity | OSCC | SNARE interactions in vesicular transport | 28/3704 | 33/8465 | 1.31e-06 | 7.18e-06 | 3.66e-06 | 28 |
| hsa0413011 | Oral cavity | OSCC | SNARE interactions in vesicular transport | 28/3704 | 33/8465 | 1.31e-06 | 7.18e-06 | 3.66e-06 | 28 |
| hsa0413021 | Oral cavity | LP | SNARE interactions in vesicular transport | 22/2418 | 33/8465 | 6.00e-06 | 4.76e-05 | 3.07e-05 | 22 |
| hsa0413031 | Oral cavity | LP | SNARE interactions in vesicular transport | 22/2418 | 33/8465 | 6.00e-06 | 4.76e-05 | 3.07e-05 | 22 |
| Page: 1 |
Top |
Cell-cell communication analysis |
| Identification of potential cell-cell interactions between two cell types and their ligand-receptor pairs for different disease states |
| Ligand | Receptor | LRpair | Pathway | Tissue | Disease Stage |
| Page: 1 |
Top |
Single-cell gene regulatory network inference analysis |
| Find out the significant the regulons (TFs) and the target genes of each regulon across cell types for different disease states |
| TF | Cell Type | Tissue | Disease Stage | Target Gene | RSS | Regulon Activity |
| ∗The dot plots of a searched regulon are shown for all cell subpopulations in each disease state of each tissue based on the regulon specific score inferred using pySCENIC and by calculating the average expression. |
| Page: 1 |
Top |
Somatic mutation of malignant transformation related genes |
| Annotation of somatic variants for genes involved in malignant transformation |
| Hugo Symbol | Variant Class | Variant Classification | dbSNP RS | HGVSc | HGVSp | HGVSp Short | SWISSPROT | BIOTYPE | SIFT | PolyPhen | Tumor Sample Barcode | Tissue | Histology | Sex | Age | Stage | Therapy Types | Drugs | Outcome |
| VAMP5 | SNV | Missense_Mutation | rs769759669 | c.23N>A | p.Arg8Gln | p.R8Q | O95183 | protein_coding | tolerated(0.69) | benign(0.013) | TCGA-A2-A0CQ-01 | Breast | breast invasive carcinoma | Female | <65 | I/II | Chemotherapy | adriamycin | SD |
| VAMP5 | SNV | Missense_Mutation | novel | c.15N>T | p.Glu5Asp | p.E5D | O95183 | protein_coding | tolerated(0.3) | benign(0.015) | TCGA-OL-A5RW-01 | Breast | breast invasive carcinoma | Female | <65 | I/II | Chemotherapy | adriamycin | CR |
| VAMP5 | SNV | Missense_Mutation | c.38N>T | p.Ala13Val | p.A13V | O95183 | protein_coding | tolerated(0.19) | probably_damaging(0.998) | TCGA-FU-A3HZ-01 | Cervix | cervical & endocervical cancer | Female | <65 | I/II | Chemotherapy | cisplatin | CR | |
| VAMP5 | SNV | Missense_Mutation | rs193102078 | c.271N>A | p.Val91Ile | p.V91I | O95183 | protein_coding | tolerated(1) | benign(0) | TCGA-AA-3821-01 | Colorectum | colon adenocarcinoma | Female | >=65 | I/II | Unknown | Unknown | SD |
| VAMP5 | deletion | Frame_Shift_Del | c.149delN | p.Phe51SerfsTer35 | p.F51Sfs*35 | O95183 | protein_coding | TCGA-AA-3492-01 | Colorectum | colon adenocarcinoma | Female | >=65 | I/II | Unknown | Unknown | SD | |||
| VAMP5 | SNV | Missense_Mutation | rs375941183 | c.310N>T | p.Arg104Trp | p.R104W | O95183 | protein_coding | deleterious(0.01) | benign(0) | TCGA-A5-A2K7-01 | Endometrium | uterine corpus endometrioid carcinoma | Female | <65 | I/II | Chemotherapy | taxol | SD |
| VAMP5 | SNV | Missense_Mutation | c.168G>T | p.Gln56His | p.Q56H | O95183 | protein_coding | tolerated(0.1) | benign(0.006) | TCGA-AX-A2HC-01 | Endometrium | uterine corpus endometrioid carcinoma | Female | <65 | III/IV | Chemotherapy | paclitaxel | PD | |
| VAMP5 | SNV | Missense_Mutation | novel | c.197N>G | p.Asn66Ser | p.N66S | O95183 | protein_coding | deleterious(0.01) | benign(0.067) | TCGA-DI-A1BU-01 | Endometrium | uterine corpus endometrioid carcinoma | Female | <65 | I/II | Chemotherapy | paclitaxel | SD |
| VAMP5 | SNV | Missense_Mutation | rs769624757 | c.89G>A | p.Arg30His | p.R30H | O95183 | protein_coding | tolerated(0.07) | benign(0.165) | TCGA-EO-A3KX-01 | Endometrium | uterine corpus endometrioid carcinoma | Female | >=65 | I/II | Unknown | Unknown | SD |
| VAMP5 | SNV | Missense_Mutation | rs375756032 | c.43N>A | p.Glu15Lys | p.E15K | O95183 | protein_coding | tolerated(0.08) | possibly_damaging(0.845) | TCGA-CR-6481-01 | Oral cavity | head & neck squamous cell carcinoma | Male | <65 | I/II | Chemotherapy | paclitaxel | SD |
| Page: 1 2 |
Top |
Related drugs of malignant transformation related genes |
| Identification of chemicals and drugs interact with genes involved in malignant transfromation |
| (DGIdb 4.0) |
| Entrez ID | Symbol | Category | Interaction Types | Drug Claim Name | Drug Name | PMIDs |
| Page: 1 |

Copyright 2023-Present -The University of Texas Health Science Center at Houston |