
|
|||||
|
 | |
| |
| |
| |
| |
| |
|
Gene: VAMP4 |
Gene summary for VAMP4 |
| Gene information | Species | Human | Gene symbol | VAMP4 | Gene ID | 8674 |
| Gene name | vesicle associated membrane protein 4 | |
| Gene Alias | VAMP-4 | |
| Cytomap | 1q24.3 | |
| Gene Type | protein-coding | GO ID | GO:0000226 | UniProtAcc | O75379 |
Top |
Malignant transformation analysis |
| Identification of the aberrant gene expression in precancerous and cancerous lesions by comparing the gene expression of stem-like cells in diseased tissues with normal stem cells |
| Entrez ID | Symbol | Replicates | Species | Organ | Tissue | Adj P-value | Log2FC | Malignancy |
| 8674 | VAMP4 | LZE2D | Human | Esophagus | HGIN | 3.78e-02 | 5.08e-01 | 0.0642 |
| 8674 | VAMP4 | LZE4T | Human | Esophagus | ESCC | 2.41e-20 | 5.03e-01 | 0.0811 |
| 8674 | VAMP4 | LZE7T | Human | Esophagus | ESCC | 7.28e-05 | 3.39e-01 | 0.0667 |
| 8674 | VAMP4 | LZE20T | Human | Esophagus | ESCC | 2.37e-02 | 1.25e-01 | 0.0662 |
| 8674 | VAMP4 | LZE24T | Human | Esophagus | ESCC | 4.83e-12 | 3.02e-01 | 0.0596 |
| 8674 | VAMP4 | LZE21T | Human | Esophagus | ESCC | 1.14e-03 | 4.62e-01 | 0.0655 |
| 8674 | VAMP4 | LZE6T | Human | Esophagus | ESCC | 4.80e-08 | 3.55e-01 | 0.0845 |
| 8674 | VAMP4 | P1T-E | Human | Esophagus | ESCC | 1.14e-04 | 2.85e-01 | 0.0875 |
| 8674 | VAMP4 | P2T-E | Human | Esophagus | ESCC | 2.03e-13 | 2.41e-01 | 0.1177 |
| 8674 | VAMP4 | P4T-E | Human | Esophagus | ESCC | 5.04e-32 | 7.00e-01 | 0.1323 |
| 8674 | VAMP4 | P5T-E | Human | Esophagus | ESCC | 4.33e-17 | 3.37e-01 | 0.1327 |
| 8674 | VAMP4 | P8T-E | Human | Esophagus | ESCC | 3.92e-07 | 1.66e-01 | 0.0889 |
| 8674 | VAMP4 | P9T-E | Human | Esophagus | ESCC | 8.63e-17 | 5.14e-01 | 0.1131 |
| 8674 | VAMP4 | P10T-E | Human | Esophagus | ESCC | 1.60e-12 | 2.39e-01 | 0.116 |
| 8674 | VAMP4 | P11T-E | Human | Esophagus | ESCC | 1.74e-11 | 4.00e-01 | 0.1426 |
| 8674 | VAMP4 | P12T-E | Human | Esophagus | ESCC | 5.07e-11 | 2.81e-01 | 0.1122 |
| 8674 | VAMP4 | P15T-E | Human | Esophagus | ESCC | 4.64e-21 | 4.44e-01 | 0.1149 |
| 8674 | VAMP4 | P16T-E | Human | Esophagus | ESCC | 9.12e-20 | 3.79e-01 | 0.1153 |
| 8674 | VAMP4 | P17T-E | Human | Esophagus | ESCC | 2.92e-03 | 1.79e-01 | 0.1278 |
| 8674 | VAMP4 | P19T-E | Human | Esophagus | ESCC | 4.68e-10 | 5.70e-01 | 0.1662 |
| Page: 1 2 3 4 5 |
| Tissue | Expression Dynamics | Abbreviation |
| Esophagus | 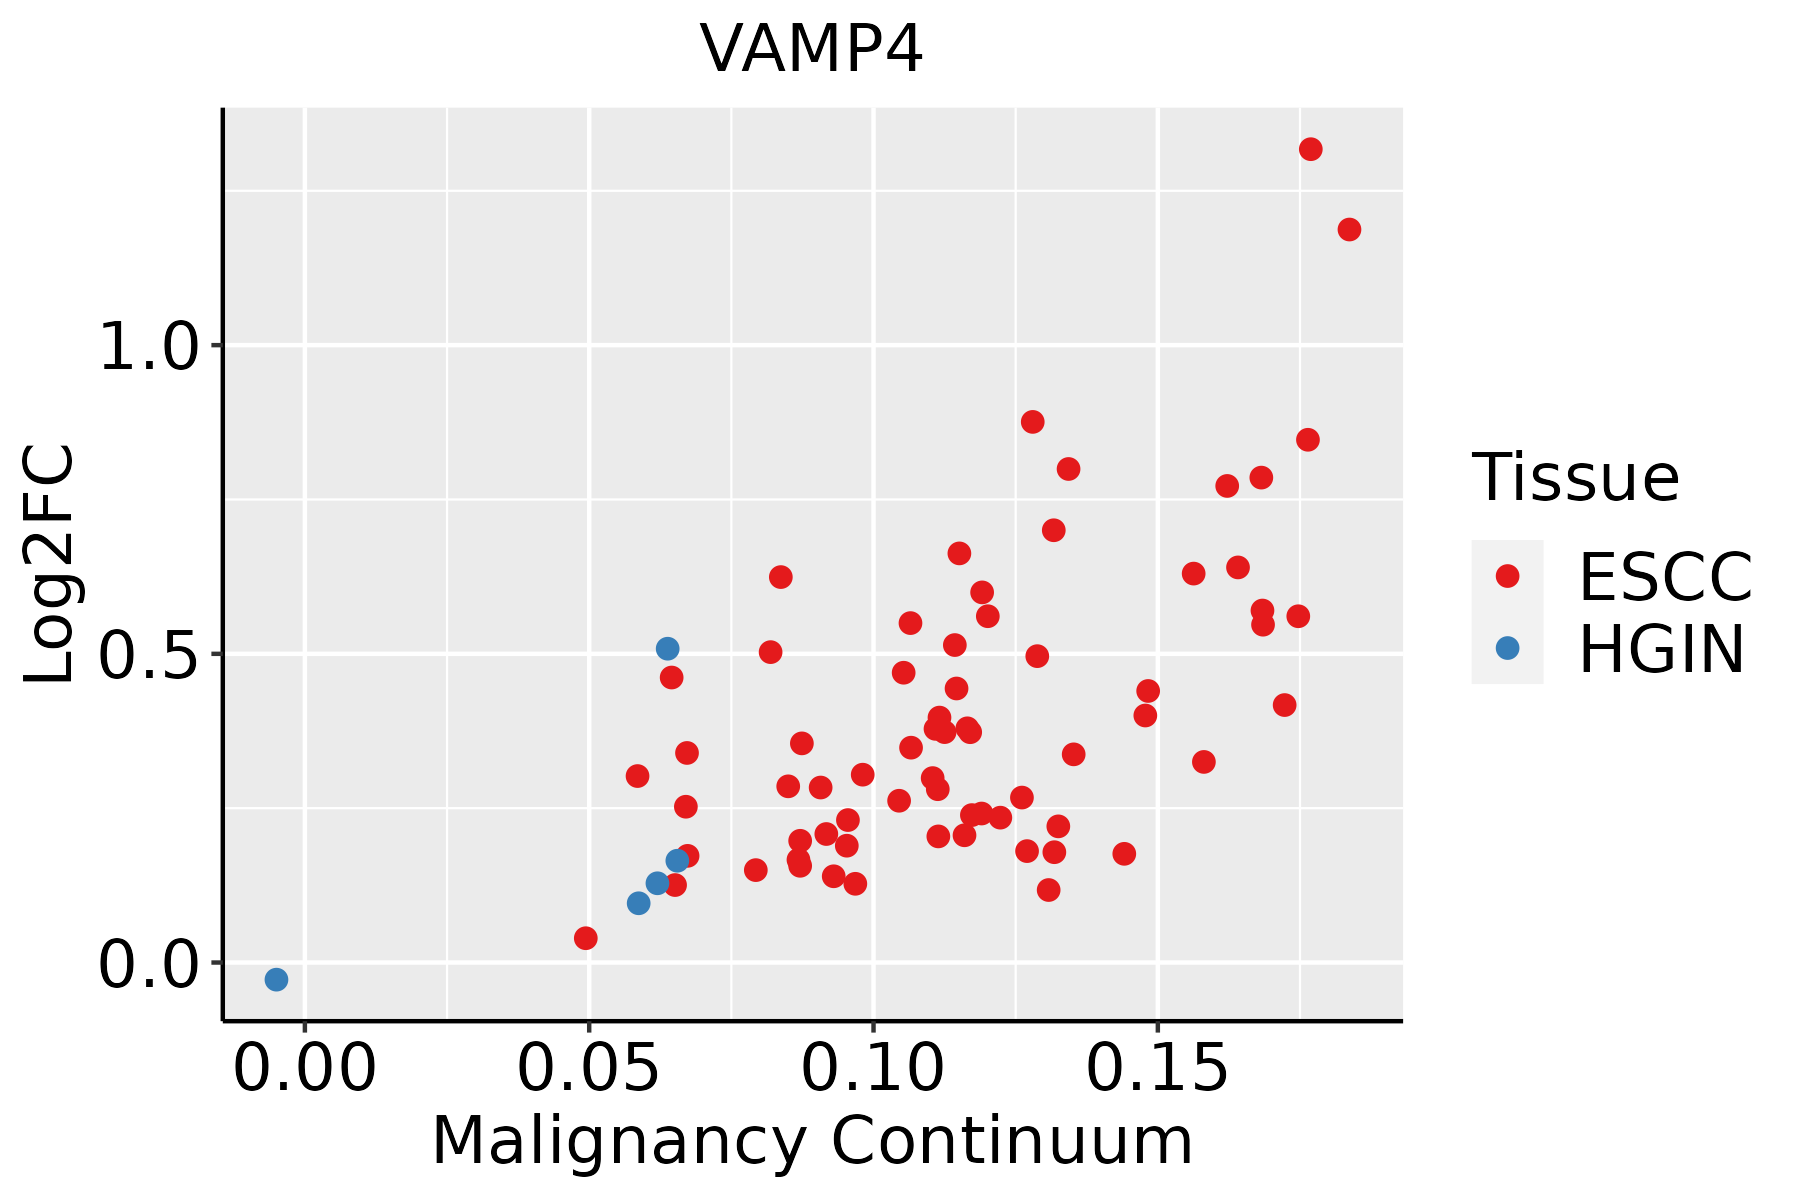 | ESCC: Esophageal squamous cell carcinoma |
| HGIN: High-grade intraepithelial neoplasias | ||
| LGIN: Low-grade intraepithelial neoplasias | ||
| Oral Cavity | 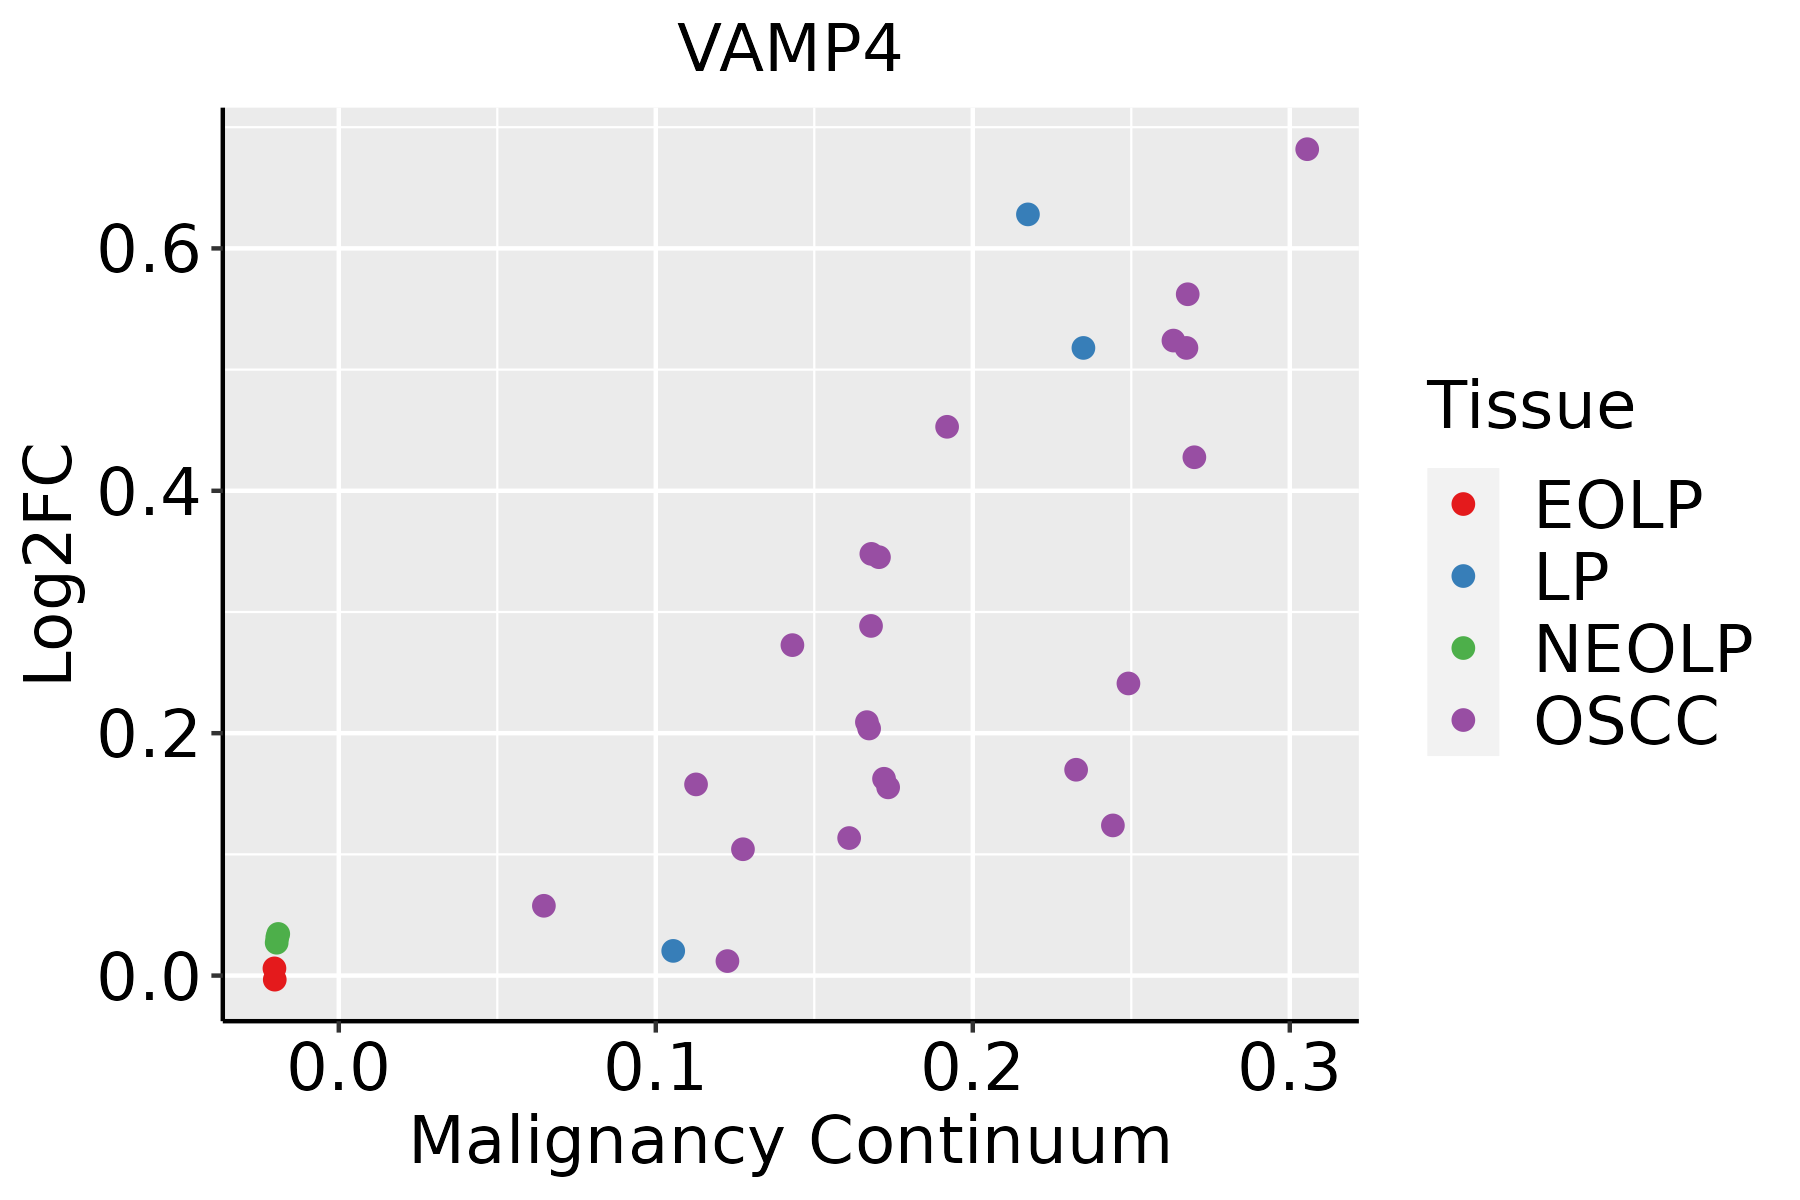 | EOLP: Erosive Oral lichen planus |
| LP: leukoplakia | ||
| NEOLP: Non-erosive oral lichen planus | ||
| OSCC: Oral squamous cell carcinoma | ||
| Thyroid |  | ATC: Anaplastic thyroid cancer |
| HT: Hashimoto's thyroiditis | ||
| PTC: Papillary thyroid cancer |
| ∗log2FC in expression of this searched gene in stem-like cells from each diseased tissue sample relative to stem-like cells in normal samples in each tissue plotted against the malignancy continuum. Samples are colored based on if they are from different disease stage. |
Top |
Malignant transformation related pathway analysis |
| Find out the enriched GO biological processes and KEGG pathways involved in transition from healthy to precancer to cancer |
| Tissue | Disease Stage | Enriched GO biological Processes |
| Colorectum | AD |  |
| Colorectum | SER |  |
| Colorectum | MSS |  |
| Colorectum | MSI-H |  |
| Colorectum | FAP |  |
| ∗Top 15 enriched GO BP terms are showed in the bar plot of each disease state in each tissue. Each row represents a significant GO biological process which is colored according to the -log10(p.adjust). |
| Page: 1 2 3 4 5 6 7 8 9 |
| GO ID | Tissue | Disease Stage | Description | Gene Ratio | Bg Ratio | pvalue | p.adjust | Count |
| GO:001619710 | Esophagus | HGIN | endosomal transport | 57/2587 | 230/18723 | 5.74e-06 | 1.81e-04 | 57 |
| GO:00070328 | Esophagus | HGIN | endosome organization | 25/2587 | 82/18723 | 7.45e-05 | 1.69e-03 | 25 |
| GO:00160509 | Esophagus | HGIN | vesicle organization | 65/2587 | 300/18723 | 1.24e-04 | 2.54e-03 | 65 |
| GO:001605014 | Esophagus | ESCC | vesicle organization | 211/8552 | 300/18723 | 2.85e-18 | 2.87e-16 | 211 |
| GO:001619715 | Esophagus | ESCC | endosomal transport | 168/8552 | 230/18723 | 2.28e-17 | 1.93e-15 | 168 |
| GO:003010018 | Esophagus | ESCC | regulation of endocytosis | 135/8552 | 211/18723 | 5.75e-08 | 1.02e-06 | 135 |
| GO:000703214 | Esophagus | ESCC | endosome organization | 61/8552 | 82/18723 | 1.13e-07 | 1.85e-06 | 61 |
| GO:00482844 | Esophagus | ESCC | organelle fusion | 94/8552 | 141/18723 | 3.72e-07 | 5.16e-06 | 94 |
| GO:00070308 | Esophagus | ESCC | Golgi organization | 101/8552 | 157/18723 | 1.78e-06 | 2.10e-05 | 101 |
| GO:00901743 | Esophagus | ESCC | organelle membrane fusion | 73/8552 | 110/18723 | 9.29e-06 | 8.88e-05 | 73 |
| GO:00069063 | Esophagus | ESCC | vesicle fusion | 70/8552 | 106/18723 | 1.82e-05 | 1.60e-04 | 70 |
| GO:00610254 | Esophagus | ESCC | membrane fusion | 98/8552 | 163/18723 | 1.39e-04 | 9.41e-04 | 98 |
| GO:00901614 | Esophagus | ESCC | Golgi ribbon formation | 11/8552 | 13/18723 | 4.76e-03 | 1.85e-02 | 11 |
| GO:00995324 | Esophagus | ESCC | synaptic vesicle endosomal processing | 9/8552 | 10/18723 | 5.09e-03 | 1.92e-02 | 9 |
| GO:00160508 | Oral cavity | OSCC | vesicle organization | 189/7305 | 300/18723 | 2.40e-17 | 2.14e-15 | 189 |
| GO:00161979 | Oral cavity | OSCC | endosomal transport | 141/7305 | 230/18723 | 5.40e-12 | 2.06e-10 | 141 |
| GO:00070327 | Oral cavity | OSCC | endosome organization | 59/7305 | 82/18723 | 1.41e-09 | 3.39e-08 | 59 |
| GO:003010016 | Oral cavity | OSCC | regulation of endocytosis | 121/7305 | 211/18723 | 4.74e-08 | 8.80e-07 | 121 |
| GO:00070307 | Oral cavity | OSCC | Golgi organization | 92/7305 | 157/18723 | 4.96e-07 | 7.27e-06 | 92 |
| GO:00482843 | Oral cavity | OSCC | organelle fusion | 82/7305 | 141/18723 | 3.08e-06 | 3.72e-05 | 82 |
| Page: 1 2 3 |
| Pathway ID | Tissue | Disease Stage | Description | Gene Ratio | Bg Ratio | pvalue | p.adjust | qvalue | Count |
| hsa041305 | Esophagus | ESCC | SNARE interactions in vesicular transport | 28/4205 | 33/8465 | 2.75e-05 | 1.32e-04 | 6.75e-05 | 28 |
| hsa0413012 | Esophagus | ESCC | SNARE interactions in vesicular transport | 28/4205 | 33/8465 | 2.75e-05 | 1.32e-04 | 6.75e-05 | 28 |
| hsa041304 | Oral cavity | OSCC | SNARE interactions in vesicular transport | 28/3704 | 33/8465 | 1.31e-06 | 7.18e-06 | 3.66e-06 | 28 |
| hsa0413011 | Oral cavity | OSCC | SNARE interactions in vesicular transport | 28/3704 | 33/8465 | 1.31e-06 | 7.18e-06 | 3.66e-06 | 28 |
| hsa0413021 | Oral cavity | LP | SNARE interactions in vesicular transport | 22/2418 | 33/8465 | 6.00e-06 | 4.76e-05 | 3.07e-05 | 22 |
| hsa0413031 | Oral cavity | LP | SNARE interactions in vesicular transport | 22/2418 | 33/8465 | 6.00e-06 | 4.76e-05 | 3.07e-05 | 22 |
| Page: 1 |
Top |
Cell-cell communication analysis |
| Identification of potential cell-cell interactions between two cell types and their ligand-receptor pairs for different disease states |
| Ligand | Receptor | LRpair | Pathway | Tissue | Disease Stage |
| Page: 1 |
Top |
Single-cell gene regulatory network inference analysis |
| Find out the significant the regulons (TFs) and the target genes of each regulon across cell types for different disease states |
| TF | Cell Type | Tissue | Disease Stage | Target Gene | RSS | Regulon Activity |
| ∗The dot plots of a searched regulon are shown for all cell subpopulations in each disease state of each tissue based on the regulon specific score inferred using pySCENIC and by calculating the average expression. |
| Page: 1 |
Top |
Somatic mutation of malignant transformation related genes |
| Annotation of somatic variants for genes involved in malignant transformation |
| Hugo Symbol | Variant Class | Variant Classification | dbSNP RS | HGVSc | HGVSp | HGVSp Short | SWISSPROT | BIOTYPE | SIFT | PolyPhen | Tumor Sample Barcode | Tissue | Histology | Sex | Age | Stage | Therapy Types | Drugs | Outcome |
| VAMP4 | SNV | Missense_Mutation | c.239G>T | p.Arg80Ile | p.R80I | O75379 | protein_coding | deleterious(0) | probably_damaging(0.942) | TCGA-AA-A00N-01 | Colorectum | colon adenocarcinoma | Male | >=65 | I/II | Unknown | Unknown | PD | |
| VAMP4 | SNV | Missense_Mutation | c.68G>T | p.Arg23Ile | p.R23I | O75379 | protein_coding | tolerated(0.05) | possibly_damaging(0.452) | TCGA-AA-A00N-01 | Colorectum | colon adenocarcinoma | Male | >=65 | I/II | Unknown | Unknown | PD | |
| VAMP4 | insertion | Frame_Shift_Ins | novel | c.111_112insT | p.Leu38SerfsTer12 | p.L38Sfs*12 | O75379 | protein_coding | TCGA-AZ-6598-01 | Colorectum | colon adenocarcinoma | Female | >=65 | I/II | Unknown | Unknown | SD | ||
| VAMP4 | SNV | Missense_Mutation | c.68N>T | p.Arg23Ile | p.R23I | O75379 | protein_coding | tolerated(0.05) | possibly_damaging(0.452) | TCGA-BS-A0UV-01 | Endometrium | uterine corpus endometrioid carcinoma | Female | <65 | III/IV | Unknown | Unknown | SD | |
| VAMP4 | SNV | Missense_Mutation | c.68N>T | p.Arg23Ile | p.R23I | O75379 | protein_coding | tolerated(0.05) | possibly_damaging(0.452) | TCGA-EO-A22U-01 | Endometrium | uterine corpus endometrioid carcinoma | Female | >=65 | I/II | Unknown | Unknown | SD | |
| VAMP4 | SNV | Missense_Mutation | rs535997142 | c.19N>T | p.Arg7Cys | p.R7C | O75379 | protein_coding | deleterious(0) | possibly_damaging(0.63) | TCGA-EO-A22U-01 | Endometrium | uterine corpus endometrioid carcinoma | Female | >=65 | I/II | Unknown | Unknown | SD |
| VAMP4 | SNV | Missense_Mutation | c.181G>T | p.Asp61Tyr | p.D61Y | O75379 | protein_coding | deleterious(0) | probably_damaging(0.996) | TCGA-44-5644-01 | Lung | lung adenocarcinoma | Female | <65 | I/II | Unknown | Unknown | SD | |
| VAMP4 | SNV | Missense_Mutation | c.175N>G | p.Gln59Glu | p.Q59E | O75379 | protein_coding | tolerated(0.09) | benign(0.111) | TCGA-49-6761-01 | Lung | lung adenocarcinoma | Female | >=65 | III/IV | Unknown | Unknown | SD | |
| VAMP4 | SNV | Missense_Mutation | c.4N>T | p.Pro2Ser | p.P2S | O75379 | protein_coding | deleterious(0) | probably_damaging(0.992) | TCGA-BR-6452-01 | Stomach | stomach adenocarcinoma | Female | >=65 | I/II | Unknown | Unknown | SD | |
| VAMP4 | insertion | In_Frame_Ins | novel | c.40_41insATG | p.Asp13dup | p.D13dup | O75379 | protein_coding | TCGA-D7-A6EY-01 | Stomach | stomach adenocarcinoma | Female | >=65 | III/IV | Unknown | Unknown | PD |
| Page: 1 |
Top |
Related drugs of malignant transformation related genes |
| Identification of chemicals and drugs interact with genes involved in malignant transfromation |
| (DGIdb 4.0) |
| Entrez ID | Symbol | Category | Interaction Types | Drug Claim Name | Drug Name | PMIDs |
| Page: 1 |

Copyright 2023-Present -The University of Texas Health Science Center at Houston |