
|
|||||
|
 | |
| |
| |
| |
| |
| |
|
Gene: VAC14 |
Gene summary for VAC14 |
| Gene information | Species | Human | Gene symbol | VAC14 | Gene ID | 55697 |
| Gene name | VAC14 component of PIKFYVE complex | |
| Gene Alias | ArPIKfyve | |
| Cytomap | 16q22.1-q22.2 | |
| Gene Type | protein-coding | GO ID | GO:0006629 | UniProtAcc | Q08AM6 |
Top |
Malignant transformation analysis |
| Identification of the aberrant gene expression in precancerous and cancerous lesions by comparing the gene expression of stem-like cells in diseased tissues with normal stem cells |
| Entrez ID | Symbol | Replicates | Species | Organ | Tissue | Adj P-value | Log2FC | Malignancy |
| 55697 | VAC14 | LZE4T | Human | Esophagus | ESCC | 1.71e-06 | 1.83e-01 | 0.0811 |
| 55697 | VAC14 | LZE20T | Human | Esophagus | ESCC | 8.42e-04 | 1.23e-01 | 0.0662 |
| 55697 | VAC14 | LZE22T | Human | Esophagus | ESCC | 6.32e-08 | 6.22e-01 | 0.068 |
| 55697 | VAC14 | LZE24T | Human | Esophagus | ESCC | 1.45e-14 | 3.49e-01 | 0.0596 |
| 55697 | VAC14 | LZE21T | Human | Esophagus | ESCC | 1.96e-02 | 3.36e-01 | 0.0655 |
| 55697 | VAC14 | P1T-E | Human | Esophagus | ESCC | 1.34e-06 | 3.01e-01 | 0.0875 |
| 55697 | VAC14 | P2T-E | Human | Esophagus | ESCC | 1.05e-13 | 1.32e-01 | 0.1177 |
| 55697 | VAC14 | P4T-E | Human | Esophagus | ESCC | 7.55e-12 | 2.62e-01 | 0.1323 |
| 55697 | VAC14 | P5T-E | Human | Esophagus | ESCC | 6.29e-06 | 1.48e-01 | 0.1327 |
| 55697 | VAC14 | P8T-E | Human | Esophagus | ESCC | 5.23e-16 | 2.71e-01 | 0.0889 |
| 55697 | VAC14 | P9T-E | Human | Esophagus | ESCC | 1.22e-06 | 1.32e-01 | 0.1131 |
| 55697 | VAC14 | P10T-E | Human | Esophagus | ESCC | 1.38e-07 | 1.24e-01 | 0.116 |
| 55697 | VAC14 | P11T-E | Human | Esophagus | ESCC | 4.97e-12 | 4.23e-01 | 0.1426 |
| 55697 | VAC14 | P12T-E | Human | Esophagus | ESCC | 7.64e-15 | 2.75e-01 | 0.1122 |
| 55697 | VAC14 | P15T-E | Human | Esophagus | ESCC | 2.22e-19 | 4.09e-01 | 0.1149 |
| 55697 | VAC14 | P16T-E | Human | Esophagus | ESCC | 8.65e-07 | 1.49e-01 | 0.1153 |
| 55697 | VAC14 | P17T-E | Human | Esophagus | ESCC | 1.84e-06 | 2.70e-01 | 0.1278 |
| 55697 | VAC14 | P19T-E | Human | Esophagus | ESCC | 8.86e-06 | 4.04e-01 | 0.1662 |
| 55697 | VAC14 | P20T-E | Human | Esophagus | ESCC | 4.06e-10 | 2.44e-01 | 0.1124 |
| 55697 | VAC14 | P21T-E | Human | Esophagus | ESCC | 4.95e-18 | 3.47e-01 | 0.1617 |
| Page: 1 2 3 4 5 |
| Tissue | Expression Dynamics | Abbreviation |
| Esophagus | 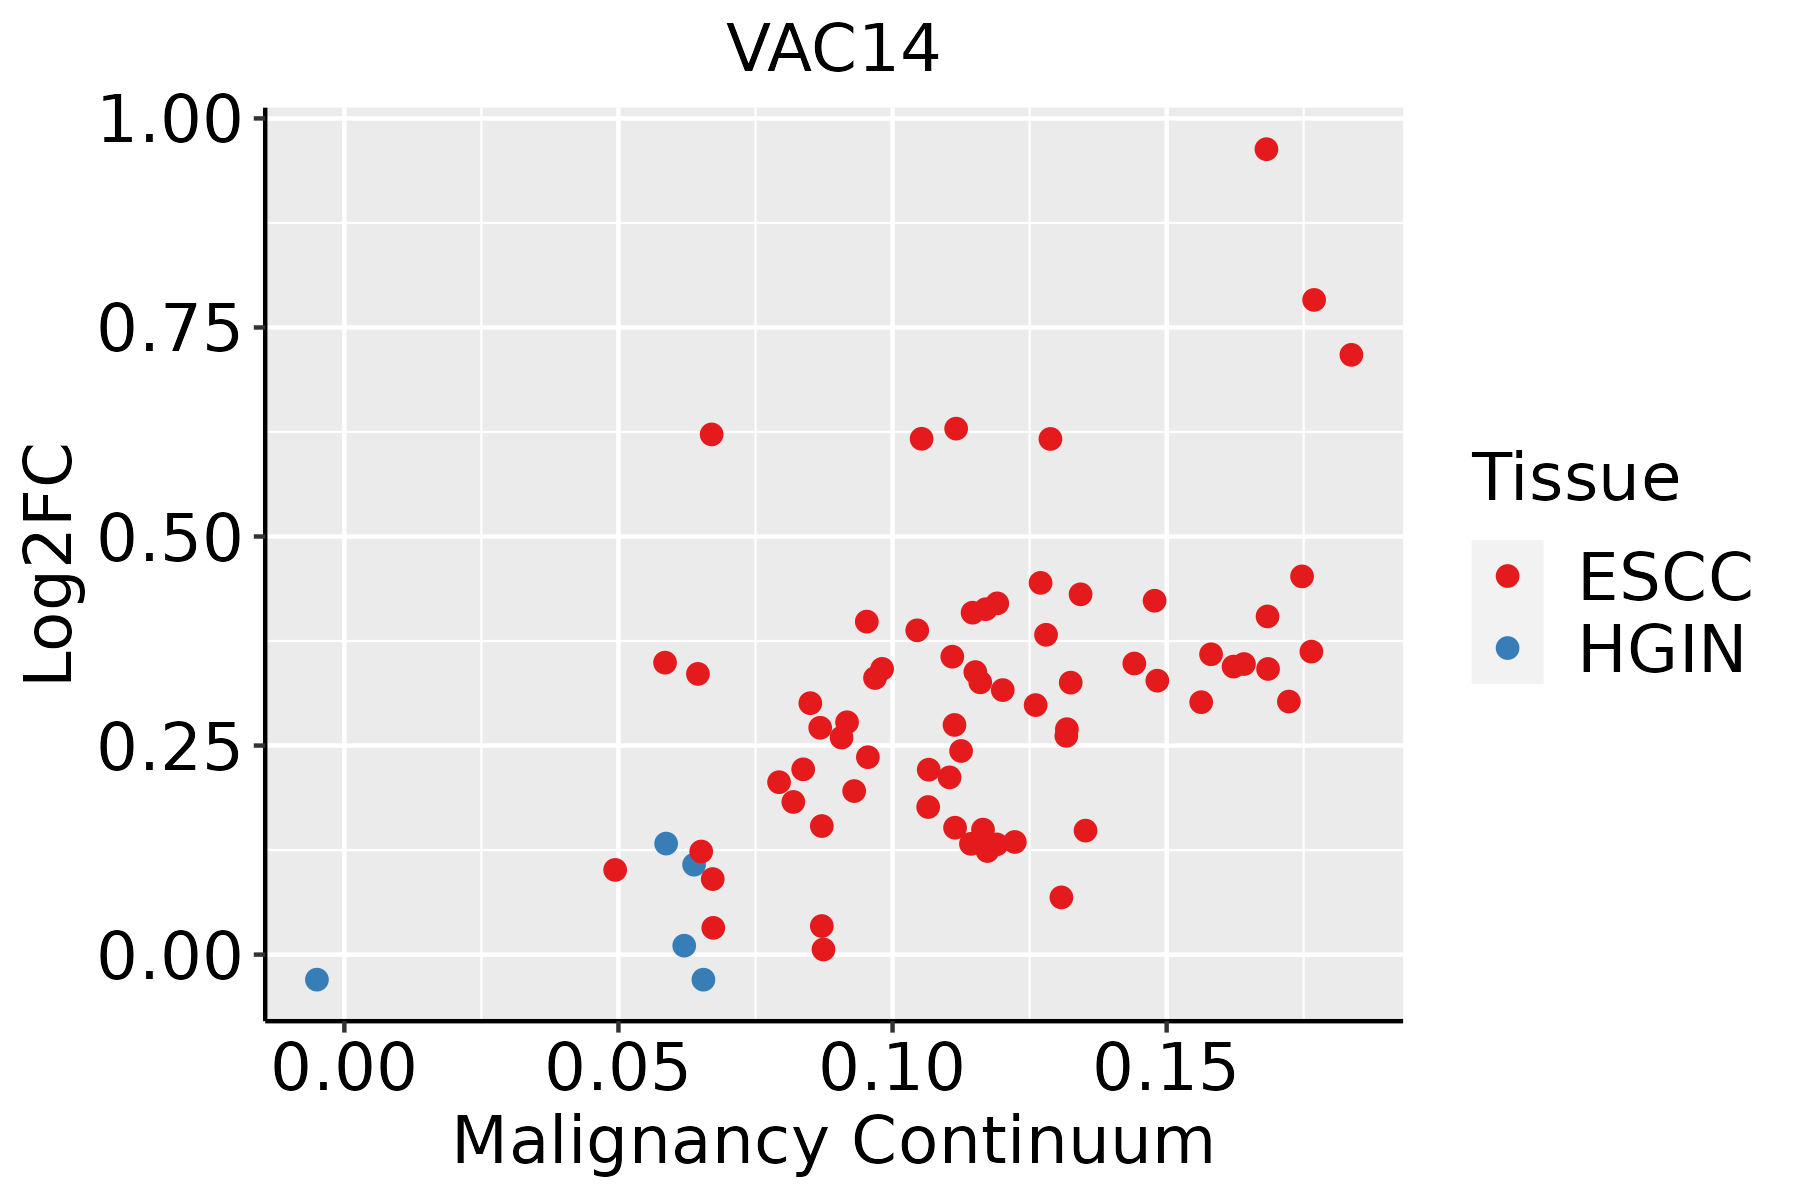 | ESCC: Esophageal squamous cell carcinoma |
| HGIN: High-grade intraepithelial neoplasias | ||
| LGIN: Low-grade intraepithelial neoplasias | ||
| Liver |  | HCC: Hepatocellular carcinoma |
| NAFLD: Non-alcoholic fatty liver disease | ||
| Oral Cavity | 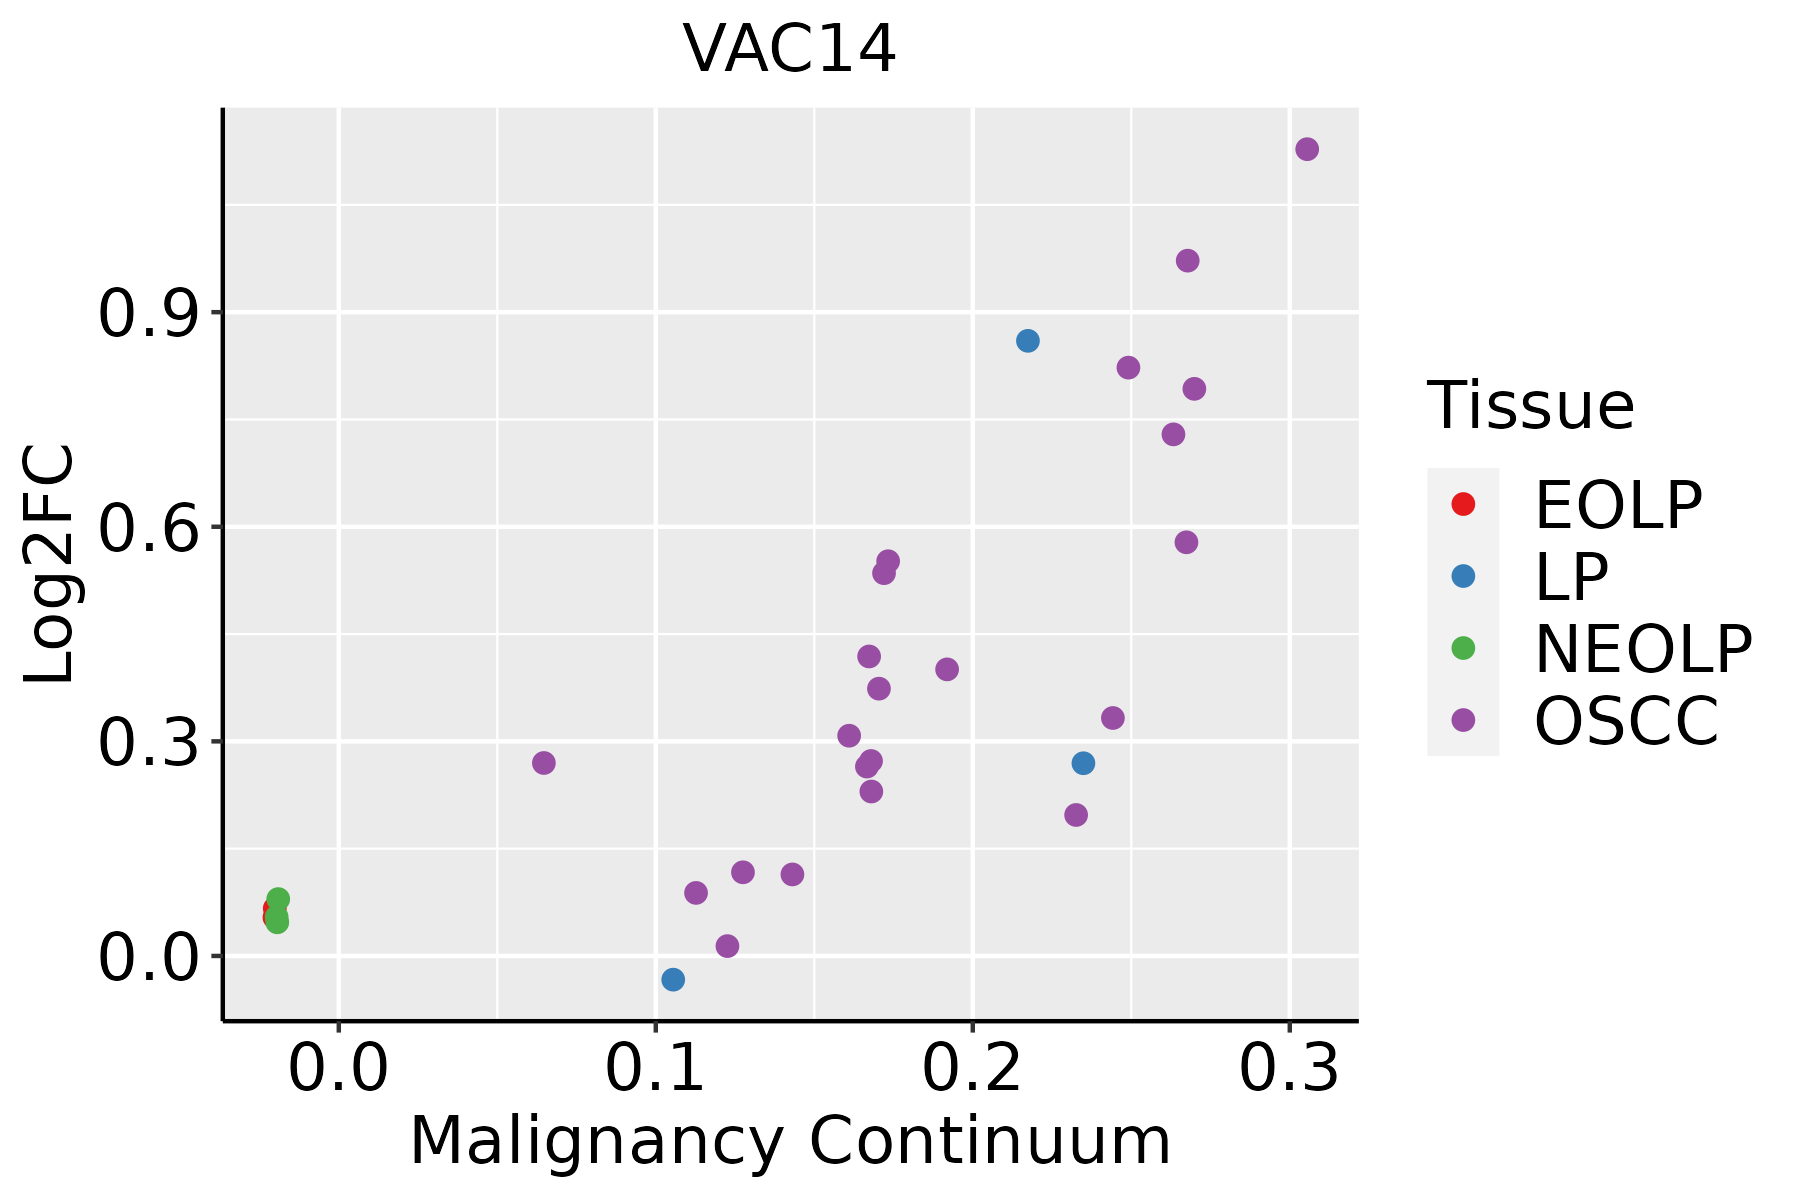 | EOLP: Erosive Oral lichen planus |
| LP: leukoplakia | ||
| NEOLP: Non-erosive oral lichen planus | ||
| OSCC: Oral squamous cell carcinoma |
| ∗log2FC in expression of this searched gene in stem-like cells from each diseased tissue sample relative to stem-like cells in normal samples in each tissue plotted against the malignancy continuum. Samples are colored based on if they are from different disease stage. |
Top |
Malignant transformation related pathway analysis |
| Find out the enriched GO biological processes and KEGG pathways involved in transition from healthy to precancer to cancer |
| Tissue | Disease Stage | Enriched GO biological Processes |
| Colorectum | AD |  |
| Colorectum | SER |  |
| Colorectum | MSS |  |
| Colorectum | MSI-H |  |
| Colorectum | FAP |  |
| ∗Top 15 enriched GO BP terms are showed in the bar plot of each disease state in each tissue. Each row represents a significant GO biological process which is colored according to the -log10(p.adjust). |
| Page: 1 2 3 4 5 6 7 8 9 |
| GO ID | Tissue | Disease Stage | Description | Gene Ratio | Bg Ratio | pvalue | p.adjust | Count |
| GO:00086544 | Esophagus | ESCC | phospholipid biosynthetic process | 162/8552 | 253/18723 | 2.59e-09 | 5.73e-08 | 162 |
| GO:00464744 | Esophagus | ESCC | glycerophospholipid biosynthetic process | 135/8552 | 211/18723 | 5.75e-08 | 1.02e-06 | 135 |
| GO:00450175 | Esophagus | ESCC | glycerolipid biosynthetic process | 154/8552 | 252/18723 | 5.20e-07 | 6.96e-06 | 154 |
| GO:00066446 | Esophagus | ESCC | phospholipid metabolic process | 218/8552 | 383/18723 | 5.37e-06 | 5.59e-05 | 218 |
| GO:003367420 | Esophagus | ESCC | positive regulation of kinase activity | 260/8552 | 467/18723 | 7.26e-06 | 7.22e-05 | 260 |
| GO:00066505 | Esophagus | ESCC | glycerophospholipid metabolic process | 174/8552 | 306/18723 | 4.92e-05 | 3.85e-04 | 174 |
| GO:00464864 | Esophagus | ESCC | glycerolipid metabolic process | 211/8552 | 392/18723 | 6.51e-04 | 3.46e-03 | 211 |
| GO:00066611 | Esophagus | ESCC | phosphatidylinositol biosynthetic process | 73/8552 | 131/18723 | 1.31e-02 | 4.28e-02 | 73 |
| GO:00464863 | Liver | NAFLD | glycerolipid metabolic process | 66/1882 | 392/18723 | 1.94e-05 | 5.52e-04 | 66 |
| GO:00336747 | Liver | NAFLD | positive regulation of kinase activity | 74/1882 | 467/18723 | 5.16e-05 | 1.19e-03 | 74 |
| GO:00450174 | Liver | NAFLD | glycerolipid biosynthetic process | 43/1882 | 252/18723 | 3.83e-04 | 5.73e-03 | 43 |
| GO:00464742 | Liver | NAFLD | glycerophospholipid biosynthetic process | 33/1882 | 211/18723 | 6.93e-03 | 4.88e-02 | 33 |
| GO:00086542 | Liver | HCC | phospholipid biosynthetic process | 150/7958 | 253/18723 | 4.77e-08 | 1.03e-06 | 150 |
| GO:00066444 | Liver | HCC | phospholipid metabolic process | 214/7958 | 383/18723 | 7.25e-08 | 1.48e-06 | 214 |
| GO:004648611 | Liver | HCC | glycerolipid metabolic process | 215/7958 | 392/18723 | 4.54e-07 | 7.49e-06 | 215 |
| GO:004501711 | Liver | HCC | glycerolipid biosynthetic process | 143/7958 | 252/18723 | 3.27e-06 | 4.31e-05 | 143 |
| GO:00066504 | Liver | HCC | glycerophospholipid metabolic process | 168/7958 | 306/18723 | 7.27e-06 | 8.62e-05 | 168 |
| GO:004647411 | Liver | HCC | glycerophospholipid biosynthetic process | 121/7958 | 211/18723 | 9.12e-06 | 1.06e-04 | 121 |
| GO:003367411 | Liver | HCC | positive regulation of kinase activity | 230/7958 | 467/18723 | 1.72e-03 | 8.95e-03 | 230 |
| GO:0006661 | Liver | HCC | phosphatidylinositol biosynthetic process | 69/7958 | 131/18723 | 1.19e-02 | 4.35e-02 | 69 |
| Page: 1 2 |
| Pathway ID | Tissue | Disease Stage | Description | Gene Ratio | Bg Ratio | pvalue | p.adjust | qvalue | Count |
| hsa05166211 | Esophagus | ESCC | Human T-cell leukemia virus 1 infection | 164/4205 | 222/8465 | 8.13e-14 | 2.09e-12 | 1.07e-12 | 164 |
| hsa0520325 | Esophagus | ESCC | Viral carcinogenesis | 137/4205 | 204/8465 | 2.47e-07 | 1.88e-06 | 9.62e-07 | 137 |
| hsa05166310 | Esophagus | ESCC | Human T-cell leukemia virus 1 infection | 164/4205 | 222/8465 | 8.13e-14 | 2.09e-12 | 1.07e-12 | 164 |
| hsa0520335 | Esophagus | ESCC | Viral carcinogenesis | 137/4205 | 204/8465 | 2.47e-07 | 1.88e-06 | 9.62e-07 | 137 |
| hsa0516622 | Liver | HCC | Human T-cell leukemia virus 1 infection | 139/4020 | 222/8465 | 3.17e-06 | 2.79e-05 | 1.55e-05 | 139 |
| hsa052032 | Liver | HCC | Viral carcinogenesis | 117/4020 | 204/8465 | 2.68e-03 | 8.98e-03 | 5.00e-03 | 117 |
| hsa0516632 | Liver | HCC | Human T-cell leukemia virus 1 infection | 139/4020 | 222/8465 | 3.17e-06 | 2.79e-05 | 1.55e-05 | 139 |
| hsa052033 | Liver | HCC | Viral carcinogenesis | 117/4020 | 204/8465 | 2.68e-03 | 8.98e-03 | 5.00e-03 | 117 |
| hsa0516630 | Oral cavity | OSCC | Human T-cell leukemia virus 1 infection | 150/3704 | 222/8465 | 3.68e-13 | 7.26e-12 | 3.70e-12 | 150 |
| hsa052038 | Oral cavity | OSCC | Viral carcinogenesis | 124/3704 | 204/8465 | 5.57e-07 | 3.28e-06 | 1.67e-06 | 124 |
| hsa05166113 | Oral cavity | OSCC | Human T-cell leukemia virus 1 infection | 150/3704 | 222/8465 | 3.68e-13 | 7.26e-12 | 3.70e-12 | 150 |
| hsa0520314 | Oral cavity | OSCC | Viral carcinogenesis | 124/3704 | 204/8465 | 5.57e-07 | 3.28e-06 | 1.67e-06 | 124 |
| hsa05166210 | Oral cavity | LP | Human T-cell leukemia virus 1 infection | 100/2418 | 222/8465 | 8.94e-08 | 1.29e-06 | 8.35e-07 | 100 |
| hsa0520324 | Oral cavity | LP | Viral carcinogenesis | 90/2418 | 204/8465 | 1.20e-06 | 1.38e-05 | 8.89e-06 | 90 |
| hsa0516638 | Oral cavity | LP | Human T-cell leukemia virus 1 infection | 100/2418 | 222/8465 | 8.94e-08 | 1.29e-06 | 8.35e-07 | 100 |
| hsa0520334 | Oral cavity | LP | Viral carcinogenesis | 90/2418 | 204/8465 | 1.20e-06 | 1.38e-05 | 8.89e-06 | 90 |
| Page: 1 |
Top |
Cell-cell communication analysis |
| Identification of potential cell-cell interactions between two cell types and their ligand-receptor pairs for different disease states |
| Ligand | Receptor | LRpair | Pathway | Tissue | Disease Stage |
| Page: 1 |
Top |
Single-cell gene regulatory network inference analysis |
| Find out the significant the regulons (TFs) and the target genes of each regulon across cell types for different disease states |
| TF | Cell Type | Tissue | Disease Stage | Target Gene | RSS | Regulon Activity |
| ∗The dot plots of a searched regulon are shown for all cell subpopulations in each disease state of each tissue based on the regulon specific score inferred using pySCENIC and by calculating the average expression. |
| Page: 1 |
Top |
Somatic mutation of malignant transformation related genes |
| Annotation of somatic variants for genes involved in malignant transformation |
| Hugo Symbol | Variant Class | Variant Classification | dbSNP RS | HGVSc | HGVSp | HGVSp Short | SWISSPROT | BIOTYPE | SIFT | PolyPhen | Tumor Sample Barcode | Tissue | Histology | Sex | Age | Stage | Therapy Types | Drugs | Outcome |
| VAC14 | SNV | Missense_Mutation | c.1171N>A | p.Ala391Thr | p.A391T | Q08AM6 | protein_coding | tolerated(0.56) | benign(0.003) | TCGA-A2-A04P-01 | Breast | breast invasive carcinoma | Female | <65 | III/IV | Chemotherapy | taxol | PD | |
| VAC14 | SNV | Missense_Mutation | c.523A>C | p.Ser175Arg | p.S175R | Q08AM6 | protein_coding | tolerated(0.11) | benign(0.282) | TCGA-BH-A0BL-01 | Breast | breast invasive carcinoma | Female | <65 | I/II | Chemotherapy | adriamycin | CR | |
| VAC14 | SNV | Missense_Mutation | c.1529N>C | p.Gly510Ala | p.G510A | Q08AM6 | protein_coding | tolerated(0.18) | benign(0) | TCGA-GM-A2D9-01 | Breast | breast invasive carcinoma | Female | >=65 | I/II | Hormone Therapy | arimidex | SD | |
| VAC14 | SNV | Missense_Mutation | c.705G>A | p.Met235Ile | p.M235I | Q08AM6 | protein_coding | tolerated(0.07) | benign(0.012) | TCGA-GM-A2DK-01 | Breast | breast invasive carcinoma | Female | <65 | I/II | Hormone Therapy | arimidex | CR | |
| VAC14 | insertion | Frame_Shift_Ins | novel | c.1184_1185insGGTACAGTGCA | p.His396ValfsTer13 | p.H396Vfs*13 | Q08AM6 | protein_coding | TCGA-AN-A0AM-01 | Breast | breast invasive carcinoma | Female | <65 | I/II | Unknown | Unknown | SD | ||
| VAC14 | insertion | In_Frame_Ins | novel | c.624_625insGAC | p.Ile208_Asn209insAsp | p.I208_N209insD | Q08AM6 | protein_coding | TCGA-AO-A0JE-01 | Breast | breast invasive carcinoma | Female | <65 | III/IV | Chemotherapy | doxorubicin | SD | ||
| VAC14 | insertion | Frame_Shift_Ins | novel | c.623_624insCAACCCCCAGCATCTGAAAATGATCACC | p.Leu210ProfsTer9 | p.L210Pfs*9 | Q08AM6 | protein_coding | TCGA-AO-A0JE-01 | Breast | breast invasive carcinoma | Female | <65 | III/IV | Chemotherapy | doxorubicin | SD | ||
| VAC14 | deletion | Frame_Shift_Del | novel | c.227delT | p.Leu76ArgfsTer16 | p.L76Rfs*16 | Q08AM6 | protein_coding | TCGA-D8-A27V-01 | Breast | breast invasive carcinoma | Female | <65 | I/II | Hormone Therapy | tamoxiphen | SD | ||
| VAC14 | SNV | Missense_Mutation | c.1645N>A | p.Gly549Ser | p.G549S | Q08AM6 | protein_coding | tolerated(0.08) | possibly_damaging(0.896) | TCGA-FU-A3YQ-01 | Cervix | cervical & endocervical cancer | Female | <65 | I/II | Unknown | Unknown | SD | |
| VAC14 | SNV | Missense_Mutation | c.2086G>C | p.Ala696Pro | p.A696P | Q08AM6 | protein_coding | deleterious(0.04) | probably_damaging(0.989) | TCGA-IR-A3LB-01 | Cervix | cervical & endocervical cancer | Female | <65 | I/II | Chemotherapy | cisplatin | PD |
| Page: 1 2 3 4 5 6 7 8 |
Top |
Related drugs of malignant transformation related genes |
| Identification of chemicals and drugs interact with genes involved in malignant transfromation |
| (DGIdb 4.0) |
| Entrez ID | Symbol | Category | Interaction Types | Drug Claim Name | Drug Name | PMIDs |
| 55697 | VAC14 | KINASE | docetaxel | DOCETAXEL |
| Page: 1 |

Copyright 2023-Present -The University of Texas Health Science Center at Houston |