| Tissue | Expression Dynamics | Abbreviation |
| Breast | 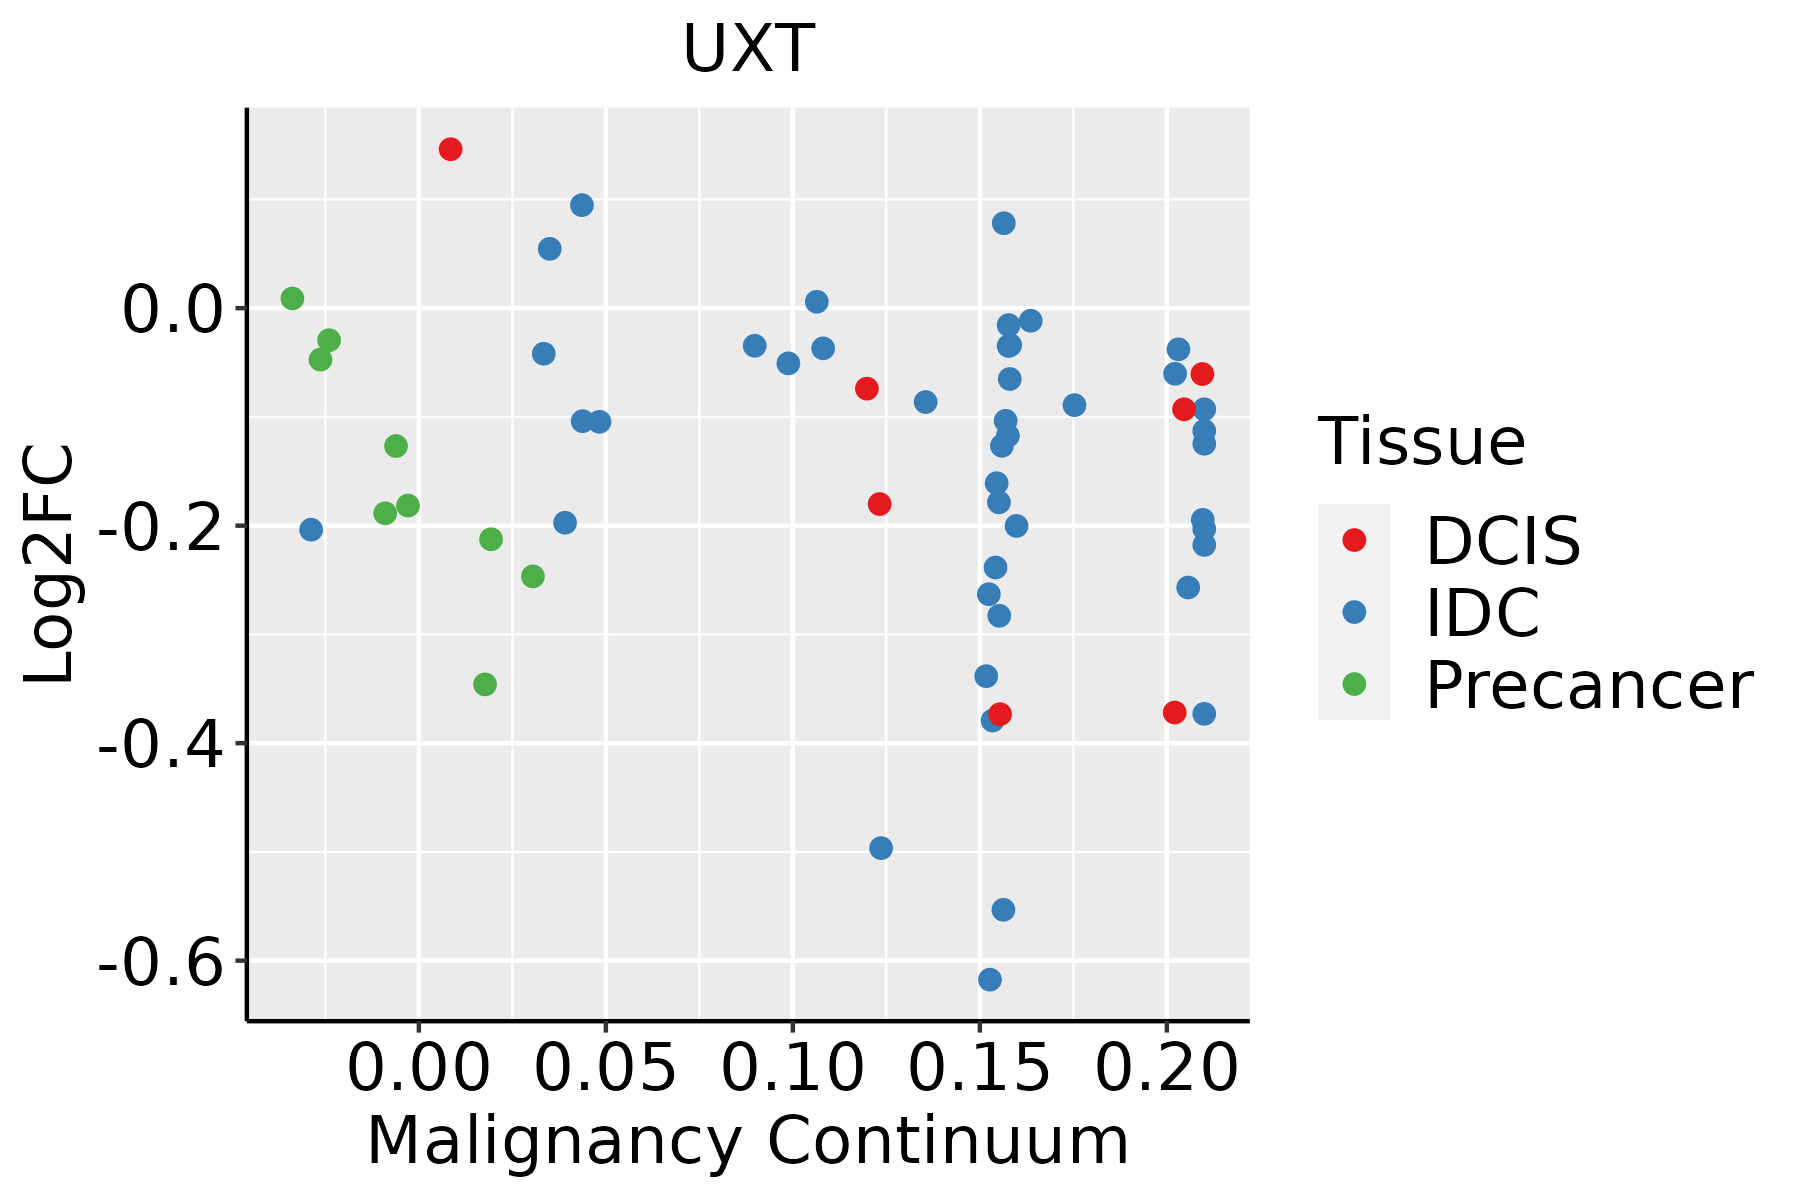 | IDC: Invasive ductal carcinoma |
| DCIS: Ductal carcinoma in situ |
| Precancer(BRCA1-mut): Precancerous lesion from BRCA1 mutation carriers |
| Cervix | 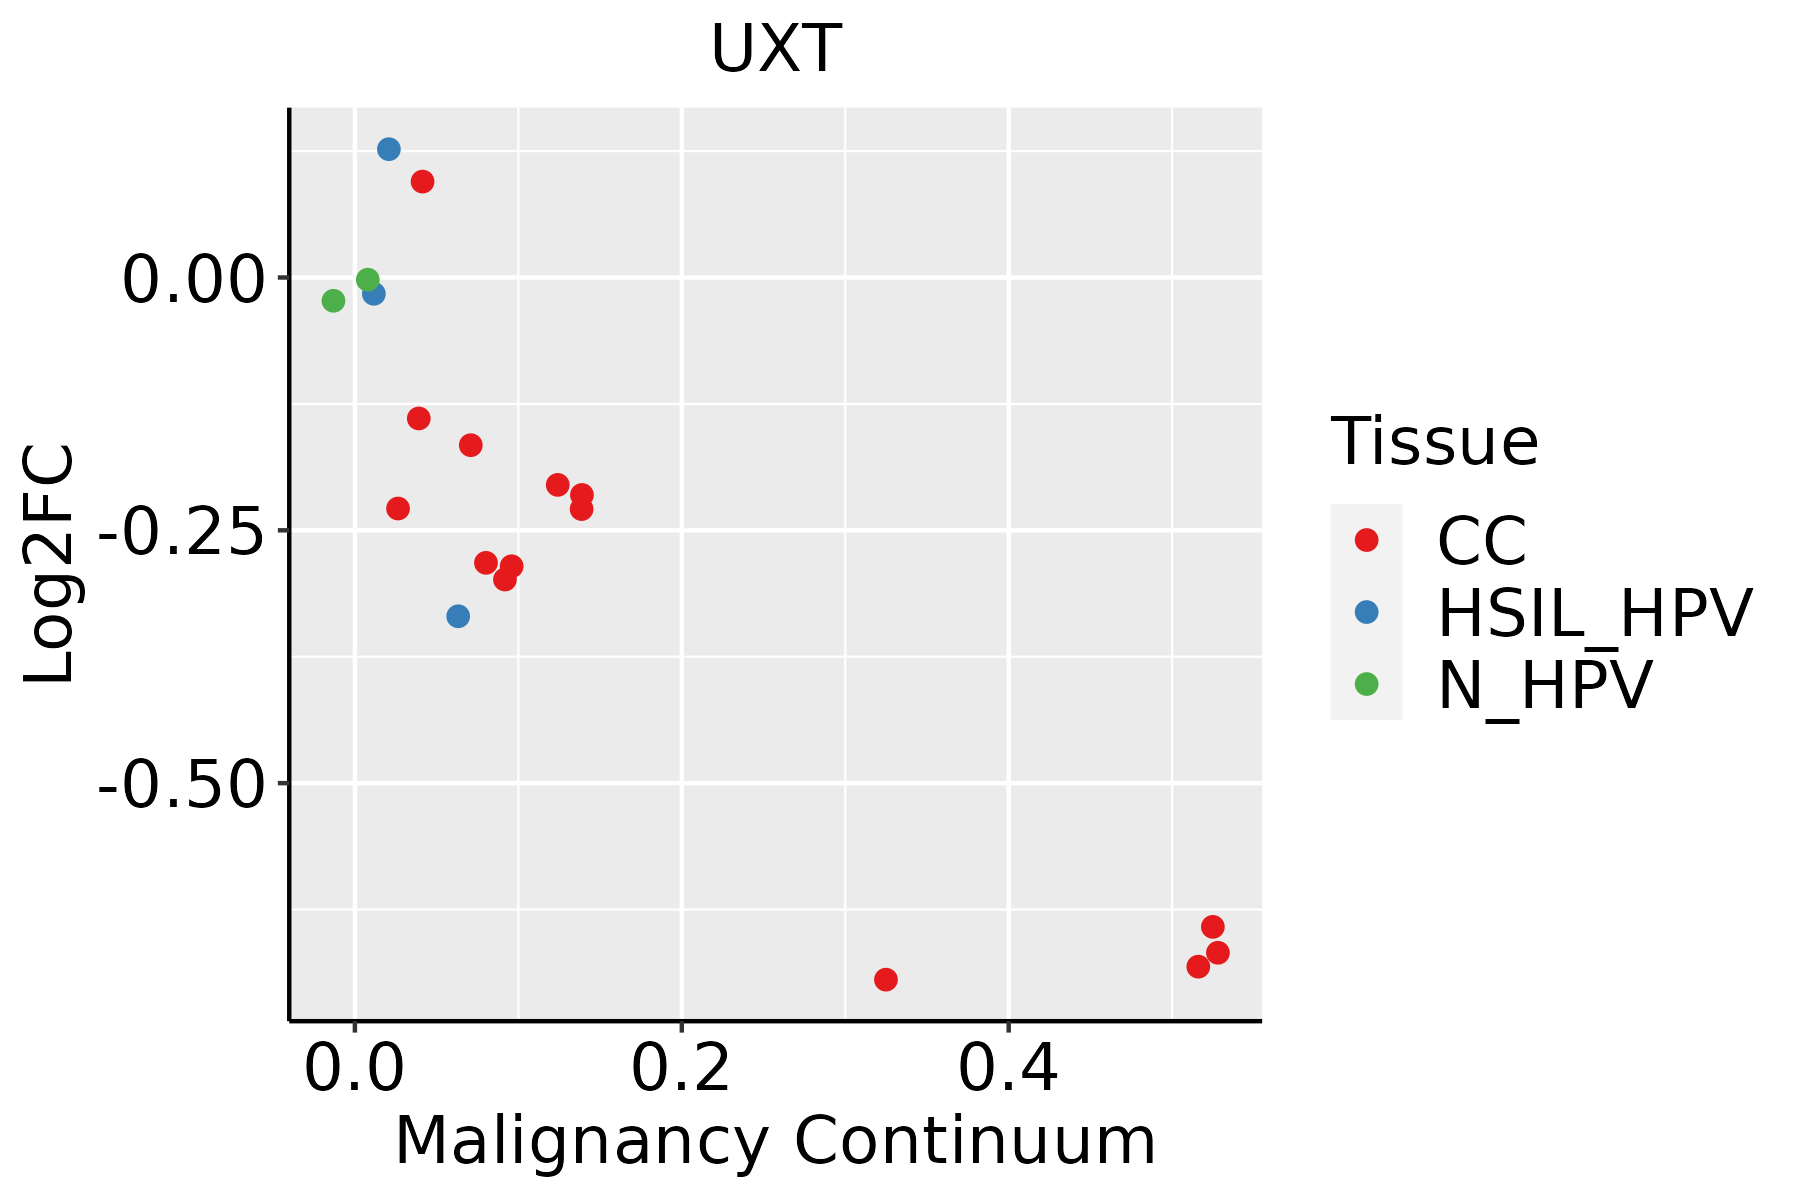 | CC: Cervix cancer |
| HSIL_HPV: HPV-infected high-grade squamous intraepithelial lesions |
| N_HPV: HPV-infected normal cervix |
| Colorectum (GSE201348) |  | FAP: Familial adenomatous polyposis |
| CRC: Colorectal cancer |
| Colorectum (HTA11) |  | AD: Adenomas |
| SER: Sessile serrated lesions |
| MSI-H: Microsatellite-high colorectal cancer |
| MSS: Microsatellite stable colorectal cancer |
| Endometrium | 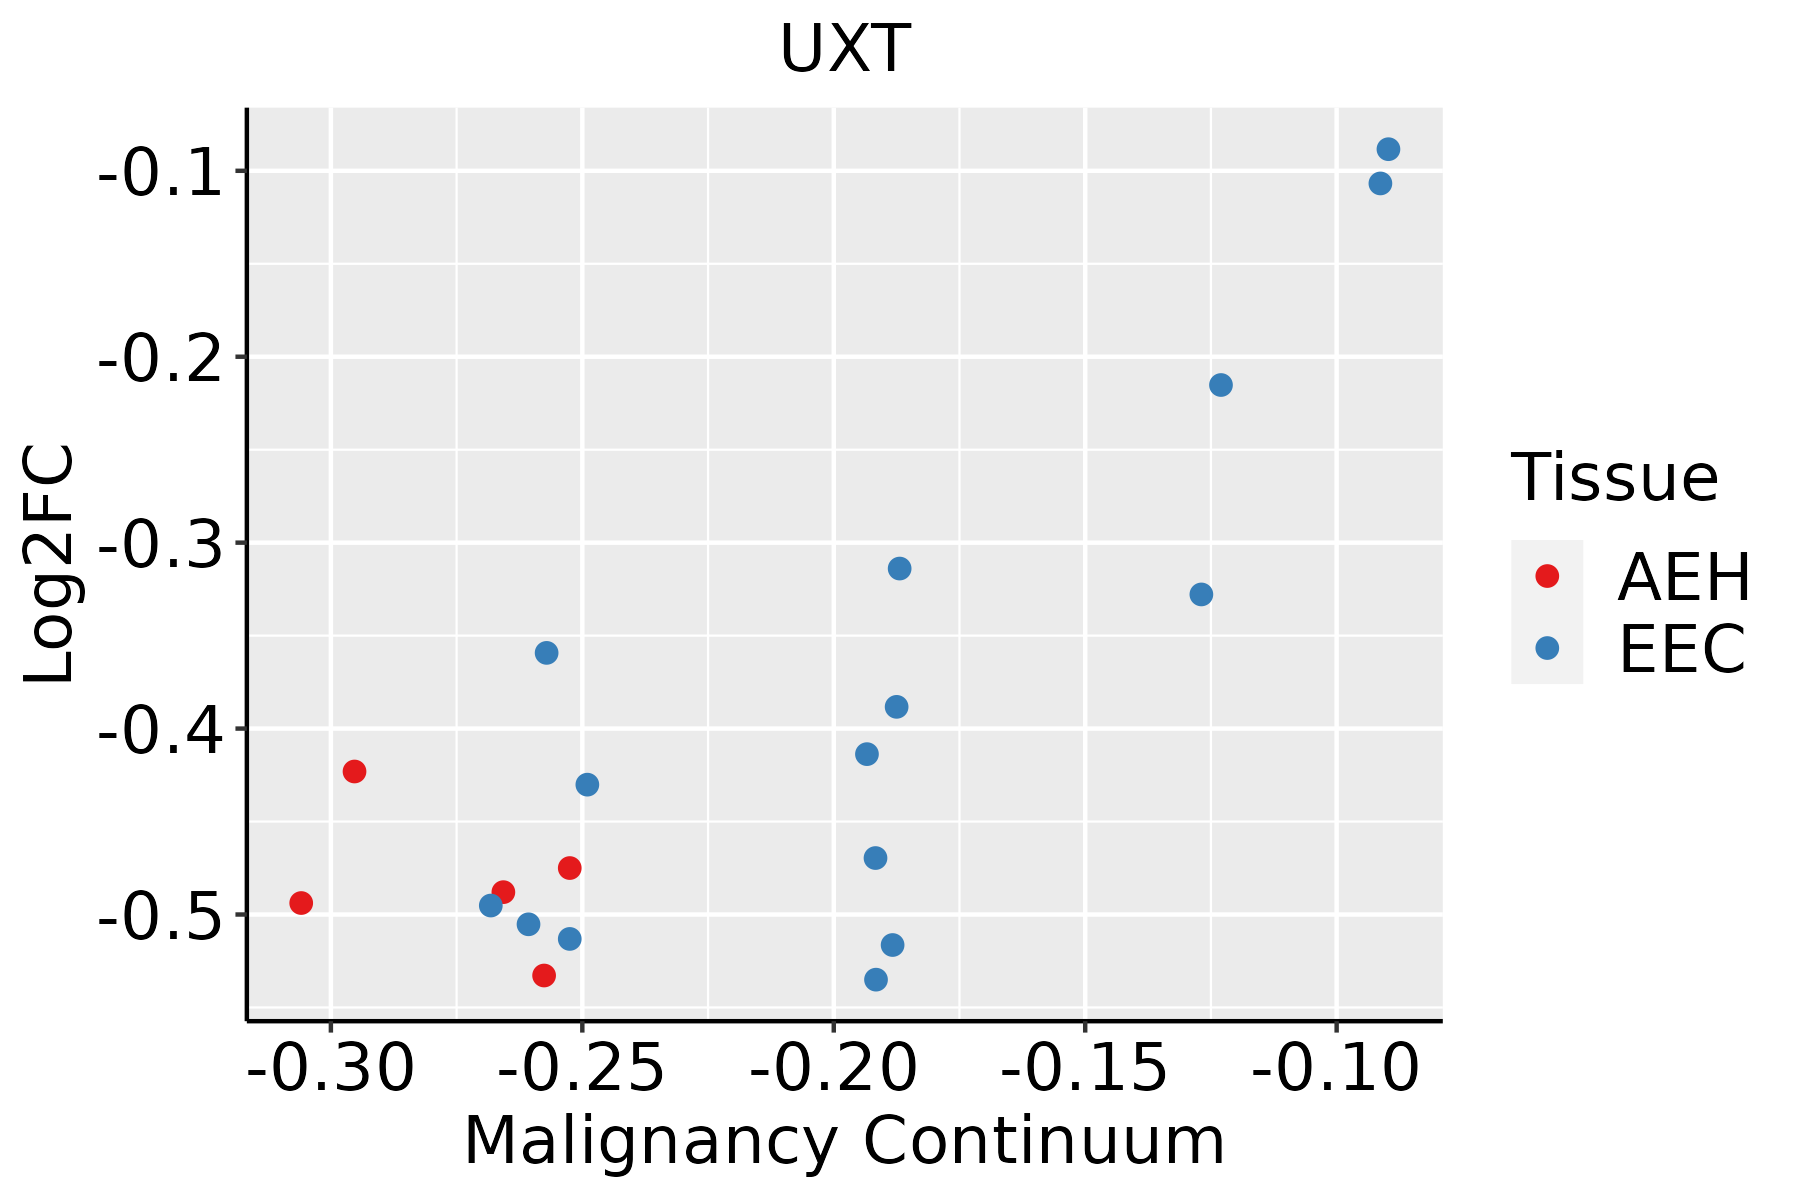 | AEH: Atypical endometrial hyperplasia |
| EEC: Endometrioid Cancer |
| Esophagus | 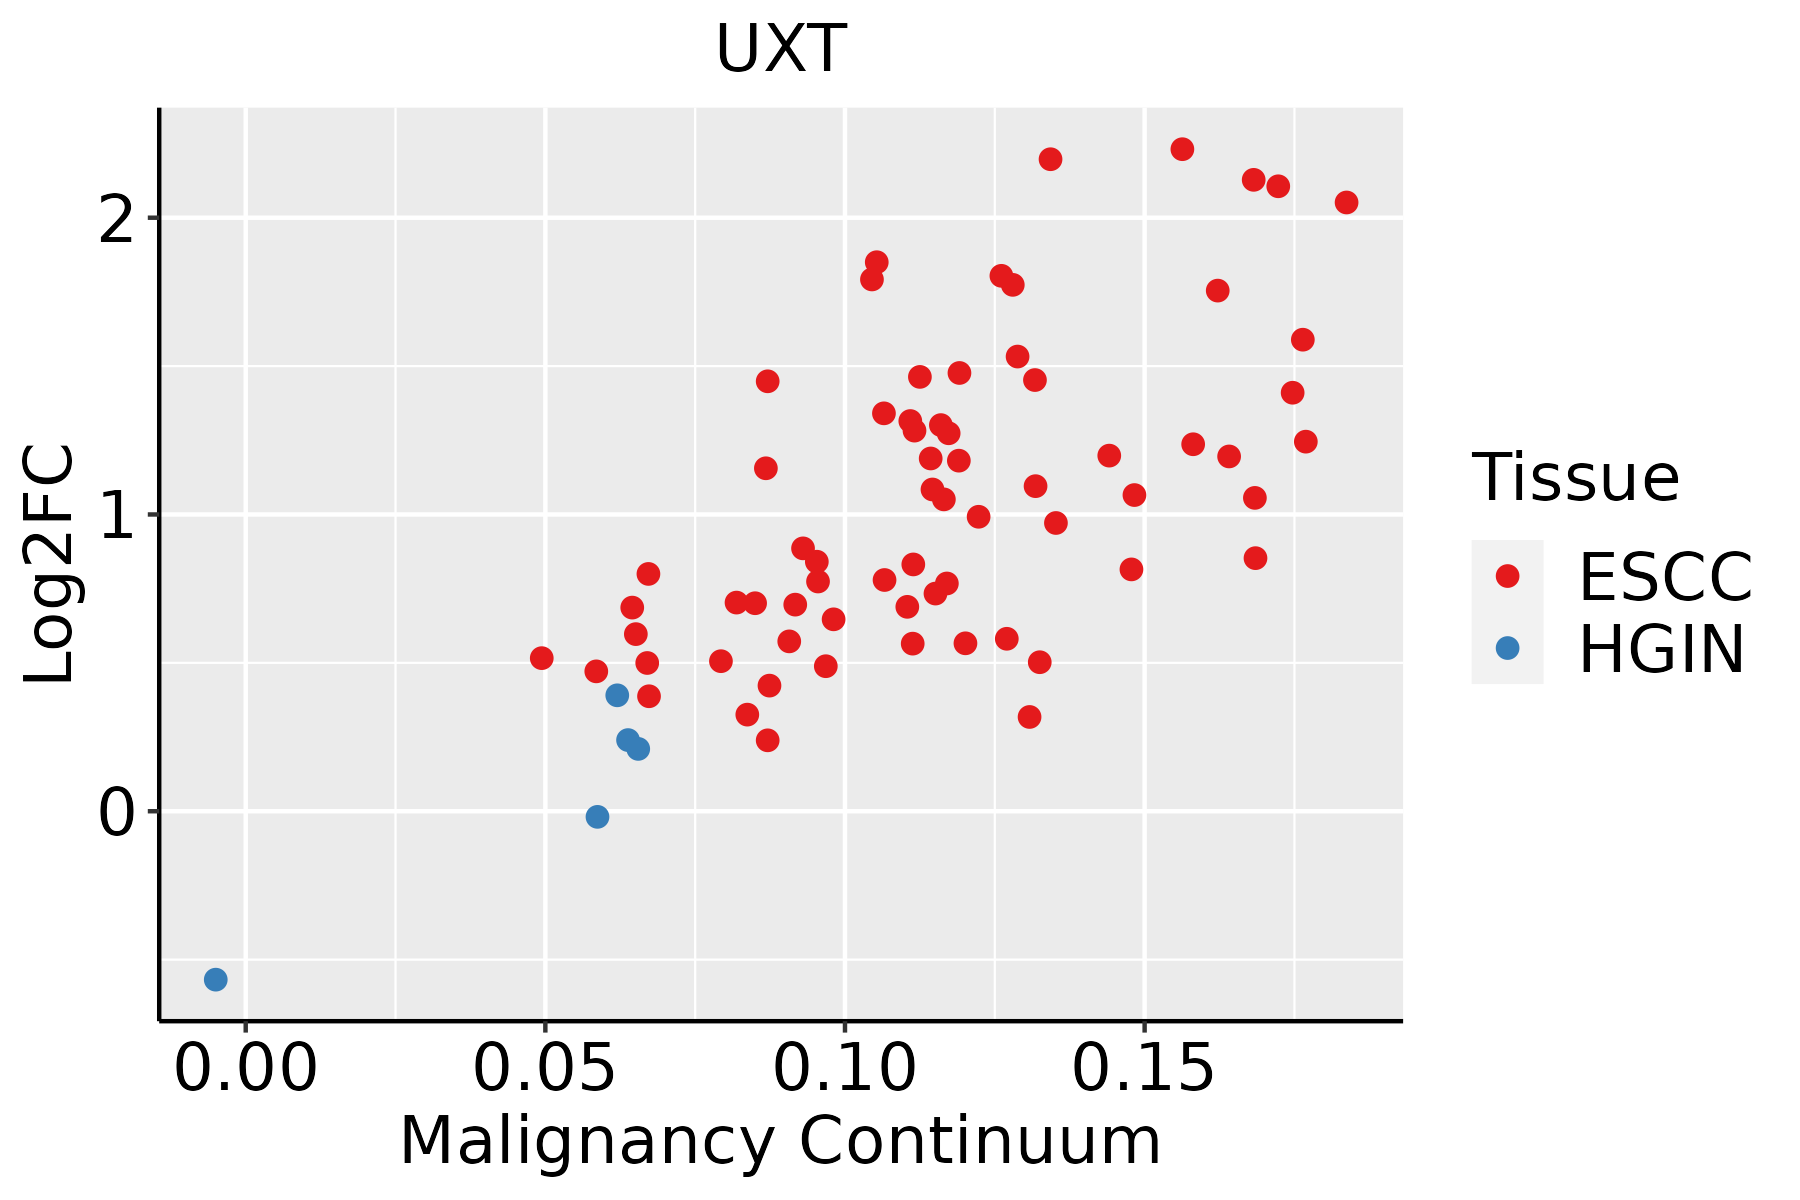 | ESCC: Esophageal squamous cell carcinoma |
| HGIN: High-grade intraepithelial neoplasias |
| LGIN: Low-grade intraepithelial neoplasias |
| GC | 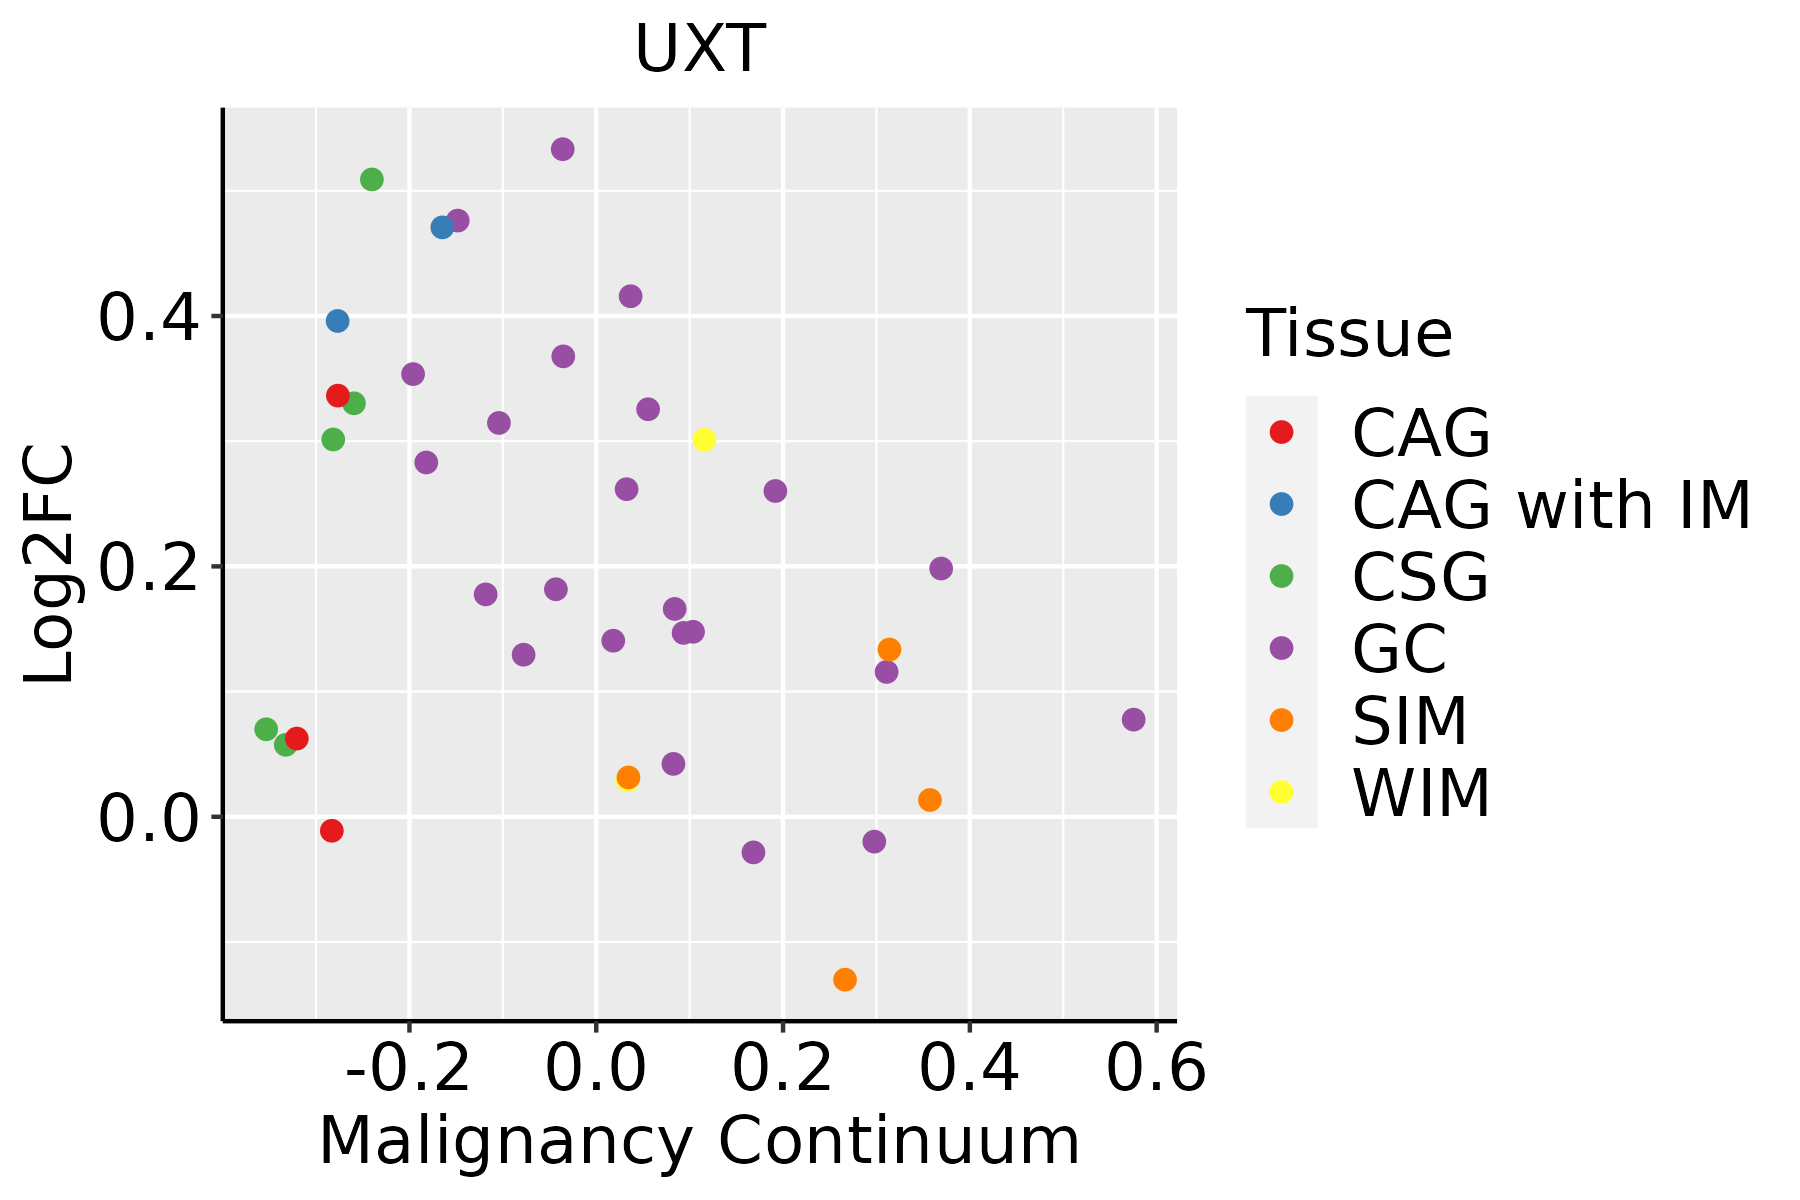 | CAG: Chronic atrophic gastritis |
| CAG with IM: Chronic atrophic gastritis with intestinal metaplasia |
| CSG: Chronic superficial gastritis |
| GC: Gastric cancer |
| SIM: Severe intestinal metaplasia |
| WIM: Wild intestinal metaplasia |
| Liver |  | HCC: Hepatocellular carcinoma |
| NAFLD: Non-alcoholic fatty liver disease |
| Oral Cavity | 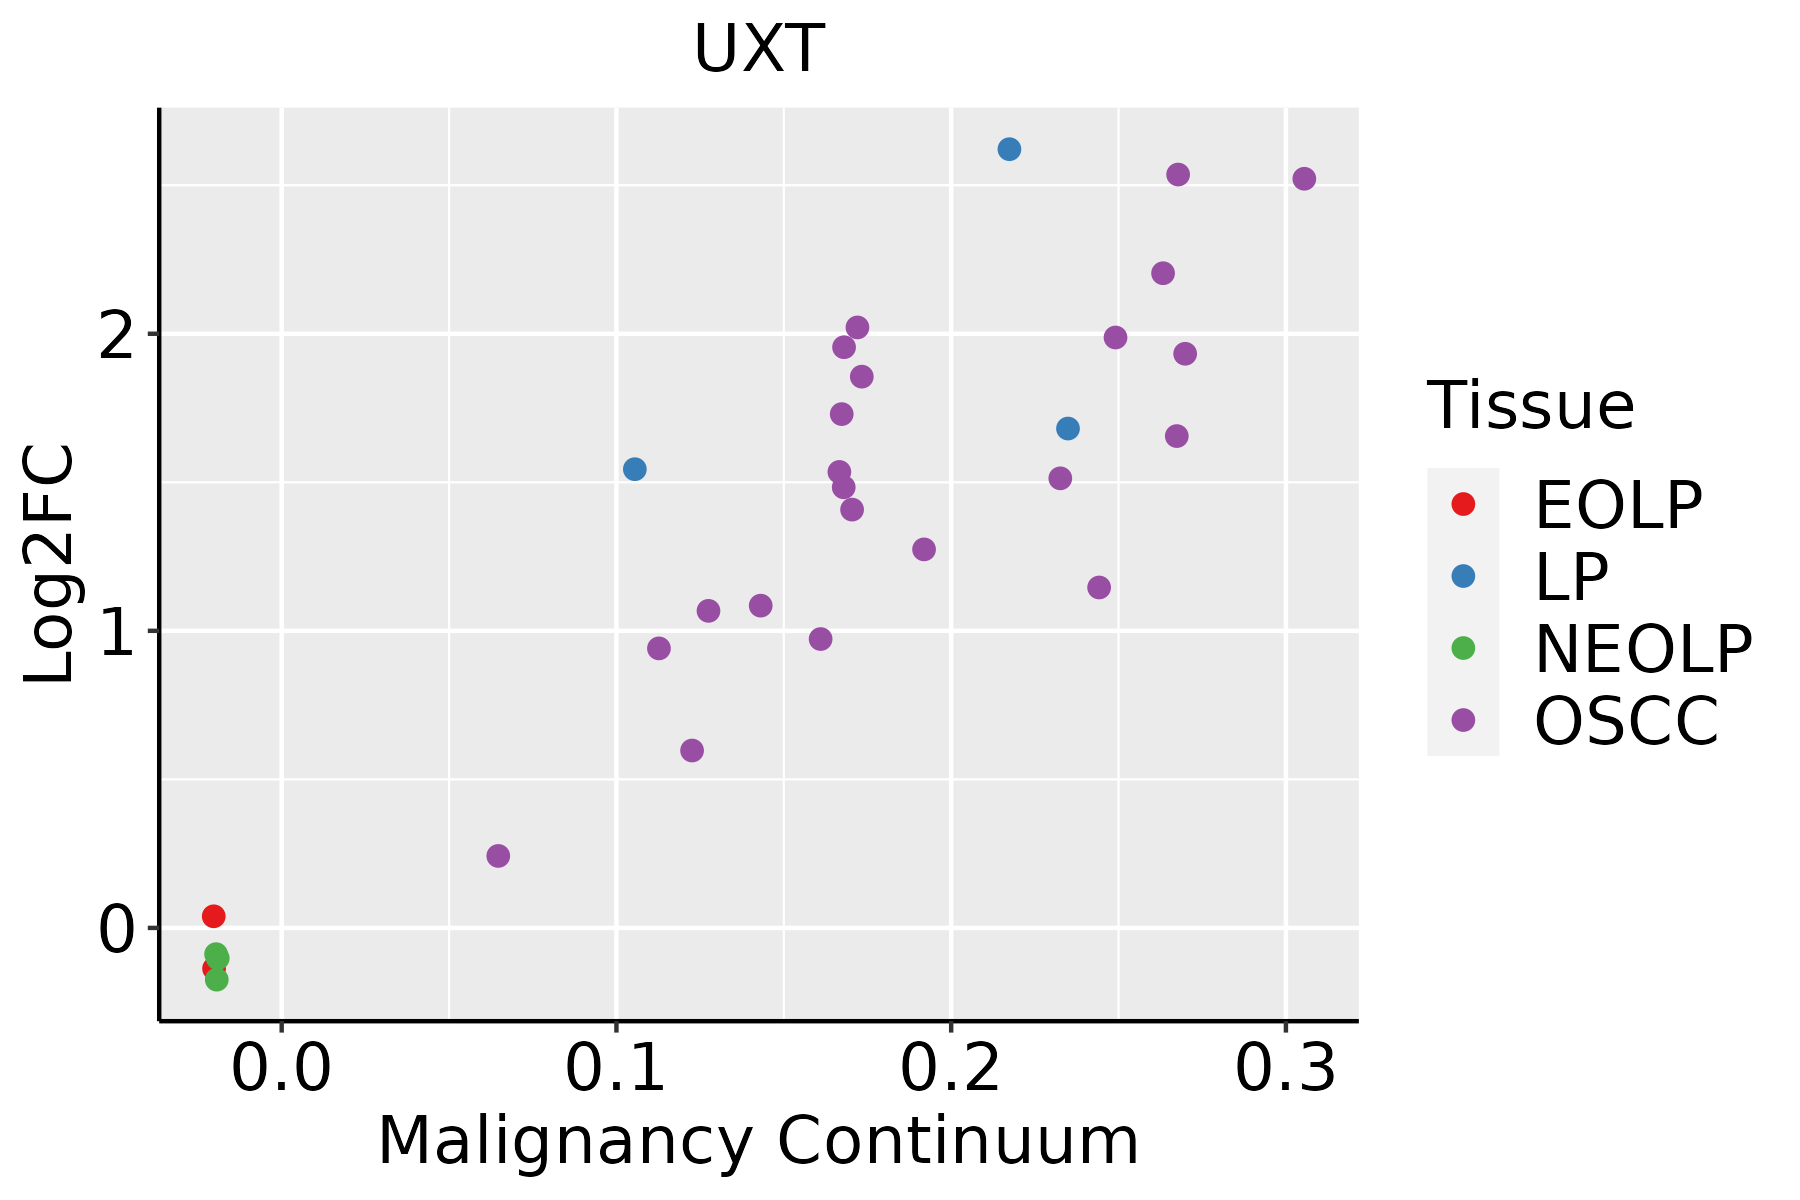 | EOLP: Erosive Oral lichen planus |
| LP: leukoplakia |
| NEOLP: Non-erosive oral lichen planus |
| OSCC: Oral squamous cell carcinoma |
| Prostate | 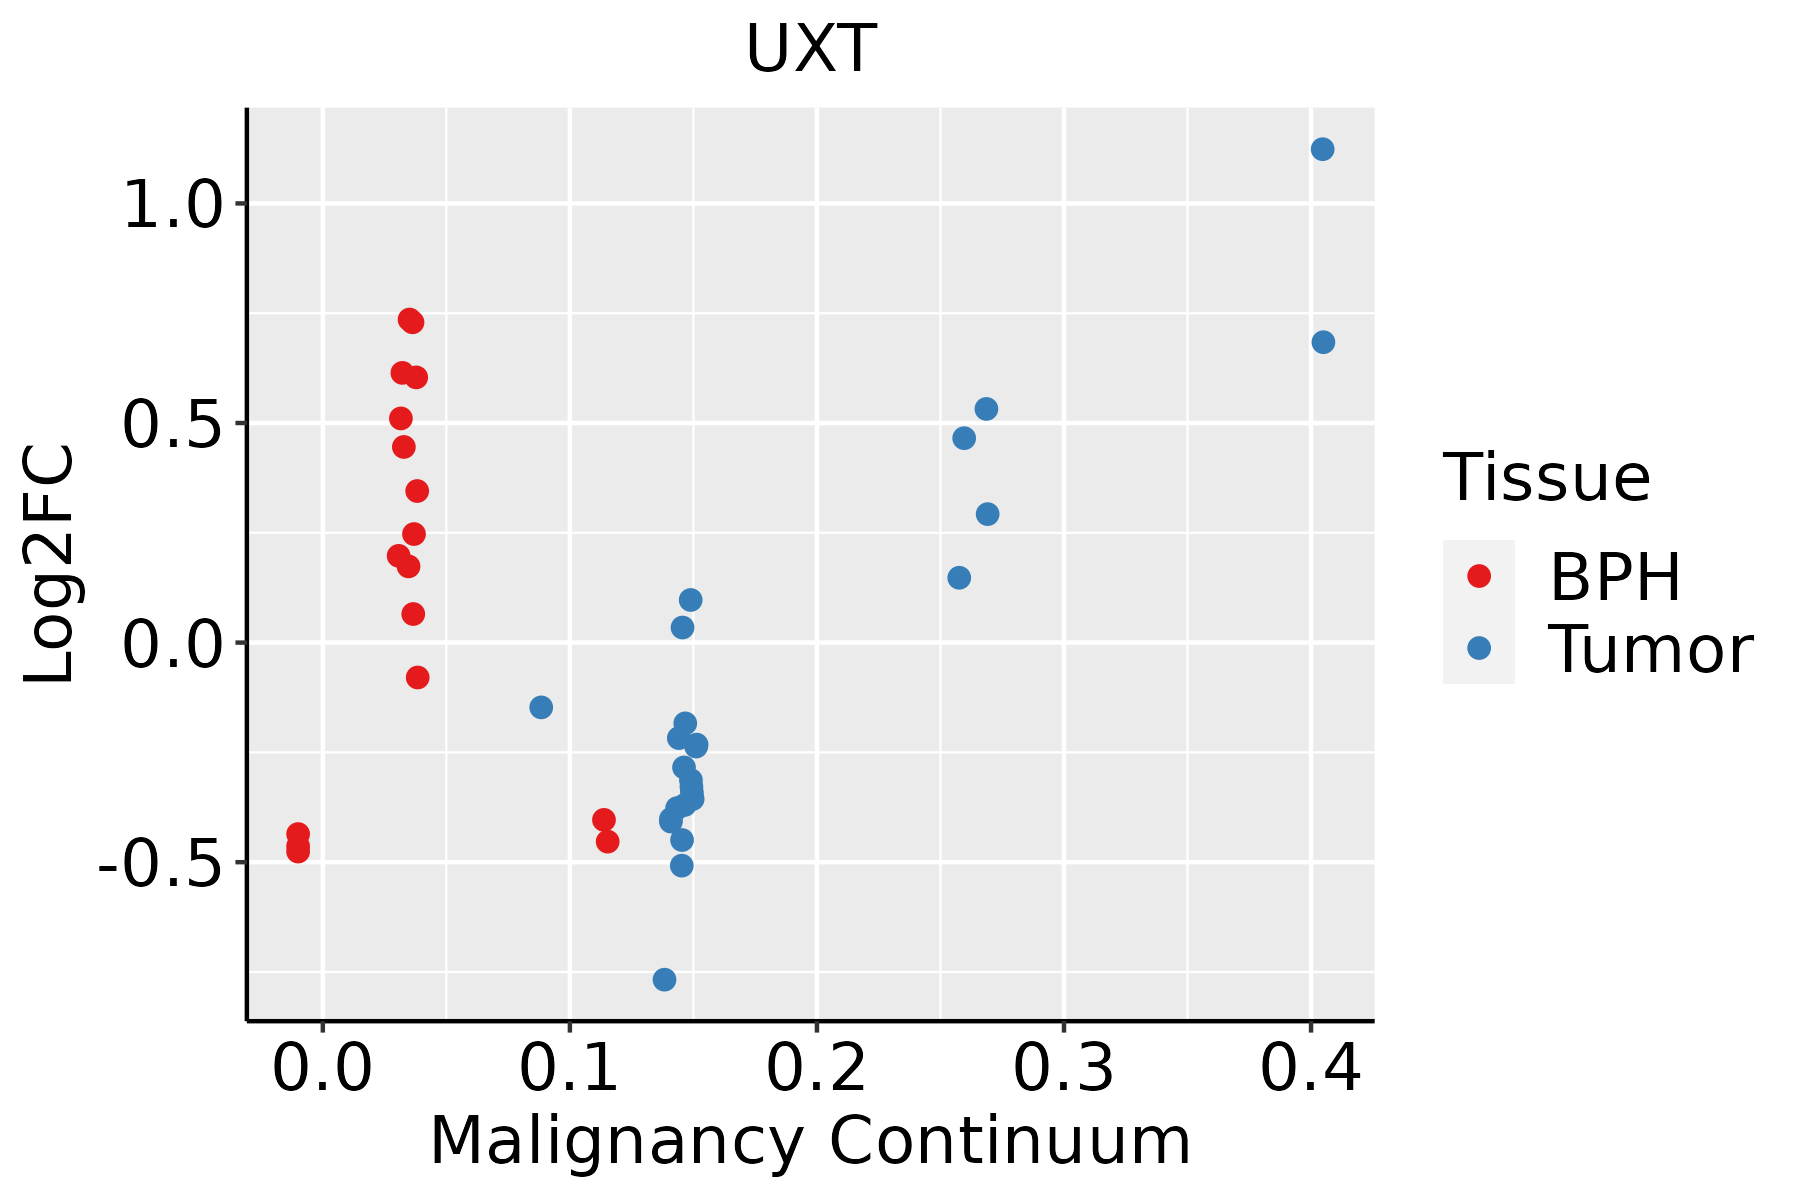 | BPH: Benign Prostatic Hyperplasia |
| Skin | 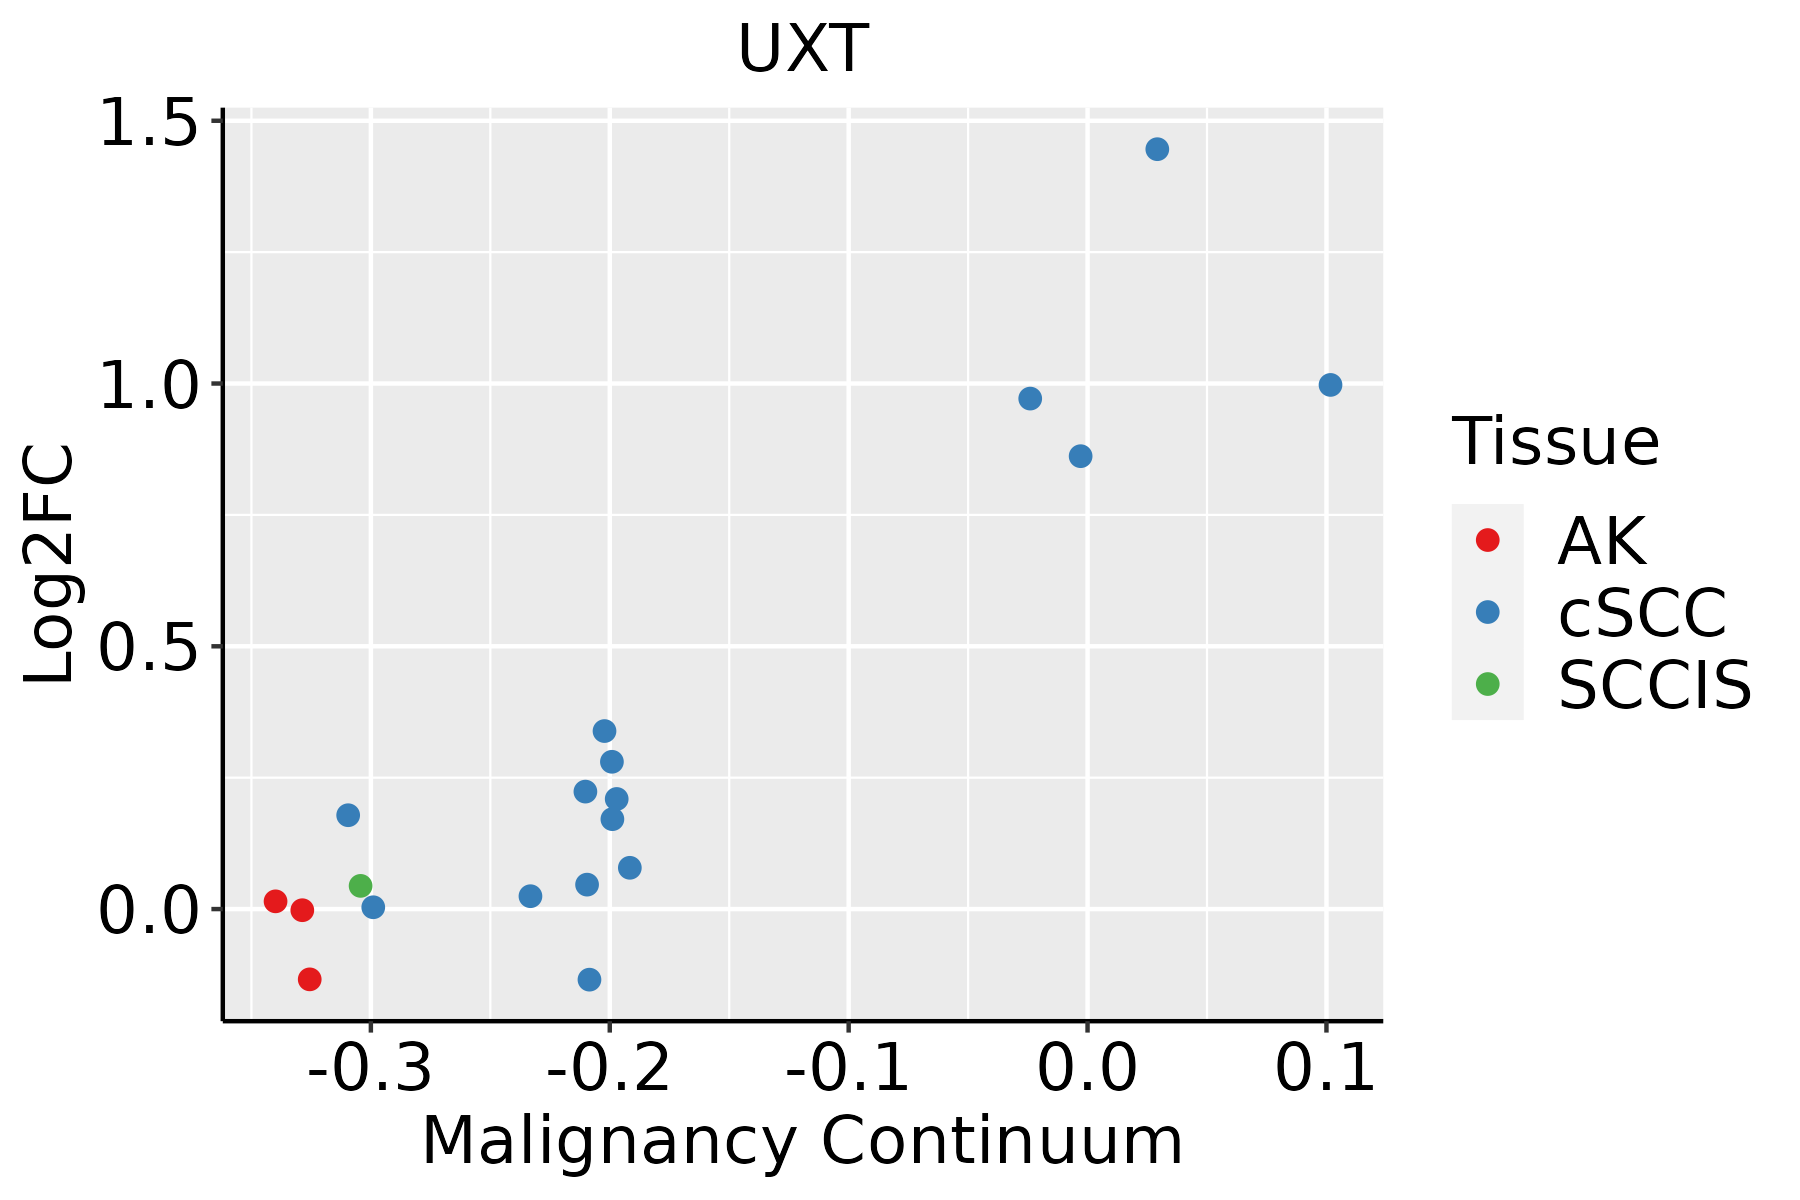 | AK: Actinic keratosis |
| cSCC: Cutaneous squamous cell carcinoma |
| SCCIS:squamous cell carcinoma in situ |
| Thyroid | 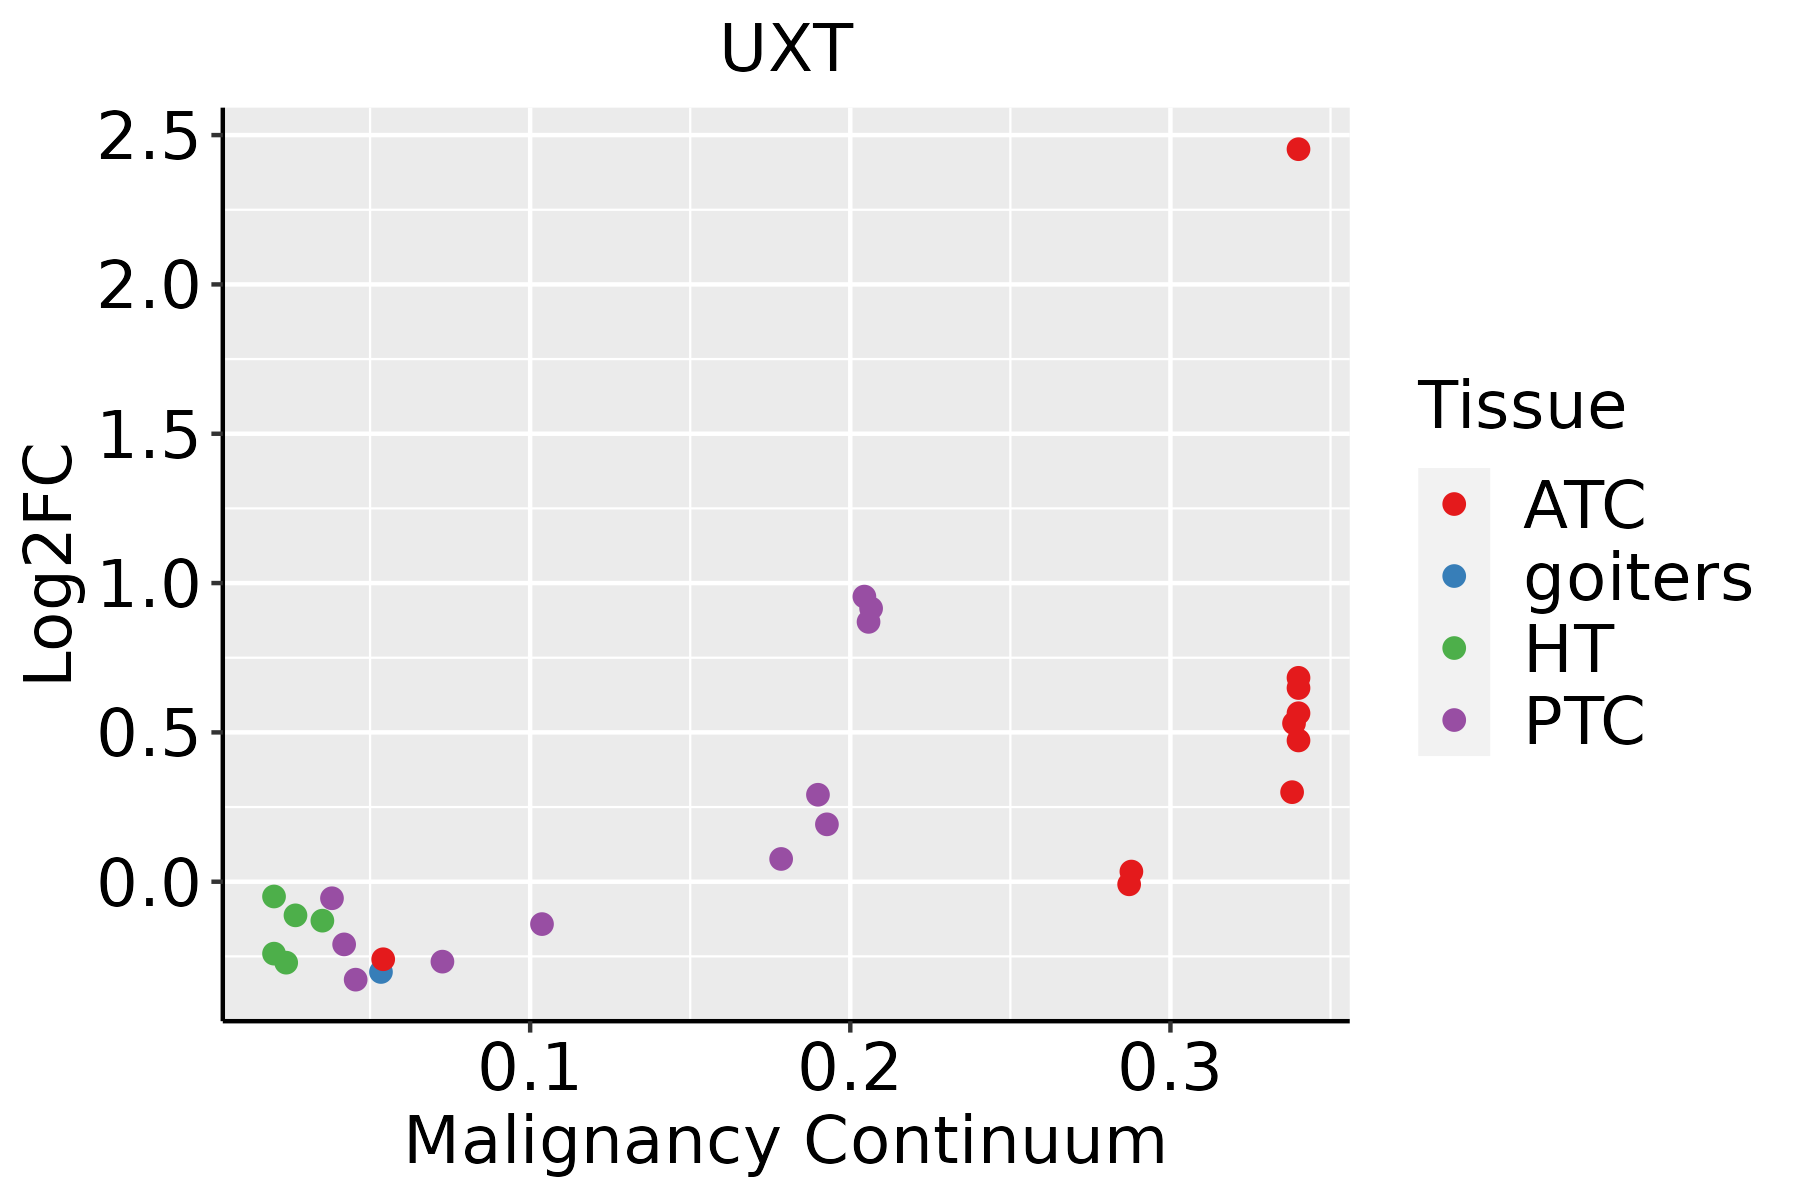 | ATC: Anaplastic thyroid cancer |
| HT: Hashimoto's thyroiditis |
| PTC: Papillary thyroid cancer |
| GO ID | Tissue | Disease Stage | Description | Gene Ratio | Bg Ratio | pvalue | p.adjust | Count |
| GO:00516567 | Cervix | CC | establishment of organelle localization | 76/2311 | 390/18723 | 3.17e-05 | 5.21e-04 | 76 |
| GO:00307057 | Cervix | CC | cytoskeleton-dependent intracellular transport | 40/2311 | 195/18723 | 7.92e-04 | 6.99e-03 | 40 |
| GO:00516541 | Cervix | CC | establishment of mitochondrion localization | 10/2311 | 29/18723 | 1.74e-03 | 1.31e-02 | 10 |
| GO:00516461 | Cervix | CC | mitochondrion localization | 13/2311 | 50/18723 | 6.42e-03 | 3.58e-02 | 13 |
| GO:003070513 | Cervix | N_HPV | cytoskeleton-dependent intracellular transport | 13/534 | 195/18723 | 4.03e-03 | 3.16e-02 | 13 |
| GO:0051656 | Colorectum | AD | establishment of organelle localization | 131/3918 | 390/18723 | 3.00e-09 | 2.06e-07 | 131 |
| GO:0030705 | Colorectum | AD | cytoskeleton-dependent intracellular transport | 60/3918 | 195/18723 | 7.56e-04 | 7.59e-03 | 60 |
| GO:0072384 | Colorectum | AD | organelle transport along microtubule | 28/3918 | 85/18723 | 6.55e-03 | 4.07e-02 | 28 |
| GO:00516561 | Colorectum | SER | establishment of organelle localization | 100/2897 | 390/18723 | 1.11e-07 | 6.79e-06 | 100 |
| GO:00307051 | Colorectum | SER | cytoskeleton-dependent intracellular transport | 44/2897 | 195/18723 | 5.53e-03 | 4.09e-02 | 44 |
| GO:00516562 | Colorectum | MSS | establishment of organelle localization | 115/3467 | 390/18723 | 7.30e-08 | 3.67e-06 | 115 |
| GO:00307052 | Colorectum | MSS | cytoskeleton-dependent intracellular transport | 52/3467 | 195/18723 | 3.07e-03 | 2.34e-02 | 52 |
| GO:00516568 | Endometrium | AEH | establishment of organelle localization | 77/2100 | 390/18723 | 4.89e-07 | 1.94e-05 | 77 |
| GO:00307058 | Endometrium | AEH | cytoskeleton-dependent intracellular transport | 38/2100 | 195/18723 | 4.72e-04 | 4.91e-03 | 38 |
| GO:005165613 | Endometrium | EEC | establishment of organelle localization | 75/2168 | 390/18723 | 6.23e-06 | 1.49e-04 | 75 |
| GO:003070514 | Endometrium | EEC | cytoskeleton-dependent intracellular transport | 39/2168 | 195/18723 | 4.40e-04 | 4.58e-03 | 39 |
| GO:005165616 | Esophagus | HGIN | establishment of organelle localization | 90/2587 | 390/18723 | 4.27e-07 | 1.94e-05 | 90 |
| GO:003070517 | Esophagus | HGIN | cytoskeleton-dependent intracellular transport | 45/2587 | 195/18723 | 3.07e-04 | 5.15e-03 | 45 |
| GO:00109707 | Esophagus | HGIN | transport along microtubule | 35/2587 | 155/18723 | 2.01e-03 | 2.12e-02 | 35 |
| GO:00516542 | Esophagus | HGIN | establishment of mitochondrion localization | 10/2587 | 29/18723 | 4.07e-03 | 3.65e-02 | 10 |
| Hugo Symbol | Variant Class | Variant Classification | dbSNP RS | HGVSc | HGVSp | HGVSp Short | SWISSPROT | BIOTYPE | SIFT | PolyPhen | Tumor Sample Barcode | Tissue | Histology | Sex | Age | Stage | Therapy Types | Drugs | Outcome |
| UXT | SNV | Missense_Mutation | novel | c.187C>A | p.Gln63Lys | p.Q63K | | protein_coding | tolerated(0.1) | probably_damaging(0.996) | TCGA-AN-A046-01 | Breast | breast invasive carcinoma | Female | >=65 | I/II | Unknown | Unknown | SD |
| UXT | SNV | Missense_Mutation | rs200352953 | c.41N>T | p.Ala14Val | p.A14V | | protein_coding | deleterious_low_confidence(0.03) | benign(0.015) | TCGA-AA-A022-01 | Colorectum | colon adenocarcinoma | Female | >=65 | I/II | Unknown | Unknown | SD |
| UXT | SNV | Missense_Mutation | | c.234G>C | p.Glu78Asp | p.E78D | | protein_coding | tolerated(0.23) | benign(0.009) | TCGA-F5-6861-01 | Colorectum | rectum adenocarcinoma | Female | <65 | I/II | Unknown | Unknown | SD |
| UXT | SNV | Missense_Mutation | | c.299N>A | p.Arg100His | p.R100H | | protein_coding | tolerated(0.14) | benign(0.013) | TCGA-A5-A7WJ-01 | Endometrium | uterine corpus endometrioid carcinoma | Female | <65 | I/II | Unknown | Unknown | SD |
| UXT | SNV | Missense_Mutation | novel | c.370N>T | p.Arg124Cys | p.R124C | | protein_coding | deleterious(0) | possibly_damaging(0.857) | TCGA-AJ-A3EK-01 | Endometrium | uterine corpus endometrioid carcinoma | Female | <65 | I/II | Chemotherapy | carboplatin | CR |
| UXT | SNV | Missense_Mutation | rs372164152 | c.109N>G | p.Ser37Gly | p.S37G | | protein_coding | deleterious(0.03) | probably_damaging(0.94) | TCGA-AJ-A3EL-01 | Endometrium | uterine corpus endometrioid carcinoma | Female | <65 | I/II | Unknown | Unknown | SD |
| UXT | SNV | Missense_Mutation | | c.299N>A | p.Arg100His | p.R100H | | protein_coding | tolerated(0.14) | benign(0.013) | TCGA-AX-A2HC-01 | Endometrium | uterine corpus endometrioid carcinoma | Female | <65 | III/IV | Chemotherapy | paclitaxel | PD |
| UXT | SNV | Missense_Mutation | novel | c.152N>A | p.Arg51Gln | p.R51Q | | protein_coding | tolerated(0.08) | benign(0.283) | TCGA-AX-A2HC-01 | Endometrium | uterine corpus endometrioid carcinoma | Female | <65 | III/IV | Chemotherapy | paclitaxel | PD |
| UXT | SNV | Missense_Mutation | novel | c.377G>A | p.Ser126Asn | p.S126N | | protein_coding | tolerated(0.18) | benign(0.079) | TCGA-B5-A3FA-01 | Endometrium | uterine corpus endometrioid carcinoma | Female | >=65 | I/II | Unknown | Unknown | SD |
| UXT | SNV | Missense_Mutation | novel | c.349N>A | p.Glu117Lys | p.E117K | | protein_coding | deleterious(0) | probably_damaging(0.999) | TCGA-D1-A103-01 | Endometrium | uterine corpus endometrioid carcinoma | Female | >=65 | I/II | Unknown | Unknown | SD |


