
|
|||||
|
 | |
| |
| |
| |
| |
| |
|
Gene: UXS1 |
Gene summary for UXS1 |
| Gene information | Species | Human | Gene symbol | UXS1 | Gene ID | 80146 |
| Gene name | UDP-glucuronate decarboxylase 1 | |
| Gene Alias | SDR6E1 | |
| Cytomap | 2q12.2 | |
| Gene Type | protein-coding | GO ID | GO:0005975 | UniProtAcc | Q8NBZ7 |
Top |
Malignant transformation analysis |
| Identification of the aberrant gene expression in precancerous and cancerous lesions by comparing the gene expression of stem-like cells in diseased tissues with normal stem cells |
| Entrez ID | Symbol | Replicates | Species | Organ | Tissue | Adj P-value | Log2FC | Malignancy |
| 80146 | UXS1 | LZE2T | Human | Esophagus | ESCC | 1.42e-04 | 3.61e-01 | 0.082 |
| 80146 | UXS1 | LZE4T | Human | Esophagus | ESCC | 7.02e-09 | 2.16e-01 | 0.0811 |
| 80146 | UXS1 | LZE7T | Human | Esophagus | ESCC | 5.07e-08 | 2.12e-01 | 0.0667 |
| 80146 | UXS1 | LZE8T | Human | Esophagus | ESCC | 8.28e-06 | 2.53e-01 | 0.067 |
| 80146 | UXS1 | LZE20T | Human | Esophagus | ESCC | 3.34e-09 | 3.17e-01 | 0.0662 |
| 80146 | UXS1 | LZE22T | Human | Esophagus | ESCC | 6.54e-06 | 5.98e-01 | 0.068 |
| 80146 | UXS1 | LZE24T | Human | Esophagus | ESCC | 8.70e-18 | 5.23e-01 | 0.0596 |
| 80146 | UXS1 | LZE21T | Human | Esophagus | ESCC | 1.28e-02 | 3.33e-01 | 0.0655 |
| 80146 | UXS1 | LZE6T | Human | Esophagus | ESCC | 1.34e-06 | 3.43e-01 | 0.0845 |
| 80146 | UXS1 | P1T-E | Human | Esophagus | ESCC | 1.70e-05 | 3.44e-01 | 0.0875 |
| 80146 | UXS1 | P2T-E | Human | Esophagus | ESCC | 7.64e-30 | 5.89e-01 | 0.1177 |
| 80146 | UXS1 | P4T-E | Human | Esophagus | ESCC | 5.20e-33 | 6.74e-01 | 0.1323 |
| 80146 | UXS1 | P5T-E | Human | Esophagus | ESCC | 1.32e-12 | 3.38e-01 | 0.1327 |
| 80146 | UXS1 | P8T-E | Human | Esophagus | ESCC | 1.48e-25 | 4.94e-01 | 0.0889 |
| 80146 | UXS1 | P9T-E | Human | Esophagus | ESCC | 1.01e-26 | 6.66e-01 | 0.1131 |
| 80146 | UXS1 | P10T-E | Human | Esophagus | ESCC | 1.33e-79 | 1.62e+00 | 0.116 |
| 80146 | UXS1 | P11T-E | Human | Esophagus | ESCC | 1.81e-23 | 7.92e-01 | 0.1426 |
| 80146 | UXS1 | P12T-E | Human | Esophagus | ESCC | 7.06e-25 | 7.20e-01 | 0.1122 |
| 80146 | UXS1 | P15T-E | Human | Esophagus | ESCC | 1.29e-39 | 8.80e-01 | 0.1149 |
| 80146 | UXS1 | P16T-E | Human | Esophagus | ESCC | 3.10e-34 | 7.43e-01 | 0.1153 |
| Page: 1 2 3 4 5 6 |
| Tissue | Expression Dynamics | Abbreviation |
| Esophagus | 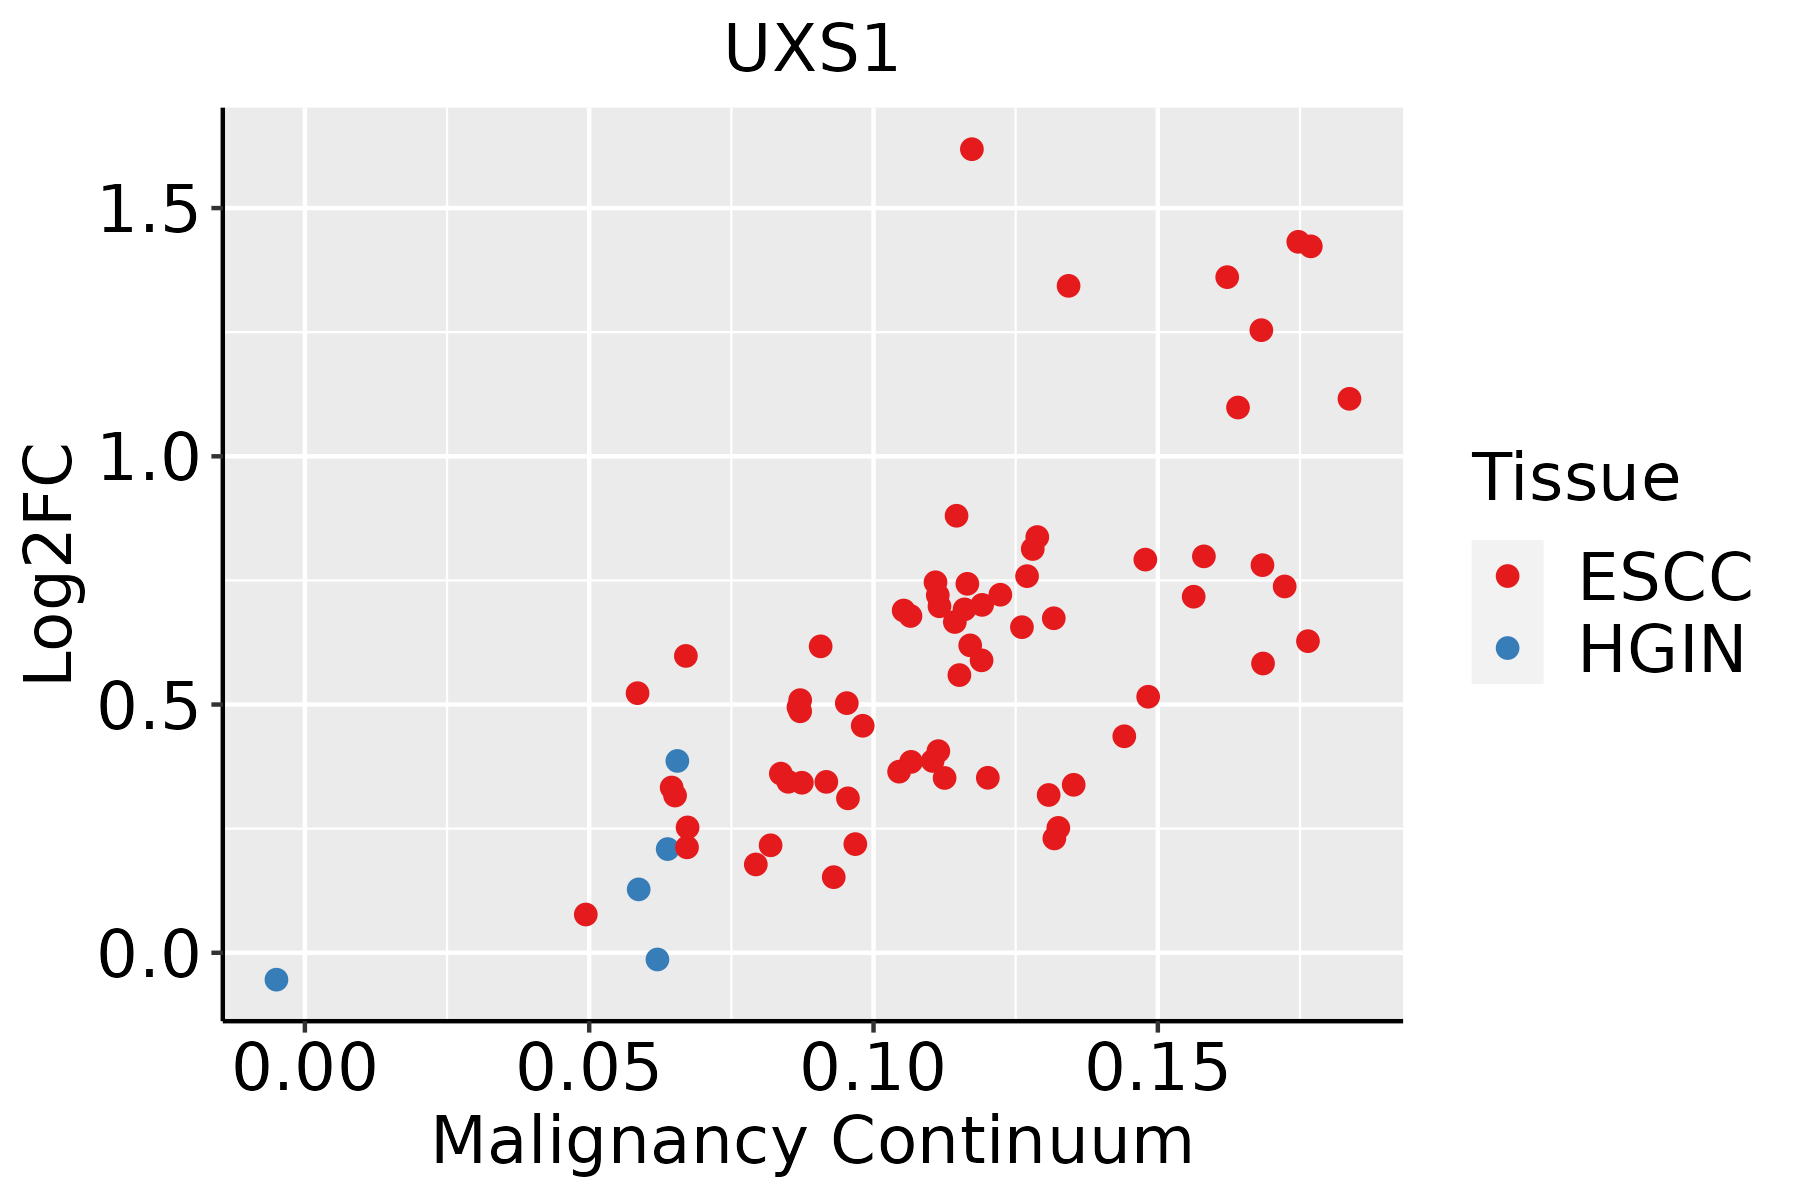 | ESCC: Esophageal squamous cell carcinoma |
| HGIN: High-grade intraepithelial neoplasias | ||
| LGIN: Low-grade intraepithelial neoplasias | ||
| Liver |  | HCC: Hepatocellular carcinoma |
| NAFLD: Non-alcoholic fatty liver disease | ||
| Oral Cavity |  | EOLP: Erosive Oral lichen planus |
| LP: leukoplakia | ||
| NEOLP: Non-erosive oral lichen planus | ||
| OSCC: Oral squamous cell carcinoma | ||
| Skin | 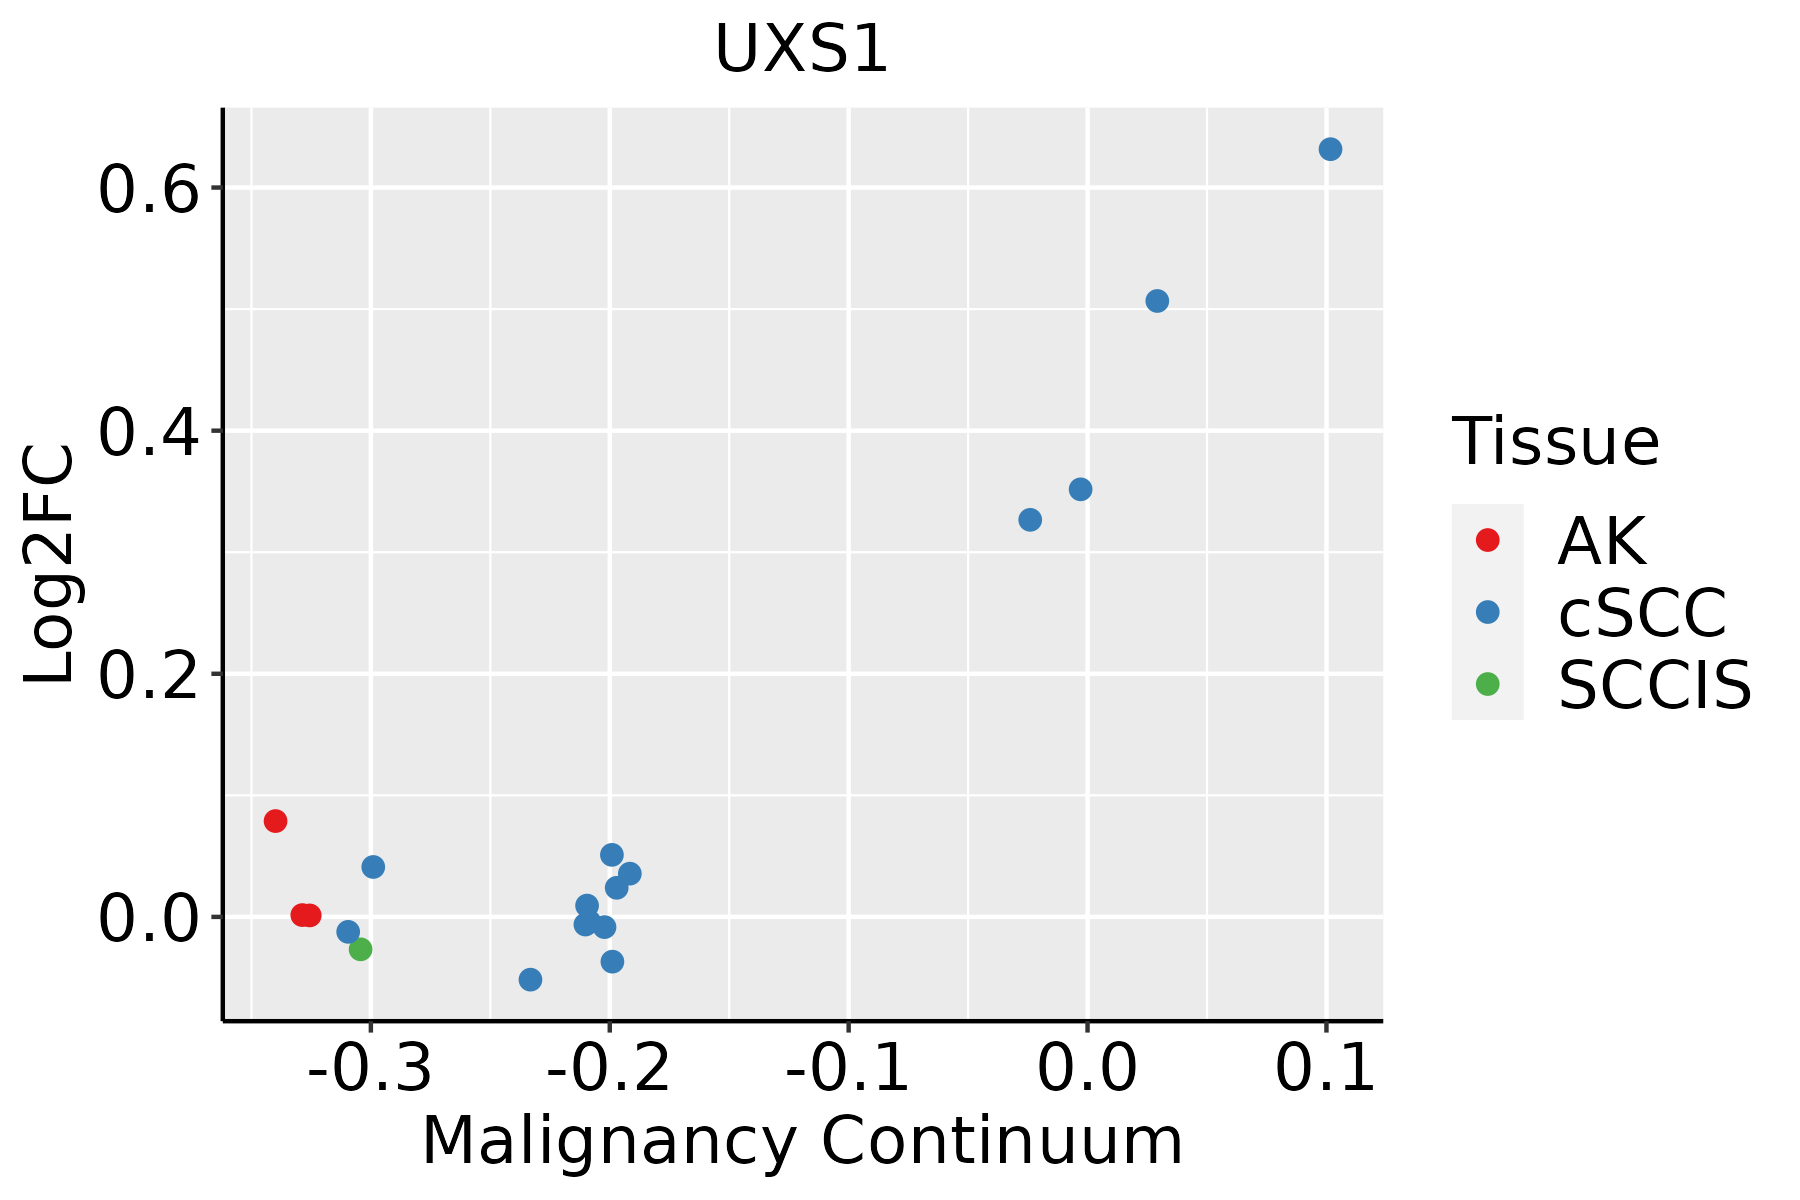 | AK: Actinic keratosis |
| cSCC: Cutaneous squamous cell carcinoma | ||
| SCCIS:squamous cell carcinoma in situ | ||
| Thyroid | 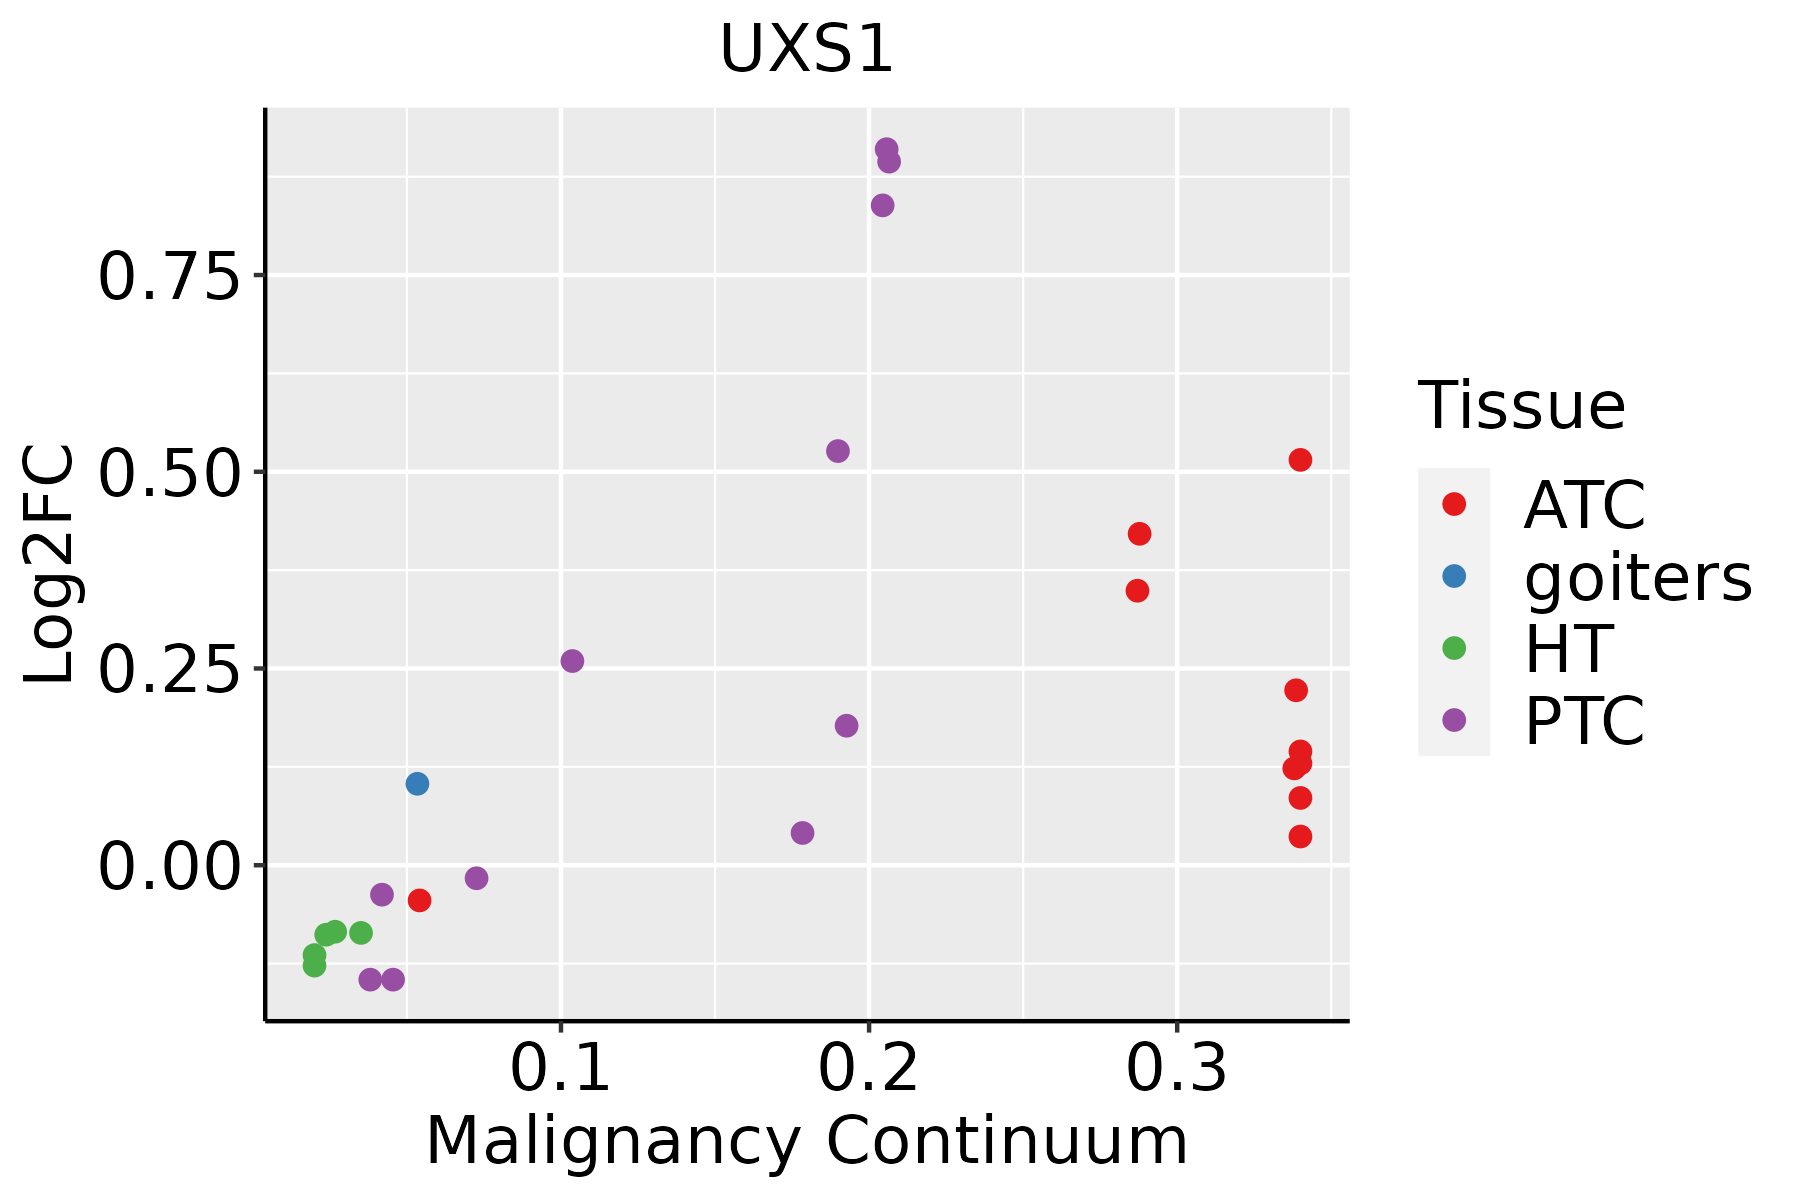 | ATC: Anaplastic thyroid cancer |
| HT: Hashimoto's thyroiditis | ||
| PTC: Papillary thyroid cancer |
| ∗log2FC in expression of this searched gene in stem-like cells from each diseased tissue sample relative to stem-like cells in normal samples in each tissue plotted against the malignancy continuum. Samples are colored based on if they are from different disease stage. |
Top |
Malignant transformation related pathway analysis |
| Find out the enriched GO biological processes and KEGG pathways involved in transition from healthy to precancer to cancer |
| Tissue | Disease Stage | Enriched GO biological Processes |
| Colorectum | AD |  |
| Colorectum | SER |  |
| Colorectum | MSS |  |
| Colorectum | MSI-H |  |
| Colorectum | FAP |  |
| ∗Top 15 enriched GO BP terms are showed in the bar plot of each disease state in each tissue. Each row represents a significant GO biological process which is colored according to the -log10(p.adjust). |
| Page: 1 2 3 4 5 6 7 8 9 |
| GO ID | Tissue | Disease Stage | Description | Gene Ratio | Bg Ratio | pvalue | p.adjust | Count |
| GO:00059969 | Esophagus | ESCC | monosaccharide metabolic process | 159/8552 | 257/18723 | 1.11e-07 | 1.81e-06 | 159 |
| GO:00092256 | Esophagus | ESCC | nucleotide-sugar metabolic process | 29/8552 | 36/18723 | 1.91e-05 | 1.67e-04 | 29 |
| GO:00092262 | Esophagus | ESCC | nucleotide-sugar biosynthetic process | 14/8552 | 19/18723 | 1.27e-02 | 4.21e-02 | 14 |
| GO:000599621 | Liver | HCC | monosaccharide metabolic process | 167/7958 | 257/18723 | 2.31e-13 | 1.25e-11 | 167 |
| GO:00092254 | Liver | HCC | nucleotide-sugar metabolic process | 25/7958 | 36/18723 | 9.87e-04 | 5.71e-03 | 25 |
| GO:00092255 | Oral cavity | OSCC | nucleotide-sugar metabolic process | 26/7305 | 36/18723 | 5.44e-05 | 4.51e-04 | 26 |
| GO:00059968 | Oral cavity | OSCC | monosaccharide metabolic process | 129/7305 | 257/18723 | 1.63e-04 | 1.13e-03 | 129 |
| GO:00092261 | Oral cavity | OSCC | nucleotide-sugar biosynthetic process | 14/7305 | 19/18723 | 2.31e-03 | 1.02e-02 | 14 |
| GO:000599613 | Oral cavity | LP | monosaccharide metabolic process | 86/4623 | 257/18723 | 9.13e-04 | 7.79e-03 | 86 |
| GO:000599610 | Skin | cSCC | monosaccharide metabolic process | 85/4864 | 257/18723 | 6.43e-03 | 3.14e-02 | 85 |
| GO:000599614 | Thyroid | PTC | monosaccharide metabolic process | 115/5968 | 257/18723 | 9.36e-06 | 1.05e-04 | 115 |
| GO:00092257 | Thyroid | PTC | nucleotide-sugar metabolic process | 23/5968 | 36/18723 | 7.78e-05 | 6.66e-04 | 23 |
| GO:000599615 | Thyroid | ATC | monosaccharide metabolic process | 118/6293 | 257/18723 | 2.56e-05 | 2.20e-04 | 118 |
| GO:000922511 | Thyroid | ATC | nucleotide-sugar metabolic process | 24/6293 | 36/18723 | 5.10e-05 | 3.99e-04 | 24 |
| GO:00092263 | Thyroid | ATC | nucleotide-sugar biosynthetic process | 12/6293 | 19/18723 | 7.97e-03 | 3.08e-02 | 12 |
| Page: 1 |
| Pathway ID | Tissue | Disease Stage | Description | Gene Ratio | Bg Ratio | pvalue | p.adjust | qvalue | Count |
| hsa012505 | Esophagus | ESCC | Biosynthesis of nucleotide sugars | 28/4205 | 37/8465 | 1.10e-03 | 3.42e-03 | 1.75e-03 | 28 |
| hsa005202 | Esophagus | ESCC | Amino sugar and nucleotide sugar metabolism | 35/4205 | 49/8465 | 1.60e-03 | 4.88e-03 | 2.50e-03 | 35 |
| hsa0125012 | Esophagus | ESCC | Biosynthesis of nucleotide sugars | 28/4205 | 37/8465 | 1.10e-03 | 3.42e-03 | 1.75e-03 | 28 |
| hsa0052011 | Esophagus | ESCC | Amino sugar and nucleotide sugar metabolism | 35/4205 | 49/8465 | 1.60e-03 | 4.88e-03 | 2.50e-03 | 35 |
| hsa00520 | Oral cavity | OSCC | Amino sugar and nucleotide sugar metabolism | 34/3704 | 49/8465 | 2.48e-04 | 8.08e-04 | 4.11e-04 | 34 |
| hsa012504 | Oral cavity | OSCC | Biosynthesis of nucleotide sugars | 25/3704 | 37/8465 | 2.93e-03 | 7.49e-03 | 3.81e-03 | 25 |
| hsa005201 | Oral cavity | OSCC | Amino sugar and nucleotide sugar metabolism | 34/3704 | 49/8465 | 2.48e-04 | 8.08e-04 | 4.11e-04 | 34 |
| hsa0125011 | Oral cavity | OSCC | Biosynthesis of nucleotide sugars | 25/3704 | 37/8465 | 2.93e-03 | 7.49e-03 | 3.81e-03 | 25 |
| Page: 1 |
Top |
Cell-cell communication analysis |
| Identification of potential cell-cell interactions between two cell types and their ligand-receptor pairs for different disease states |
| Ligand | Receptor | LRpair | Pathway | Tissue | Disease Stage |
| Page: 1 |
Top |
Single-cell gene regulatory network inference analysis |
| Find out the significant the regulons (TFs) and the target genes of each regulon across cell types for different disease states |
| TF | Cell Type | Tissue | Disease Stage | Target Gene | RSS | Regulon Activity |
| ∗The dot plots of a searched regulon are shown for all cell subpopulations in each disease state of each tissue based on the regulon specific score inferred using pySCENIC and by calculating the average expression. |
| Page: 1 |
Top |
Somatic mutation of malignant transformation related genes |
| Annotation of somatic variants for genes involved in malignant transformation |
| Hugo Symbol | Variant Class | Variant Classification | dbSNP RS | HGVSc | HGVSp | HGVSp Short | SWISSPROT | BIOTYPE | SIFT | PolyPhen | Tumor Sample Barcode | Tissue | Histology | Sex | Age | Stage | Therapy Types | Drugs | Outcome |
| UXS1 | SNV | Missense_Mutation | c.304N>A | p.Ala102Thr | p.A102T | Q8NBZ7 | protein_coding | deleterious(0.01) | probably_damaging(0.994) | TCGA-A8-A09Z-01 | Breast | breast invasive carcinoma | Female | >=65 | I/II | Unknown | Unknown | SD | |
| UXS1 | SNV | Missense_Mutation | c.400N>A | p.Val134Met | p.V134M | Q8NBZ7 | protein_coding | tolerated(0.05) | probably_damaging(0.97) | TCGA-BH-A0E7-01 | Breast | breast invasive carcinoma | Female | >=65 | I/II | Hormone Therapy | arimidex | SD | |
| UXS1 | SNV | Missense_Mutation | c.205N>A | p.Glu69Lys | p.E69K | Q8NBZ7 | protein_coding | tolerated_low_confidence(0.08) | benign(0.026) | TCGA-C8-A12Q-01 | Breast | breast invasive carcinoma | Female | >=65 | III/IV | Unknown | Unknown | PD | |
| UXS1 | SNV | Missense_Mutation | c.925G>A | p.Asp309Asn | p.D309N | Q8NBZ7 | protein_coding | deleterious(0.01) | probably_damaging(0.97) | TCGA-2W-A8YY-01 | Cervix | cervical & endocervical cancer | Female | <65 | I/II | Chemotherapy | cisplatin | CR | |
| UXS1 | SNV | Missense_Mutation | c.120N>A | p.Met40Ile | p.M40I | Q8NBZ7 | protein_coding | deleterious_low_confidence(0.01) | benign(0) | TCGA-DR-A0ZM-01 | Cervix | cervical & endocervical cancer | Female | <65 | III/IV | Unspecific | Cisplatin | SD | |
| UXS1 | SNV | Missense_Mutation | c.1195G>A | p.Glu399Lys | p.E399K | Q8NBZ7 | protein_coding | tolerated(0.13) | benign(0.409) | TCGA-IR-A3LA-01 | Cervix | cervical & endocervical cancer | Female | <65 | I/II | Chemotherapy | cisplatin | CR | |
| UXS1 | SNV | Missense_Mutation | c.104G>A | p.Gly35Asp | p.G35D | Q8NBZ7 | protein_coding | tolerated_low_confidence(0.17) | possibly_damaging(0.453) | TCGA-AA-3510-01 | Colorectum | colon adenocarcinoma | Male | >=65 | I/II | Unknown | Unknown | SD | |
| UXS1 | SNV | Missense_Mutation | c.350G>A | p.Gly117Asp | p.G117D | Q8NBZ7 | protein_coding | deleterious(0.01) | probably_damaging(1) | TCGA-AA-3663-01 | Colorectum | colon adenocarcinoma | Male | <65 | I/II | Unknown | Unknown | SD | |
| UXS1 | SNV | Missense_Mutation | rs546343589 | c.766N>A | p.Val256Met | p.V256M | Q8NBZ7 | protein_coding | deleterious(0.03) | possibly_damaging(0.727) | TCGA-AA-3672-01 | Colorectum | colon adenocarcinoma | Female | >=65 | III/IV | Unknown | Unknown | SD |
| UXS1 | SNV | Missense_Mutation | rs776255521 | c.809G>A | p.Arg270His | p.R270H | Q8NBZ7 | protein_coding | deleterious(0.01) | probably_damaging(0.997) | TCGA-AA-3710-01 | Colorectum | colon adenocarcinoma | Female | >=65 | I/II | Unknown | Unknown | SD |
| Page: 1 2 3 4 5 6 |
Top |
Related drugs of malignant transformation related genes |
| Identification of chemicals and drugs interact with genes involved in malignant transfromation |
| (DGIdb 4.0) |
| Entrez ID | Symbol | Category | Interaction Types | Drug Claim Name | Drug Name | PMIDs |
| Page: 1 |

Copyright 2023-Present -The University of Texas Health Science Center at Houston |