
|
|||||
|
 | |
| |
| |
| |
| |
| |
|
Gene: UVSSA |
Gene summary for UVSSA |
| Gene information | Species | Human | Gene symbol | UVSSA | Gene ID | 57654 |
| Gene name | UV stimulated scaffold protein A | |
| Gene Alias | KIAA1530 | |
| Cytomap | 4p16.3 | |
| Gene Type | protein-coding | GO ID | GO:0006139 | UniProtAcc | Q2YD98 |
Top |
Malignant transformation analysis |
| Identification of the aberrant gene expression in precancerous and cancerous lesions by comparing the gene expression of stem-like cells in diseased tissues with normal stem cells |
| Entrez ID | Symbol | Replicates | Species | Organ | Tissue | Adj P-value | Log2FC | Malignancy |
| 57654 | UVSSA | male-WTA | Human | Thyroid | PTC | 4.67e-09 | 5.89e-02 | 0.1037 |
| 57654 | UVSSA | PTC01 | Human | Thyroid | PTC | 9.98e-05 | 8.63e-02 | 0.1899 |
| 57654 | UVSSA | PTC03 | Human | Thyroid | PTC | 9.29e-18 | 6.16e-01 | 0.1784 |
| 57654 | UVSSA | PTC04 | Human | Thyroid | PTC | 9.84e-47 | 8.66e-01 | 0.1927 |
| 57654 | UVSSA | PTC05 | Human | Thyroid | PTC | 1.80e-15 | 6.29e-01 | 0.2065 |
| 57654 | UVSSA | PTC06 | Human | Thyroid | PTC | 1.58e-30 | 8.08e-01 | 0.2057 |
| 57654 | UVSSA | PTC07 | Human | Thyroid | PTC | 2.03e-18 | 4.23e-01 | 0.2044 |
| 57654 | UVSSA | ATC09 | Human | Thyroid | ATC | 4.33e-06 | 2.03e-01 | 0.2871 |
| 57654 | UVSSA | ATC12 | Human | Thyroid | ATC | 4.11e-10 | 1.78e-01 | 0.34 |
| 57654 | UVSSA | ATC13 | Human | Thyroid | ATC | 3.32e-40 | 6.44e-01 | 0.34 |
| 57654 | UVSSA | ATC1 | Human | Thyroid | ATC | 3.77e-05 | 2.12e-01 | 0.2878 |
| 57654 | UVSSA | ATC2 | Human | Thyroid | ATC | 3.07e-05 | 4.98e-01 | 0.34 |
| 57654 | UVSSA | ATC3 | Human | Thyroid | ATC | 1.18e-05 | 2.56e-01 | 0.338 |
| 57654 | UVSSA | ATC4 | Human | Thyroid | ATC | 1.39e-13 | 2.46e-01 | 0.34 |
| 57654 | UVSSA | ATC5 | Human | Thyroid | ATC | 1.21e-37 | 6.83e-01 | 0.34 |
| Page: 1 |
| Tissue | Expression Dynamics | Abbreviation |
| Thyroid | 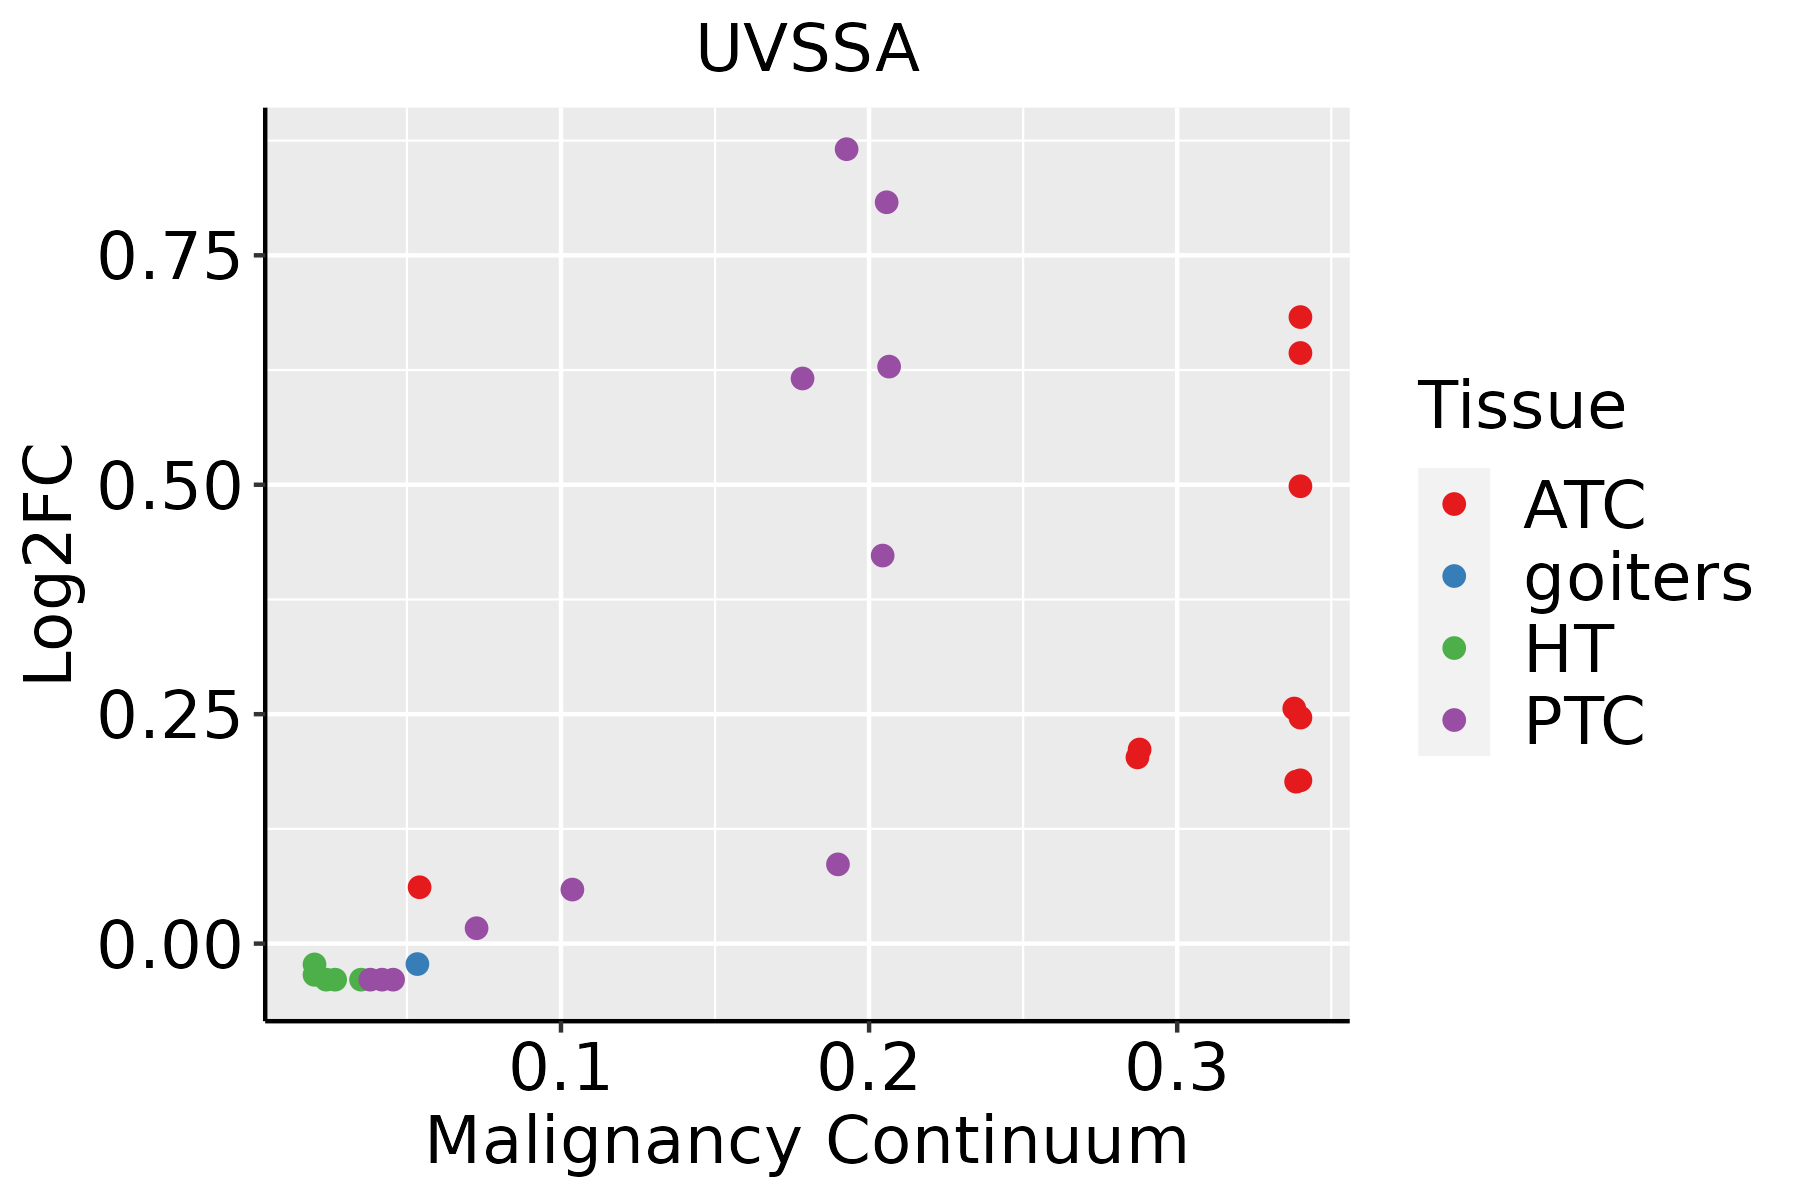 | ATC: Anaplastic thyroid cancer |
| HT: Hashimoto's thyroiditis | ||
| PTC: Papillary thyroid cancer |
| ∗log2FC in expression of this searched gene in stem-like cells from each diseased tissue sample relative to stem-like cells in normal samples in each tissue plotted against the malignancy continuum. Samples are colored based on if they are from different disease stage. |
Top |
Malignant transformation related pathway analysis |
| Find out the enriched GO biological processes and KEGG pathways involved in transition from healthy to precancer to cancer |
| Tissue | Disease Stage | Enriched GO biological Processes |
| Colorectum | AD |  |
| Colorectum | SER |  |
| Colorectum | MSS |  |
| Colorectum | MSI-H |  |
| Colorectum | FAP |  |
| ∗Top 15 enriched GO BP terms are showed in the bar plot of each disease state in each tissue. Each row represents a significant GO biological process which is colored according to the -log10(p.adjust). |
| Page: 1 2 3 4 5 6 7 8 9 |
| GO ID | Tissue | Disease Stage | Description | Gene Ratio | Bg Ratio | pvalue | p.adjust | Count |
| GO:0009314111 | Thyroid | PTC | response to radiation | 195/5968 | 456/18723 | 5.10e-07 | 8.27e-06 | 195 |
| GO:00094117 | Thyroid | PTC | response to UV | 76/5968 | 149/18723 | 8.97e-07 | 1.36e-05 | 76 |
| GO:00094167 | Thyroid | PTC | response to light stimulus | 127/5968 | 320/18723 | 1.76e-03 | 9.58e-03 | 127 |
| GO:000941115 | Thyroid | ATC | response to UV | 84/6293 | 149/18723 | 8.97e-09 | 1.90e-07 | 84 |
| GO:000931426 | Thyroid | ATC | response to radiation | 210/6293 | 456/18723 | 1.69e-08 | 3.39e-07 | 210 |
| GO:000941613 | Thyroid | ATC | response to light stimulus | 139/6293 | 320/18723 | 1.42e-04 | 9.88e-04 | 139 |
| Page: 1 |
| Pathway ID | Tissue | Disease Stage | Description | Gene Ratio | Bg Ratio | pvalue | p.adjust | qvalue | Count |
| Page: 1 |
Top |
Cell-cell communication analysis |
| Identification of potential cell-cell interactions between two cell types and their ligand-receptor pairs for different disease states |
| Ligand | Receptor | LRpair | Pathway | Tissue | Disease Stage |
| Page: 1 |
Top |
Single-cell gene regulatory network inference analysis |
| Find out the significant the regulons (TFs) and the target genes of each regulon across cell types for different disease states |
| TF | Cell Type | Tissue | Disease Stage | Target Gene | RSS | Regulon Activity |
| ∗The dot plots of a searched regulon are shown for all cell subpopulations in each disease state of each tissue based on the regulon specific score inferred using pySCENIC and by calculating the average expression. |
| Page: 1 |
Top |
Somatic mutation of malignant transformation related genes |
| Annotation of somatic variants for genes involved in malignant transformation |
| Hugo Symbol | Variant Class | Variant Classification | dbSNP RS | HGVSc | HGVSp | HGVSp Short | SWISSPROT | BIOTYPE | SIFT | PolyPhen | Tumor Sample Barcode | Tissue | Histology | Sex | Age | Stage | Therapy Types | Drugs | Outcome |
| UVSSA | SNV | Missense_Mutation | novel | c.509T>G | p.Ile170Ser | p.I170S | Q2YD98 | protein_coding | deleterious(0) | possibly_damaging(0.856) | TCGA-AN-A046-01 | Breast | breast invasive carcinoma | Female | >=65 | I/II | Unknown | Unknown | SD |
| UVSSA | SNV | Missense_Mutation | rs141268114 | c.862G>A | p.Asp288Asn | p.D288N | Q2YD98 | protein_coding | tolerated(0.06) | benign(0.207) | TCGA-2W-A8YY-01 | Cervix | cervical & endocervical cancer | Female | <65 | I/II | Chemotherapy | cisplatin | CR |
| UVSSA | SNV | Missense_Mutation | rs372587885 | c.2011N>T | p.Arg671Cys | p.R671C | Q2YD98 | protein_coding | deleterious(0.02) | benign(0.03) | TCGA-C5-A3HE-01 | Cervix | cervical & endocervical cancer | Female | <65 | I/II | Unknown | Unknown | PD |
| UVSSA | SNV | Missense_Mutation | rs148799777 | c.682C>T | p.Arg228Cys | p.R228C | Q2YD98 | protein_coding | tolerated(0.19) | benign(0) | TCGA-MA-AA42-01 | Cervix | cervical & endocervical cancer | Female | >=65 | I/II | Unknown | Unknown | SD |
| UVSSA | SNV | Missense_Mutation | rs199781120 | c.868G>A | p.Glu290Lys | p.E290K | Q2YD98 | protein_coding | deleterious(0.03) | benign(0.349) | TCGA-MA-AA42-01 | Cervix | cervical & endocervical cancer | Female | >=65 | I/II | Unknown | Unknown | SD |
| UVSSA | SNV | Missense_Mutation | rs141095512 | c.454C>T | p.Arg152Trp | p.R152W | Q2YD98 | protein_coding | deleterious(0) | probably_damaging(0.993) | TCGA-A6-6781-01 | Colorectum | colon adenocarcinoma | Male | <65 | III/IV | Chemotherapy | oxaliplatin | SD |
| UVSSA | SNV | Missense_Mutation | novel | c.1312N>T | p.Asp438Tyr | p.D438Y | Q2YD98 | protein_coding | deleterious(0.01) | benign(0.079) | TCGA-AA-A00N-01 | Colorectum | colon adenocarcinoma | Male | >=65 | I/II | Unknown | Unknown | PD |
| UVSSA | SNV | Missense_Mutation | c.89N>G | p.Lys30Arg | p.K30R | Q2YD98 | protein_coding | tolerated(0.05) | probably_damaging(0.917) | TCGA-AA-A010-01 | Colorectum | colon adenocarcinoma | Female | <65 | I/II | Chemotherapy | folinic | CR | |
| UVSSA | SNV | Missense_Mutation | rs750867210 | c.124N>A | p.Ala42Thr | p.A42T | Q2YD98 | protein_coding | tolerated(0.22) | benign(0.003) | TCGA-AU-6004-01 | Colorectum | colon adenocarcinoma | Female | >=65 | I/II | Unknown | Unknown | SD |
| UVSSA | SNV | Missense_Mutation | rs770306039 | c.122N>A | p.Arg41His | p.R41H | Q2YD98 | protein_coding | tolerated(1) | benign(0) | TCGA-D5-6928-01 | Colorectum | colon adenocarcinoma | Male | >=65 | I/II | Unknown | Unknown | SD |
| Page: 1 2 3 4 5 6 7 8 |
Top |
Related drugs of malignant transformation related genes |
| Identification of chemicals and drugs interact with genes involved in malignant transfromation |
| (DGIdb 4.0) |
| Entrez ID | Symbol | Category | Interaction Types | Drug Claim Name | Drug Name | PMIDs |
| Page: 1 |

Copyright 2023-Present -The University of Texas Health Science Center at Houston |