
|
|||||
|
 | |
| |
| |
| |
| |
| |
|
Gene: UVRAG |
Gene summary for UVRAG |
| Gene information | Species | Human | Gene symbol | UVRAG | Gene ID | 7405 |
| Gene name | UV radiation resistance associated | |
| Gene Alias | DHTX | |
| Cytomap | 11q13.5 | |
| Gene Type | protein-coding | GO ID | GO:0000226 | UniProtAcc | Q9P2Y5 |
Top |
Malignant transformation analysis |
| Identification of the aberrant gene expression in precancerous and cancerous lesions by comparing the gene expression of stem-like cells in diseased tissues with normal stem cells |
| Entrez ID | Symbol | Replicates | Species | Organ | Tissue | Adj P-value | Log2FC | Malignancy |
| 7405 | UVRAG | HTA11_3410_2000001011 | Human | Colorectum | AD | 1.67e-04 | -4.23e-01 | 0.0155 |
| 7405 | UVRAG | HTA11_7696_3000711011 | Human | Colorectum | AD | 1.36e-06 | -2.71e-01 | 0.0674 |
| 7405 | UVRAG | HTA11_99999974143_84620 | Human | Colorectum | MSS | 5.12e-08 | -3.94e-01 | 0.3005 |
| 7405 | UVRAG | A015-C-203 | Human | Colorectum | FAP | 2.26e-26 | -4.53e-01 | -0.1294 |
| 7405 | UVRAG | A015-C-204 | Human | Colorectum | FAP | 5.50e-05 | -3.35e-01 | -0.0228 |
| 7405 | UVRAG | A014-C-040 | Human | Colorectum | FAP | 5.10e-04 | -5.23e-01 | -0.1184 |
| 7405 | UVRAG | A002-C-201 | Human | Colorectum | FAP | 1.36e-10 | -3.61e-01 | 0.0324 |
| 7405 | UVRAG | A002-C-203 | Human | Colorectum | FAP | 3.29e-03 | -1.74e-01 | 0.2786 |
| 7405 | UVRAG | A001-C-119 | Human | Colorectum | FAP | 7.59e-04 | -3.80e-01 | -0.1557 |
| 7405 | UVRAG | A001-C-108 | Human | Colorectum | FAP | 3.07e-10 | -2.90e-01 | -0.0272 |
| 7405 | UVRAG | A002-C-205 | Human | Colorectum | FAP | 2.83e-18 | -4.34e-01 | -0.1236 |
| 7405 | UVRAG | A001-C-104 | Human | Colorectum | FAP | 7.24e-05 | -2.35e-01 | 0.0184 |
| 7405 | UVRAG | A015-C-006 | Human | Colorectum | FAP | 1.39e-13 | -4.27e-01 | -0.0994 |
| 7405 | UVRAG | A015-C-106 | Human | Colorectum | FAP | 6.01e-05 | -1.93e-01 | -0.0511 |
| 7405 | UVRAG | A002-C-114 | Human | Colorectum | FAP | 1.46e-13 | -3.96e-01 | -0.1561 |
| 7405 | UVRAG | A015-C-104 | Human | Colorectum | FAP | 1.84e-26 | -4.69e-01 | -0.1899 |
| 7405 | UVRAG | A001-C-014 | Human | Colorectum | FAP | 2.87e-10 | -2.31e-01 | 0.0135 |
| 7405 | UVRAG | A002-C-016 | Human | Colorectum | FAP | 9.35e-17 | -3.32e-01 | 0.0521 |
| 7405 | UVRAG | A015-C-002 | Human | Colorectum | FAP | 3.99e-07 | -2.77e-01 | -0.0763 |
| 7405 | UVRAG | A001-C-203 | Human | Colorectum | FAP | 7.27e-05 | -2.24e-01 | -0.0481 |
| Page: 1 2 3 4 5 6 7 |
| Tissue | Expression Dynamics | Abbreviation |
| Colorectum (GSE201348) |  | FAP: Familial adenomatous polyposis |
| CRC: Colorectal cancer | ||
| Colorectum (HTA11) |  | AD: Adenomas |
| SER: Sessile serrated lesions | ||
| MSI-H: Microsatellite-high colorectal cancer | ||
| MSS: Microsatellite stable colorectal cancer | ||
| Esophagus |  | ESCC: Esophageal squamous cell carcinoma |
| HGIN: High-grade intraepithelial neoplasias | ||
| LGIN: Low-grade intraepithelial neoplasias | ||
| Liver | 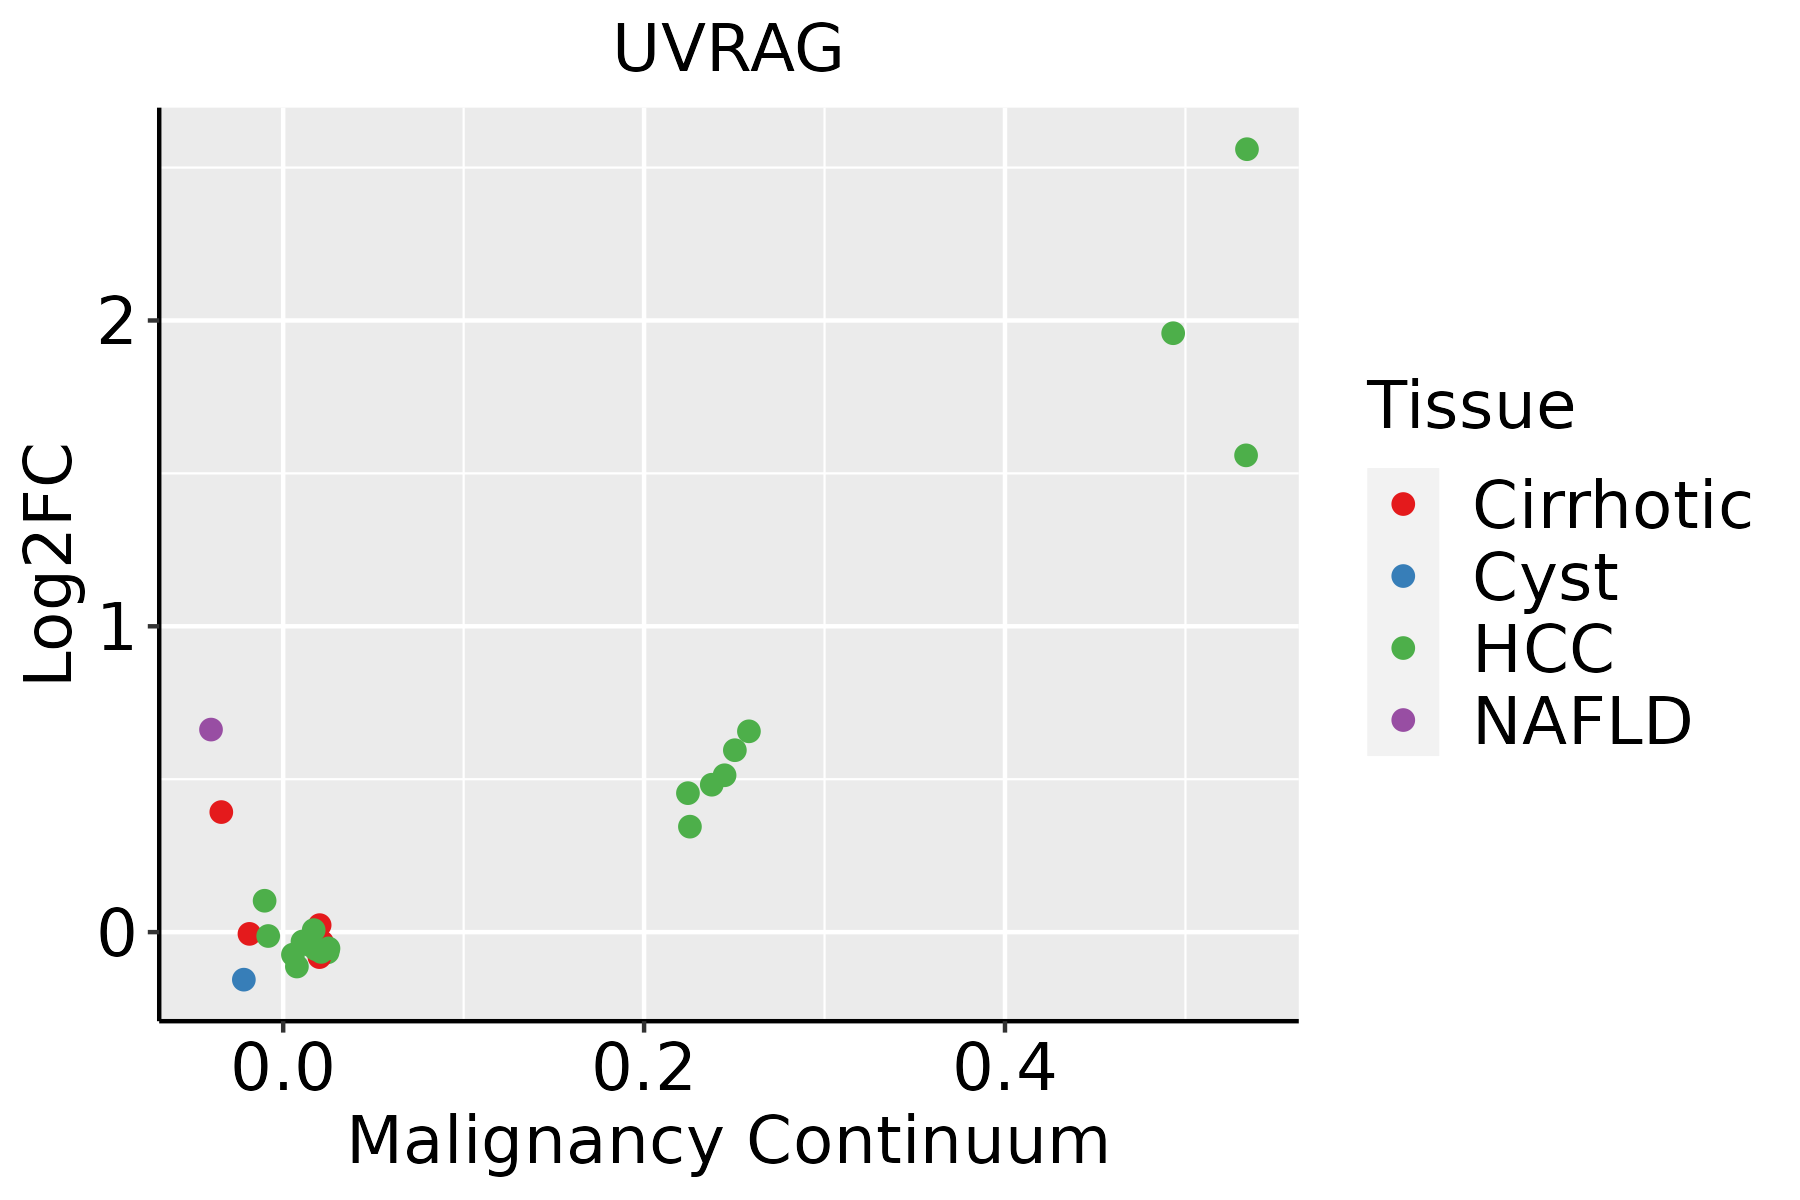 | HCC: Hepatocellular carcinoma |
| NAFLD: Non-alcoholic fatty liver disease | ||
| Lung | 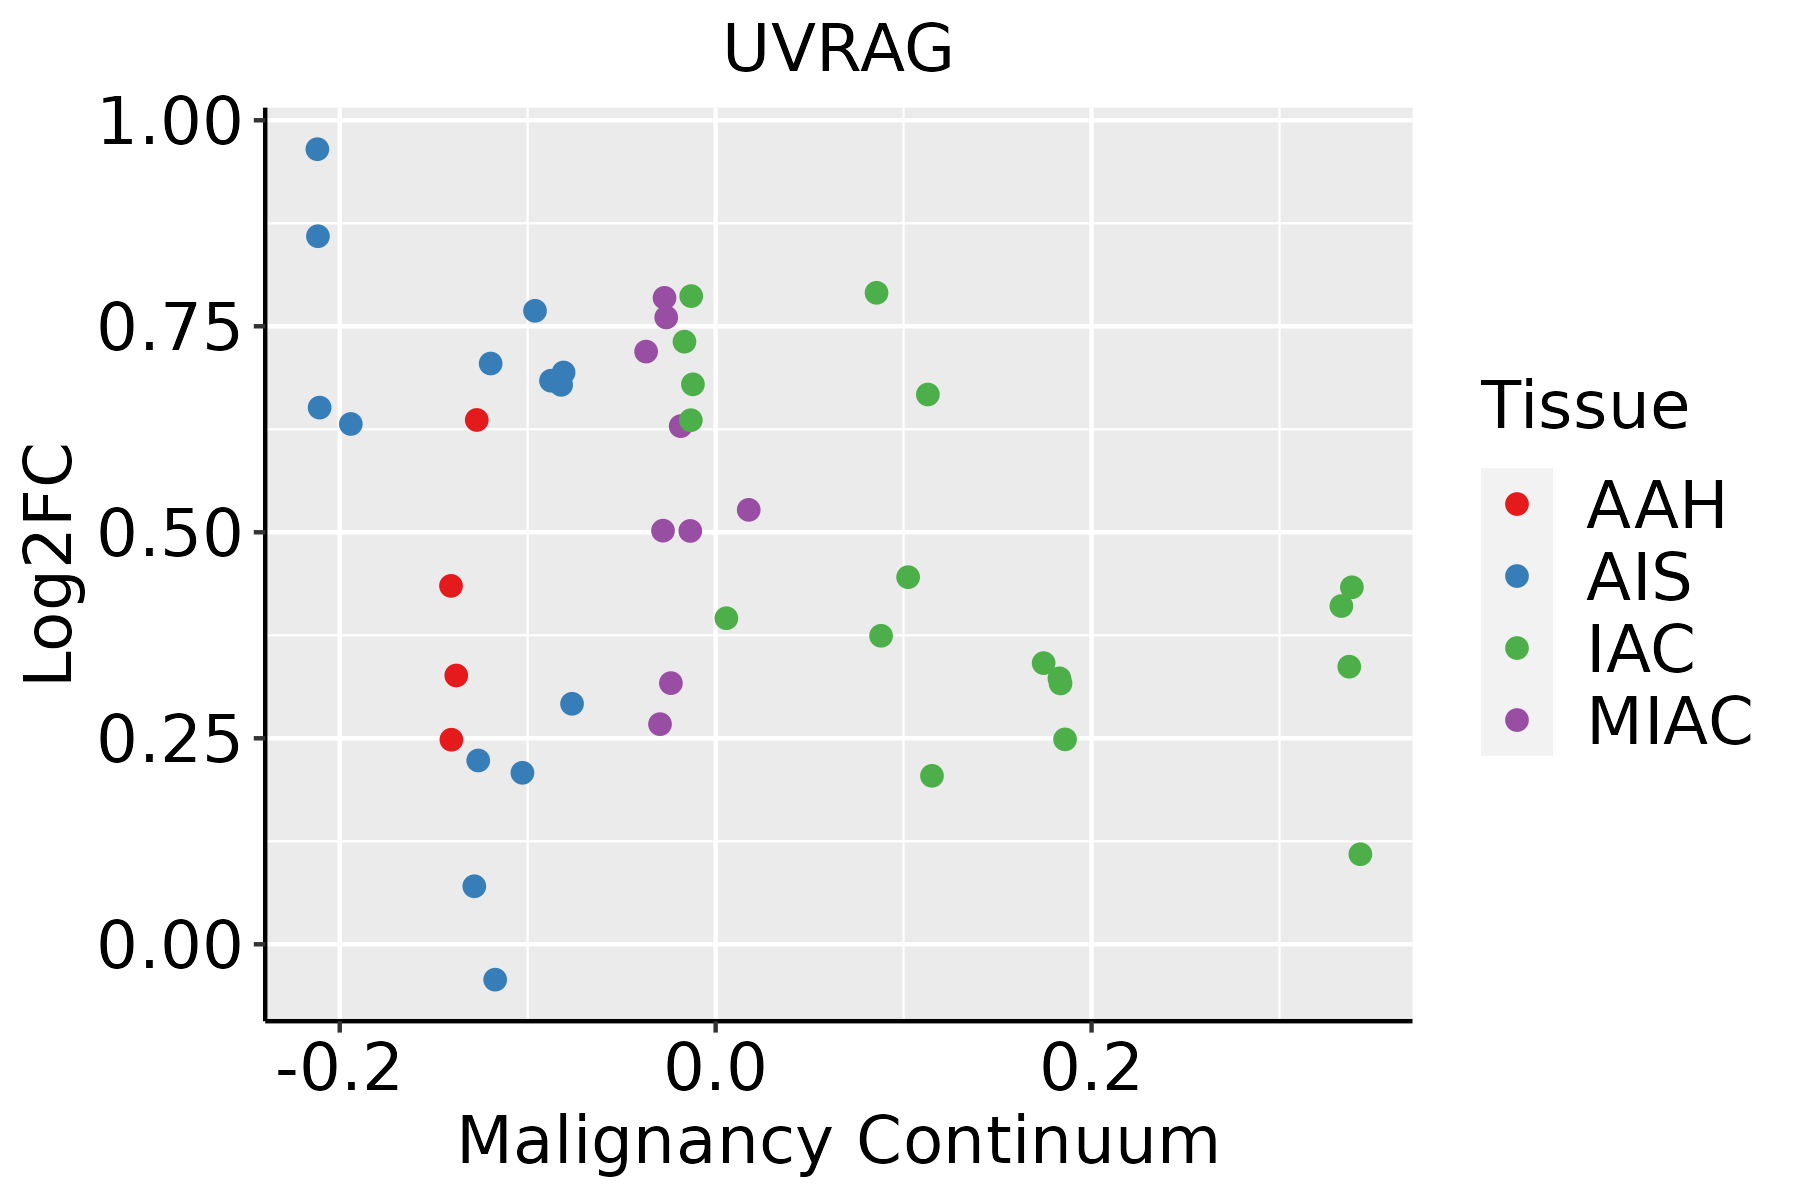 | AAH: Atypical adenomatous hyperplasia |
| AIS: Adenocarcinoma in situ | ||
| IAC: Invasive lung adenocarcinoma | ||
| MIA: Minimally invasive adenocarcinoma | ||
| Oral Cavity |  | EOLP: Erosive Oral lichen planus |
| LP: leukoplakia | ||
| NEOLP: Non-erosive oral lichen planus | ||
| OSCC: Oral squamous cell carcinoma |
| ∗log2FC in expression of this searched gene in stem-like cells from each diseased tissue sample relative to stem-like cells in normal samples in each tissue plotted against the malignancy continuum. Samples are colored based on if they are from different disease stage. |
Top |
Malignant transformation related pathway analysis |
| Find out the enriched GO biological processes and KEGG pathways involved in transition from healthy to precancer to cancer |
| Tissue | Disease Stage | Enriched GO biological Processes |
| Colorectum | AD |  |
| Colorectum | SER |  |
| Colorectum | MSS |  |
| Colorectum | MSI-H |  |
| Colorectum | FAP |  |
| ∗Top 15 enriched GO BP terms are showed in the bar plot of each disease state in each tissue. Each row represents a significant GO biological process which is colored according to the -log10(p.adjust). |
| Page: 1 2 3 4 5 6 7 8 9 |
| GO ID | Tissue | Disease Stage | Description | Gene Ratio | Bg Ratio | pvalue | p.adjust | Count |
| GO:0016032 | Colorectum | AD | viral process | 168/3918 | 415/18723 | 4.67e-20 | 3.66e-17 | 168 |
| GO:0009896 | Colorectum | AD | positive regulation of catabolic process | 180/3918 | 492/18723 | 4.33e-16 | 1.94e-13 | 180 |
| GO:0031331 | Colorectum | AD | positive regulation of cellular catabolic process | 156/3918 | 427/18723 | 4.68e-14 | 1.05e-11 | 156 |
| GO:0019058 | Colorectum | AD | viral life cycle | 119/3918 | 317/18723 | 6.18e-12 | 8.23e-10 | 119 |
| GO:0048193 | Colorectum | AD | Golgi vesicle transport | 109/3918 | 296/18723 | 1.80e-10 | 1.68e-08 | 109 |
| GO:0022411 | Colorectum | AD | cellular component disassembly | 147/3918 | 443/18723 | 8.53e-10 | 6.76e-08 | 147 |
| GO:0010506 | Colorectum | AD | regulation of autophagy | 111/3918 | 317/18723 | 3.57e-09 | 2.35e-07 | 111 |
| GO:0016236 | Colorectum | AD | macroautophagy | 103/3918 | 291/18723 | 6.76e-09 | 4.15e-07 | 103 |
| GO:0032984 | Colorectum | AD | protein-containing complex disassembly | 81/3918 | 224/18723 | 9.41e-08 | 4.65e-06 | 81 |
| GO:0044403 | Colorectum | AD | biological process involved in symbiotic interaction | 99/3918 | 290/18723 | 1.02e-07 | 4.93e-06 | 99 |
| GO:0016050 | Colorectum | AD | vesicle organization | 101/3918 | 300/18723 | 1.65e-07 | 7.17e-06 | 101 |
| GO:0051701 | Colorectum | AD | biological process involved in interaction with host | 73/3918 | 203/18723 | 5.08e-07 | 1.88e-05 | 73 |
| GO:0006890 | Colorectum | AD | retrograde vesicle-mediated transport, Golgi to endoplasmic reticulum | 27/3918 | 52/18723 | 7.67e-07 | 2.70e-05 | 27 |
| GO:0043112 | Colorectum | AD | receptor metabolic process | 62/3918 | 166/18723 | 8.18e-07 | 2.85e-05 | 62 |
| GO:0052126 | Colorectum | AD | movement in host environment | 63/3918 | 175/18723 | 2.85e-06 | 8.11e-05 | 63 |
| GO:0000910 | Colorectum | AD | cytokinesis | 59/3918 | 173/18723 | 3.74e-05 | 6.75e-04 | 59 |
| GO:0046718 | Colorectum | AD | viral entry into host cell | 51/3918 | 144/18723 | 3.99e-05 | 7.16e-04 | 51 |
| GO:0071985 | Colorectum | AD | multivesicular body sorting pathway | 19/3918 | 37/18723 | 4.08e-05 | 7.26e-04 | 19 |
| GO:0016241 | Colorectum | AD | regulation of macroautophagy | 50/3918 | 141/18723 | 4.55e-05 | 7.92e-04 | 50 |
| GO:0044409 | Colorectum | AD | entry into host | 51/3918 | 151/18723 | 1.60e-04 | 2.21e-03 | 51 |
| Page: 1 2 3 4 5 6 7 8 9 10 11 12 13 14 15 16 17 18 19 |
| Pathway ID | Tissue | Disease Stage | Description | Gene Ratio | Bg Ratio | pvalue | p.adjust | qvalue | Count |
| hsa04140 | Colorectum | AD | Autophagy - animal | 49/2092 | 141/8465 | 4.58e-03 | 2.20e-02 | 1.40e-02 | 49 |
| hsa041401 | Colorectum | AD | Autophagy - animal | 49/2092 | 141/8465 | 4.58e-03 | 2.20e-02 | 1.40e-02 | 49 |
| hsa0414010 | Esophagus | ESCC | Autophagy - animal | 101/4205 | 141/8465 | 7.60e-08 | 6.21e-07 | 3.18e-07 | 101 |
| hsa0414015 | Esophagus | ESCC | Autophagy - animal | 101/4205 | 141/8465 | 7.60e-08 | 6.21e-07 | 3.18e-07 | 101 |
| hsa0414021 | Liver | HCC | Autophagy - animal | 99/4020 | 141/8465 | 3.08e-08 | 4.70e-07 | 2.61e-07 | 99 |
| hsa0414031 | Liver | HCC | Autophagy - animal | 99/4020 | 141/8465 | 3.08e-08 | 4.70e-07 | 2.61e-07 | 99 |
| hsa041407 | Lung | IAC | Autophagy - animal | 28/1053 | 141/8465 | 7.64e-03 | 3.03e-02 | 2.01e-02 | 28 |
| hsa0414012 | Lung | IAC | Autophagy - animal | 28/1053 | 141/8465 | 7.64e-03 | 3.03e-02 | 2.01e-02 | 28 |
| hsa0414022 | Lung | AIS | Autophagy - animal | 26/961 | 141/8465 | 8.23e-03 | 3.71e-02 | 2.37e-02 | 26 |
| hsa0414032 | Lung | AIS | Autophagy - animal | 26/961 | 141/8465 | 8.23e-03 | 3.71e-02 | 2.37e-02 | 26 |
| hsa041409 | Oral cavity | OSCC | Autophagy - animal | 94/3704 | 141/8465 | 2.73e-08 | 2.38e-07 | 1.21e-07 | 94 |
| hsa0414014 | Oral cavity | OSCC | Autophagy - animal | 94/3704 | 141/8465 | 2.73e-08 | 2.38e-07 | 1.21e-07 | 94 |
| hsa0414041 | Oral cavity | EOLP | Autophagy - animal | 39/1218 | 141/8465 | 2.68e-05 | 1.38e-04 | 8.12e-05 | 39 |
| hsa0414051 | Oral cavity | EOLP | Autophagy - animal | 39/1218 | 141/8465 | 2.68e-05 | 1.38e-04 | 8.12e-05 | 39 |
| hsa0414061 | Oral cavity | NEOLP | Autophagy - animal | 32/1112 | 141/8465 | 1.17e-03 | 5.56e-03 | 3.49e-03 | 32 |
| hsa0414071 | Oral cavity | NEOLP | Autophagy - animal | 32/1112 | 141/8465 | 1.17e-03 | 5.56e-03 | 3.49e-03 | 32 |
| Page: 1 |
Top |
Cell-cell communication analysis |
| Identification of potential cell-cell interactions between two cell types and their ligand-receptor pairs for different disease states |
| Ligand | Receptor | LRpair | Pathway | Tissue | Disease Stage |
| Page: 1 |
Top |
Single-cell gene regulatory network inference analysis |
| Find out the significant the regulons (TFs) and the target genes of each regulon across cell types for different disease states |
| TF | Cell Type | Tissue | Disease Stage | Target Gene | RSS | Regulon Activity |
| ∗The dot plots of a searched regulon are shown for all cell subpopulations in each disease state of each tissue based on the regulon specific score inferred using pySCENIC and by calculating the average expression. |
| Page: 1 |
Top |
Somatic mutation of malignant transformation related genes |
| Annotation of somatic variants for genes involved in malignant transformation |
| Hugo Symbol | Variant Class | Variant Classification | dbSNP RS | HGVSc | HGVSp | HGVSp Short | SWISSPROT | BIOTYPE | SIFT | PolyPhen | Tumor Sample Barcode | Tissue | Histology | Sex | Age | Stage | Therapy Types | Drugs | Outcome |
| UVRAG | SNV | Missense_Mutation | c.584N>T | p.Ser195Phe | p.S195F | Q9P2Y5 | protein_coding | deleterious(0.01) | probably_damaging(0.997) | TCGA-A7-A4SB-01 | Breast | breast invasive carcinoma | Female | <65 | III/IV | Chemotherapy | docetaxel | CR | |
| UVRAG | SNV | Missense_Mutation | c.1643N>G | p.Ser548Cys | p.S548C | Q9P2Y5 | protein_coding | deleterious_low_confidence(0.02) | benign(0.005) | TCGA-AR-A1AO-01 | Breast | breast invasive carcinoma | Female | <65 | I/II | Chemotherapy | doxorubicin | SD | |
| UVRAG | SNV | Missense_Mutation | c.274N>T | p.Pro92Ser | p.P92S | Q9P2Y5 | protein_coding | deleterious(0) | probably_damaging(1) | TCGA-E2-A159-01 | Breast | breast invasive carcinoma | Female | <65 | I/II | Chemotherapy | cyclophosphamide | SD | |
| UVRAG | SNV | Missense_Mutation | c.1189G>C | p.Asp397His | p.D397H | Q9P2Y5 | protein_coding | deleterious(0.02) | probably_damaging(0.994) | TCGA-BI-A0VR-01 | Cervix | cervical & endocervical cancer | Female | <65 | III/IV | Unknown | Unknown | SD | |
| UVRAG | SNV | Missense_Mutation | c.1108C>G | p.Leu370Val | p.L370V | Q9P2Y5 | protein_coding | deleterious(0.05) | possibly_damaging(0.906) | TCGA-C5-A2LX-01 | Cervix | cervical & endocervical cancer | Female | <65 | I/II | Chemotherapy | cisplatin | SD | |
| UVRAG | SNV | Missense_Mutation | c.650N>A | p.Gly217Glu | p.G217E | Q9P2Y5 | protein_coding | deleterious(0.04) | probably_damaging(0.975) | TCGA-RA-A741-01 | Cervix | cervical & endocervical cancer | Female | <65 | I/II | Chemotherapy | cisplatin | SD | |
| UVRAG | SNV | Missense_Mutation | novel | c.155N>G | p.Asn52Ser | p.N52S | Q9P2Y5 | protein_coding | deleterious(0.02) | probably_damaging(0.998) | TCGA-AA-3984-01 | Colorectum | colon adenocarcinoma | Female | <65 | I/II | Unknown | Unknown | SD |
| UVRAG | SNV | Missense_Mutation | c.292G>A | p.Asp98Asn | p.D98N | Q9P2Y5 | protein_coding | deleterious(0) | probably_damaging(0.995) | TCGA-CA-6718-01 | Colorectum | colon adenocarcinoma | Male | <65 | I/II | Unknown | Unknown | PD | |
| UVRAG | SNV | Missense_Mutation | c.1154N>A | p.Pro385His | p.P385H | Q9P2Y5 | protein_coding | deleterious(0) | probably_damaging(0.982) | TCGA-G4-6309-01 | Colorectum | colon adenocarcinoma | Female | <65 | III/IV | Chemotherapy | xeloda | PD | |
| UVRAG | SNV | Missense_Mutation | c.225N>T | p.Lys75Asn | p.K75N | Q9P2Y5 | protein_coding | tolerated(0.37) | benign(0.085) | TCGA-AG-3892-01 | Colorectum | rectum adenocarcinoma | Female | <65 | I/II | Unknown | Unknown | SD |
| Page: 1 2 3 4 5 6 7 8 |
Top |
Related drugs of malignant transformation related genes |
| Identification of chemicals and drugs interact with genes involved in malignant transfromation |
| (DGIdb 4.0) |
| Entrez ID | Symbol | Category | Interaction Types | Drug Claim Name | Drug Name | PMIDs |
| Page: 1 |

Copyright 2023-Present -The University of Texas Health Science Center at Houston |