
|
|||||
|
 | |
| |
| |
| |
| |
| |
|
Gene: UTP25 |
Gene summary for UTP25 |
| Gene information | Species | Human | Gene symbol | UTP25 | Gene ID | 27042 |
| Gene name | UTP25 small subunit processor component | |
| Gene Alias | C1orf107 | |
| Cytomap | 1q32.2 | |
| Gene Type | protein-coding | GO ID | GO:0000462 | UniProtAcc | Q68CQ4 |
Top |
Malignant transformation analysis |
| Identification of the aberrant gene expression in precancerous and cancerous lesions by comparing the gene expression of stem-like cells in diseased tissues with normal stem cells |
| Entrez ID | Symbol | Replicates | Species | Organ | Tissue | Adj P-value | Log2FC | Malignancy |
| 27042 | UTP25 | S014 | Human | Liver | HCC | 7.28e-17 | 4.22e-01 | 0.2254 |
| 27042 | UTP25 | S015 | Human | Liver | HCC | 6.57e-16 | 4.85e-01 | 0.2375 |
| 27042 | UTP25 | S016 | Human | Liver | HCC | 7.78e-18 | 4.75e-01 | 0.2243 |
| 27042 | UTP25 | S027 | Human | Liver | HCC | 7.31e-13 | 6.77e-01 | 0.2446 |
| 27042 | UTP25 | S028 | Human | Liver | HCC | 7.20e-30 | 7.54e-01 | 0.2503 |
| 27042 | UTP25 | S029 | Human | Liver | HCC | 2.32e-23 | 7.27e-01 | 0.2581 |
| 27042 | UTP25 | male-WTA | Human | Thyroid | PTC | 1.28e-06 | 1.01e-01 | 0.1037 |
| 27042 | UTP25 | PTC01 | Human | Thyroid | PTC | 2.66e-05 | 8.39e-02 | 0.1899 |
| 27042 | UTP25 | PTC05 | Human | Thyroid | PTC | 3.81e-05 | 2.36e-01 | 0.2065 |
| 27042 | UTP25 | PTC06 | Human | Thyroid | PTC | 1.25e-13 | 3.04e-01 | 0.2057 |
| 27042 | UTP25 | PTC07 | Human | Thyroid | PTC | 5.96e-08 | 2.18e-01 | 0.2044 |
| 27042 | UTP25 | ATC12 | Human | Thyroid | ATC | 5.71e-10 | 2.02e-01 | 0.34 |
| 27042 | UTP25 | ATC13 | Human | Thyroid | ATC | 3.28e-16 | 2.53e-01 | 0.34 |
| 27042 | UTP25 | ATC2 | Human | Thyroid | ATC | 3.71e-05 | 5.38e-01 | 0.34 |
| 27042 | UTP25 | ATC4 | Human | Thyroid | ATC | 3.54e-13 | 2.54e-01 | 0.34 |
| 27042 | UTP25 | ATC5 | Human | Thyroid | ATC | 1.13e-11 | 2.79e-01 | 0.34 |
| Page: 1 |
| Tissue | Expression Dynamics | Abbreviation |
| Liver | 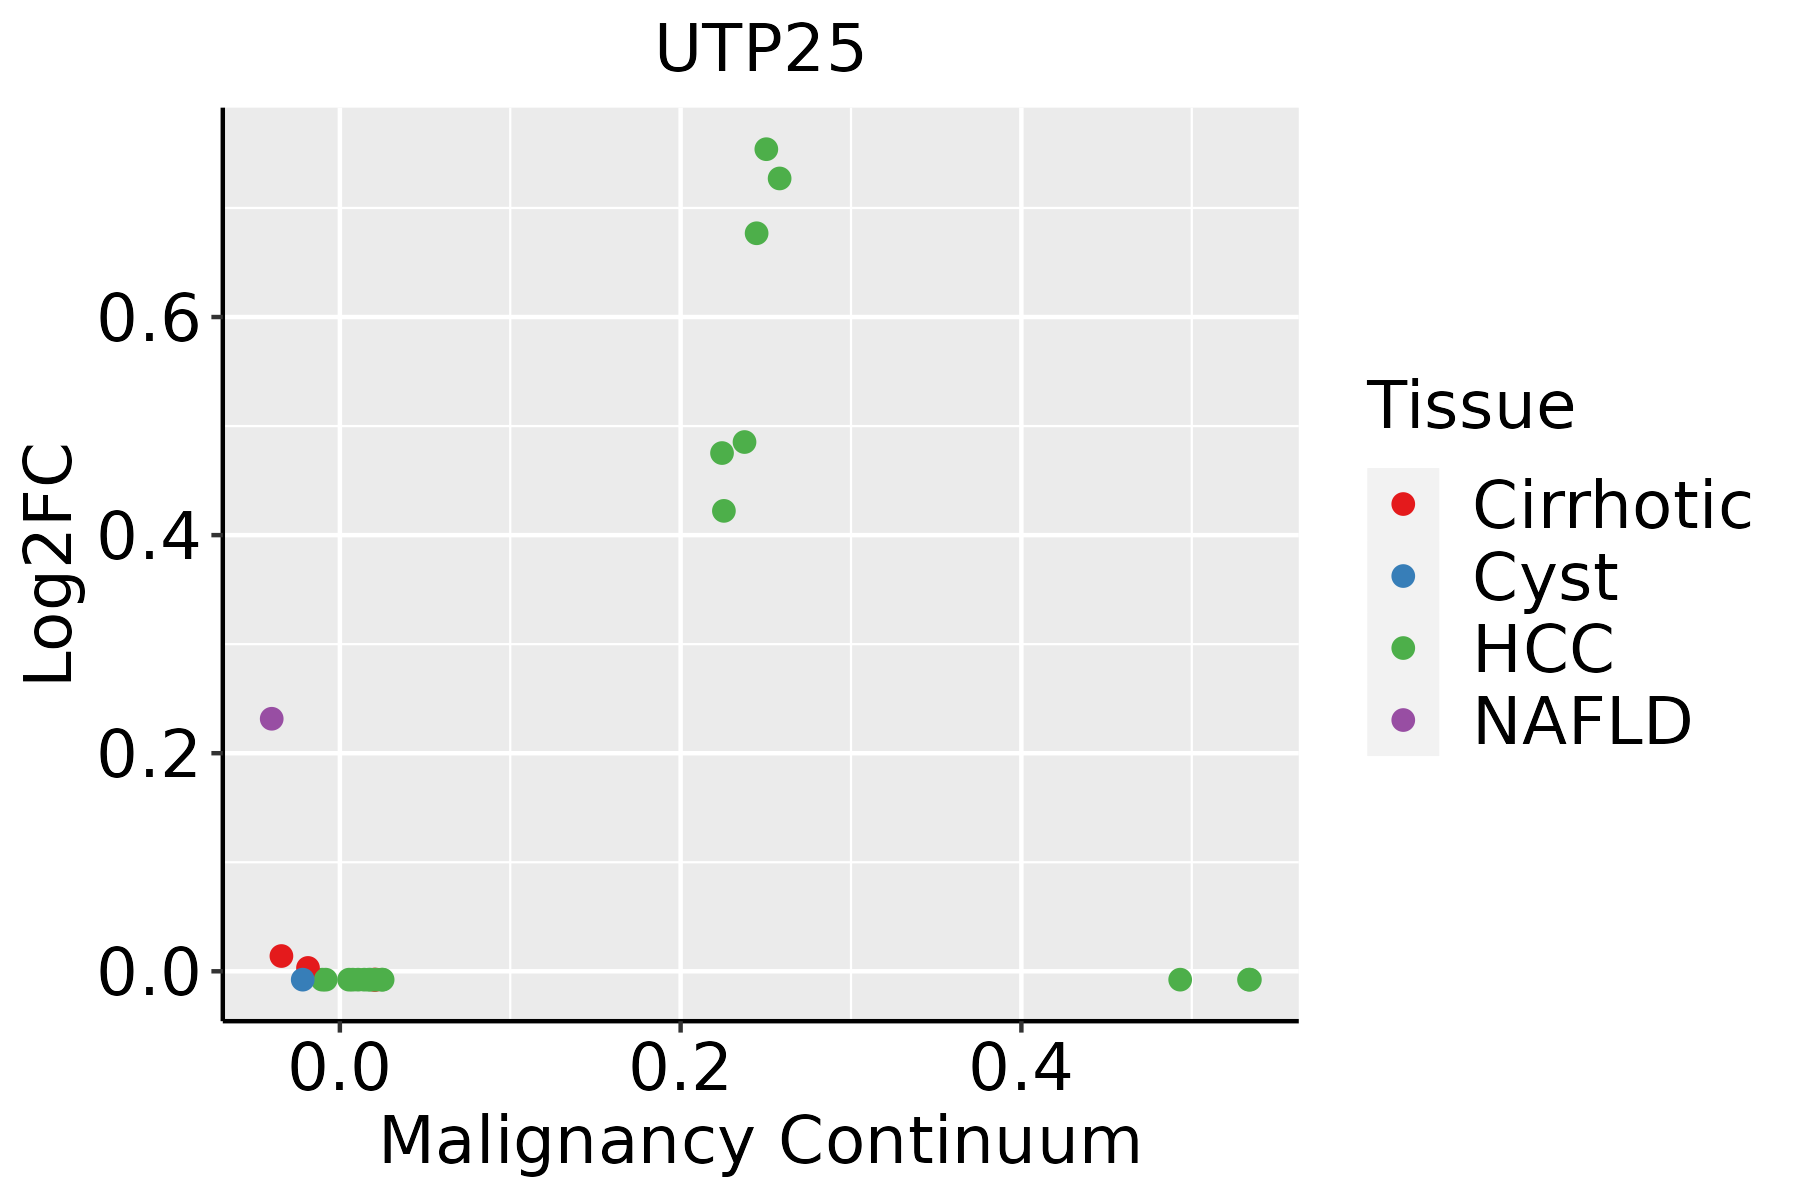 | HCC: Hepatocellular carcinoma |
| NAFLD: Non-alcoholic fatty liver disease | ||
| Thyroid | 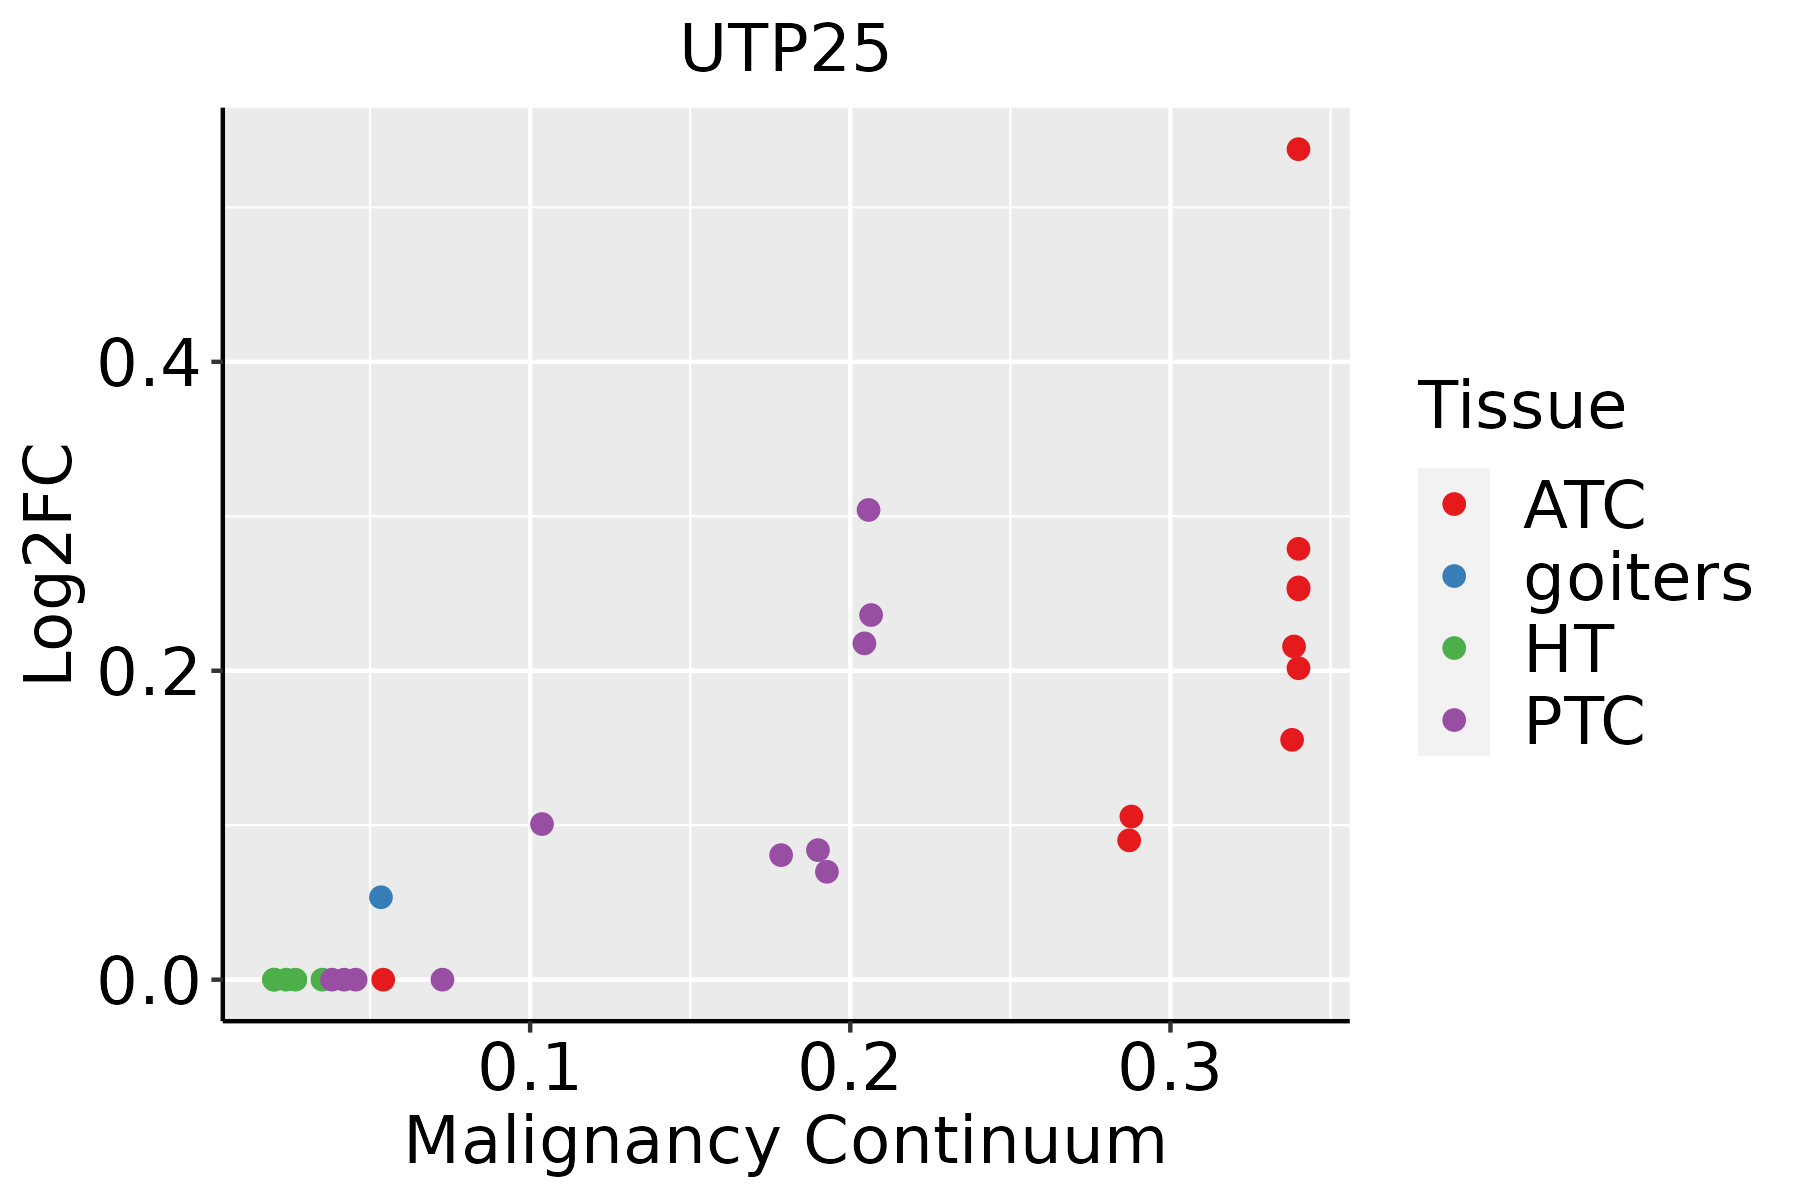 | ATC: Anaplastic thyroid cancer |
| HT: Hashimoto's thyroiditis | ||
| PTC: Papillary thyroid cancer |
| ∗log2FC in expression of this searched gene in stem-like cells from each diseased tissue sample relative to stem-like cells in normal samples in each tissue plotted against the malignancy continuum. Samples are colored based on if they are from different disease stage. |
Top |
Malignant transformation related pathway analysis |
| Find out the enriched GO biological processes and KEGG pathways involved in transition from healthy to precancer to cancer |
| Tissue | Disease Stage | Enriched GO biological Processes |
| Colorectum | AD |  |
| Colorectum | SER |  |
| Colorectum | MSS |  |
| Colorectum | MSI-H |  |
| Colorectum | FAP |  |
| ∗Top 15 enriched GO BP terms are showed in the bar plot of each disease state in each tissue. Each row represents a significant GO biological process which is colored according to the -log10(p.adjust). |
| Page: 1 2 3 4 5 6 7 8 9 |
| GO ID | Tissue | Disease Stage | Description | Gene Ratio | Bg Ratio | pvalue | p.adjust | Count |
| GO:002261322 | Liver | HCC | ribonucleoprotein complex biogenesis | 355/7958 | 463/18723 | 7.76e-52 | 4.92e-48 | 355 |
| GO:004225422 | Liver | HCC | ribosome biogenesis | 246/7958 | 299/18723 | 4.99e-46 | 1.58e-42 | 246 |
| GO:00344702 | Liver | HCC | ncRNA processing | 293/7958 | 395/18723 | 4.26e-38 | 6.76e-35 | 293 |
| GO:001607212 | Liver | HCC | rRNA metabolic process | 193/7958 | 236/18723 | 1.26e-35 | 1.14e-32 | 193 |
| GO:000636421 | Liver | HCC | rRNA processing | 185/7958 | 225/18723 | 8.14e-35 | 6.45e-32 | 185 |
| GO:00346601 | Liver | HCC | ncRNA metabolic process | 332/7958 | 485/18723 | 1.48e-31 | 7.80e-29 | 332 |
| GO:003164722 | Liver | HCC | regulation of protein stability | 211/7958 | 298/18723 | 2.29e-23 | 5.01e-21 | 211 |
| GO:003450421 | Liver | HCC | protein localization to nucleus | 194/7958 | 290/18723 | 2.84e-17 | 2.85e-15 | 194 |
| GO:004227422 | Liver | HCC | ribosomal small subunit biogenesis | 65/7958 | 73/18723 | 1.09e-16 | 9.92e-15 | 65 |
| GO:00304901 | Liver | HCC | maturation of SSU-rRNA | 43/7958 | 50/18723 | 2.35e-10 | 8.04e-09 | 43 |
| GO:00004621 | Liver | HCC | maturation of SSU-rRNA from tricistronic rRNA transcript (SSU-rRNA, 5.8S rRNA, LSU-rRNA) | 30/7958 | 37/18723 | 1.78e-06 | 2.48e-05 | 30 |
| GO:19025701 | Liver | HCC | protein localization to nucleolus | 13/7958 | 16/18723 | 1.84e-03 | 9.42e-03 | 13 |
| GO:00316482 | Liver | HCC | protein destabilization | 29/7958 | 46/18723 | 3.95e-03 | 1.74e-02 | 29 |
| GO:0022613113 | Thyroid | PTC | ribonucleoprotein complex biogenesis | 292/5968 | 463/18723 | 3.24e-44 | 2.05e-40 | 292 |
| GO:0042254113 | Thyroid | PTC | ribosome biogenesis | 202/5968 | 299/18723 | 3.47e-37 | 5.47e-34 | 202 |
| GO:0006364112 | Thyroid | PTC | rRNA processing | 156/5968 | 225/18723 | 5.58e-31 | 5.03e-28 | 156 |
| GO:0016072112 | Thyroid | PTC | rRNA metabolic process | 160/5968 | 236/18723 | 5.68e-30 | 3.58e-27 | 160 |
| GO:0031647113 | Thyroid | PTC | regulation of protein stability | 174/5968 | 298/18723 | 2.05e-21 | 4.05e-19 | 174 |
| GO:0034504111 | Thyroid | PTC | protein localization to nucleus | 170/5968 | 290/18723 | 3.34e-21 | 6.38e-19 | 170 |
| GO:003447018 | Thyroid | PTC | ncRNA processing | 215/5968 | 395/18723 | 7.14e-21 | 1.22e-18 | 215 |
| Page: 1 2 |
| Pathway ID | Tissue | Disease Stage | Description | Gene Ratio | Bg Ratio | pvalue | p.adjust | qvalue | Count |
| Page: 1 |
Top |
Cell-cell communication analysis |
| Identification of potential cell-cell interactions between two cell types and their ligand-receptor pairs for different disease states |
| Ligand | Receptor | LRpair | Pathway | Tissue | Disease Stage |
| Page: 1 |
Top |
Single-cell gene regulatory network inference analysis |
| Find out the significant the regulons (TFs) and the target genes of each regulon across cell types for different disease states |
| TF | Cell Type | Tissue | Disease Stage | Target Gene | RSS | Regulon Activity |
| ∗The dot plots of a searched regulon are shown for all cell subpopulations in each disease state of each tissue based on the regulon specific score inferred using pySCENIC and by calculating the average expression. |
| Page: 1 |
Top |
Somatic mutation of malignant transformation related genes |
| Annotation of somatic variants for genes involved in malignant transformation |
| Hugo Symbol | Variant Class | Variant Classification | dbSNP RS | HGVSc | HGVSp | HGVSp Short | SWISSPROT | BIOTYPE | SIFT | PolyPhen | Tumor Sample Barcode | Tissue | Histology | Sex | Age | Stage | Therapy Types | Drugs | Outcome |
| Page: 1 |
Top |
Related drugs of malignant transformation related genes |
| Identification of chemicals and drugs interact with genes involved in malignant transfromation |
| (DGIdb 4.0) |
| Entrez ID | Symbol | Category | Interaction Types | Drug Claim Name | Drug Name | PMIDs |
| Page: 1 |

Copyright 2023-Present -The University of Texas Health Science Center at Houston |