
|
|||||
|
 | |
| |
| |
| |
| |
| |
|
Gene: UTP14C |
Gene summary for UTP14C |
| Gene information | Species | Human | Gene symbol | UTP14C | Gene ID | 9724 |
| Gene name | UTP14C small subunit processome component | |
| Gene Alias | 2700066J21Rik | |
| Cytomap | 13q14.3 | |
| Gene Type | protein-coding | GO ID | GO:0000003 | UniProtAcc | A0A024RDV0 |
Top |
Malignant transformation analysis |
| Identification of the aberrant gene expression in precancerous and cancerous lesions by comparing the gene expression of stem-like cells in diseased tissues with normal stem cells |
| Entrez ID | Symbol | Replicates | Species | Organ | Tissue | Adj P-value | Log2FC | Malignancy |
| 9724 | UTP14C | HCC1_Meng | Human | Liver | HCC | 8.84e-36 | 5.86e-02 | 0.0246 |
| 9724 | UTP14C | HCC2_Meng | Human | Liver | HCC | 1.30e-15 | 1.29e-01 | 0.0107 |
| 9724 | UTP14C | HCC1 | Human | Liver | HCC | 2.12e-12 | 3.89e+00 | 0.5336 |
| 9724 | UTP14C | HCC2 | Human | Liver | HCC | 1.37e-16 | 2.99e+00 | 0.5341 |
| 9724 | UTP14C | S028 | Human | Liver | HCC | 2.17e-03 | 3.35e-01 | 0.2503 |
| 9724 | UTP14C | S029 | Human | Liver | HCC | 2.99e-04 | 3.71e-01 | 0.2581 |
| 9724 | UTP14C | Dong_P1 | Human | Prostate | Tumor | 2.45e-07 | 7.91e-02 | 0.035 |
| 9724 | UTP14C | Dong_P3 | Human | Prostate | Tumor | 2.09e-08 | 1.26e-01 | 0.0278 |
| 9724 | UTP14C | Dong_P4 | Human | Prostate | Tumor | 9.87e-03 | 9.60e-02 | 0.0292 |
| 9724 | UTP14C | GSM5353215_PA_AUG_PB_1B_S2 | Human | Prostate | Tumor | 4.40e-03 | 5.23e-01 | 0.1557 |
| 9724 | UTP14C | GSM5353216_PA_PB1A_Pool_1_3_S50_L002 | Human | Prostate | Tumor | 7.14e-06 | 5.77e-01 | 0.159 |
| 9724 | UTP14C | GSM5353221_PA_PB2A_Pool_1_3_S25_L001 | Human | Prostate | Tumor | 2.76e-07 | 3.34e-01 | 0.1633 |
| 9724 | UTP14C | GSM5353222_PA_PB2B_Pool_1_3_S52_L002 | Human | Prostate | Tumor | 2.98e-16 | 5.25e-01 | 0.1608 |
| 9724 | UTP14C | GSM5353223_PA_PB2B_Pool_2_S26_L001 | Human | Prostate | Tumor | 2.90e-14 | 4.98e-01 | 0.1604 |
| 9724 | UTP14C | GSM5353224_PA_PR5186_Pool_1_2_3_S27_L001 | Human | Prostate | Tumor | 7.89e-08 | 3.55e-01 | 0.1621 |
| 9724 | UTP14C | GSM5353225_PA_PR5196-1_Pool_1_2_3_S53_L002 | Human | Prostate | Tumor | 3.06e-05 | 4.65e-01 | 0.1619 |
| 9724 | UTP14C | GSM5353227_PA_PR5199-193K_Pool_1_2_3_S55_L002 | Human | Prostate | Tumor | 8.34e-05 | 3.14e-01 | 0.1602 |
| 9724 | UTP14C | GSM5353236_PA_PR5251_T1_S7_L001 | Human | Prostate | Tumor | 5.78e-05 | 4.13e-01 | 0.1608 |
| 9724 | UTP14C | GSM5353237_PA_PR5251_T2_S8_L001 | Human | Prostate | Tumor | 1.86e-05 | 4.83e-01 | 0.1622 |
| 9724 | UTP14C | GSM5353240_PA_PR5254_T1_S15_L001 | Human | Prostate | Tumor | 6.06e-08 | 3.46e-01 | 0.1575 |
| Page: 1 2 |
| Tissue | Expression Dynamics | Abbreviation |
| Liver | 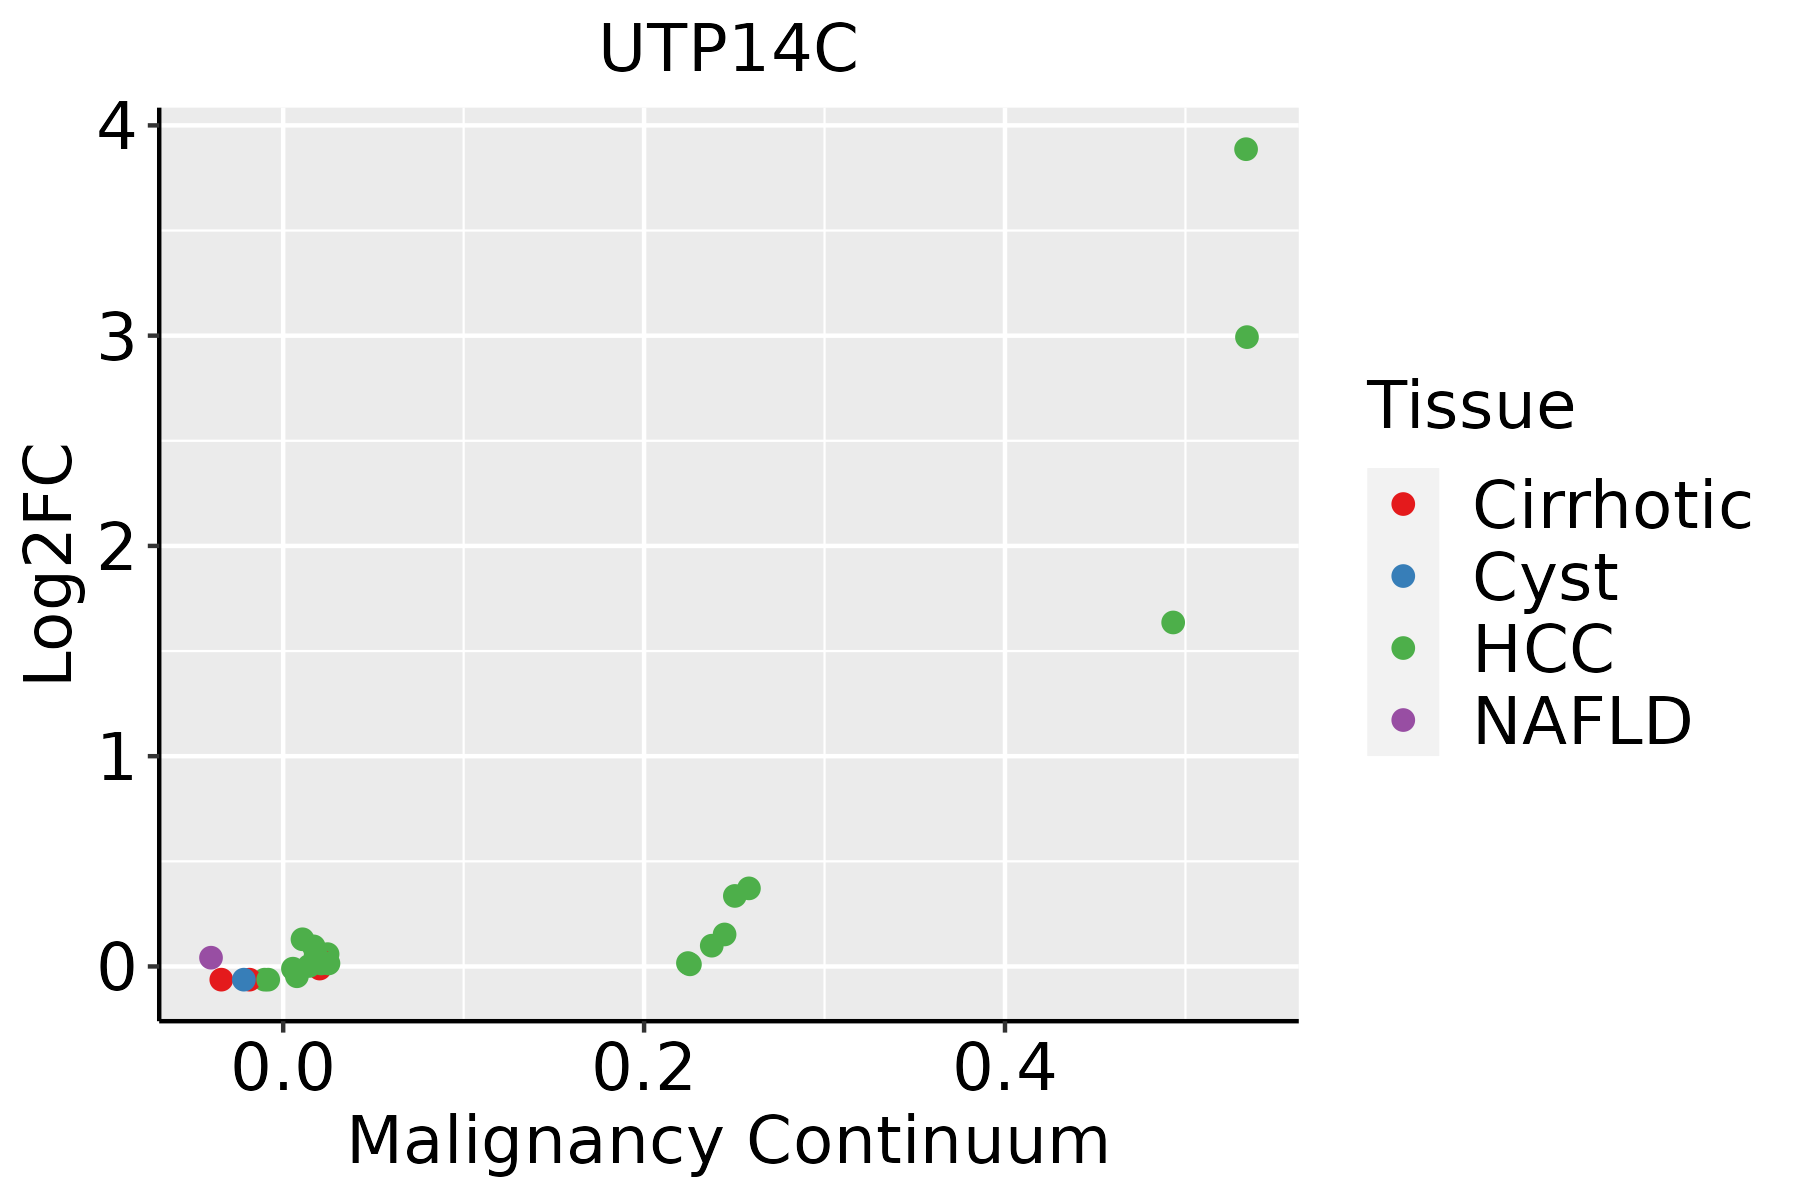 | HCC: Hepatocellular carcinoma |
| NAFLD: Non-alcoholic fatty liver disease | ||
| Prostate | 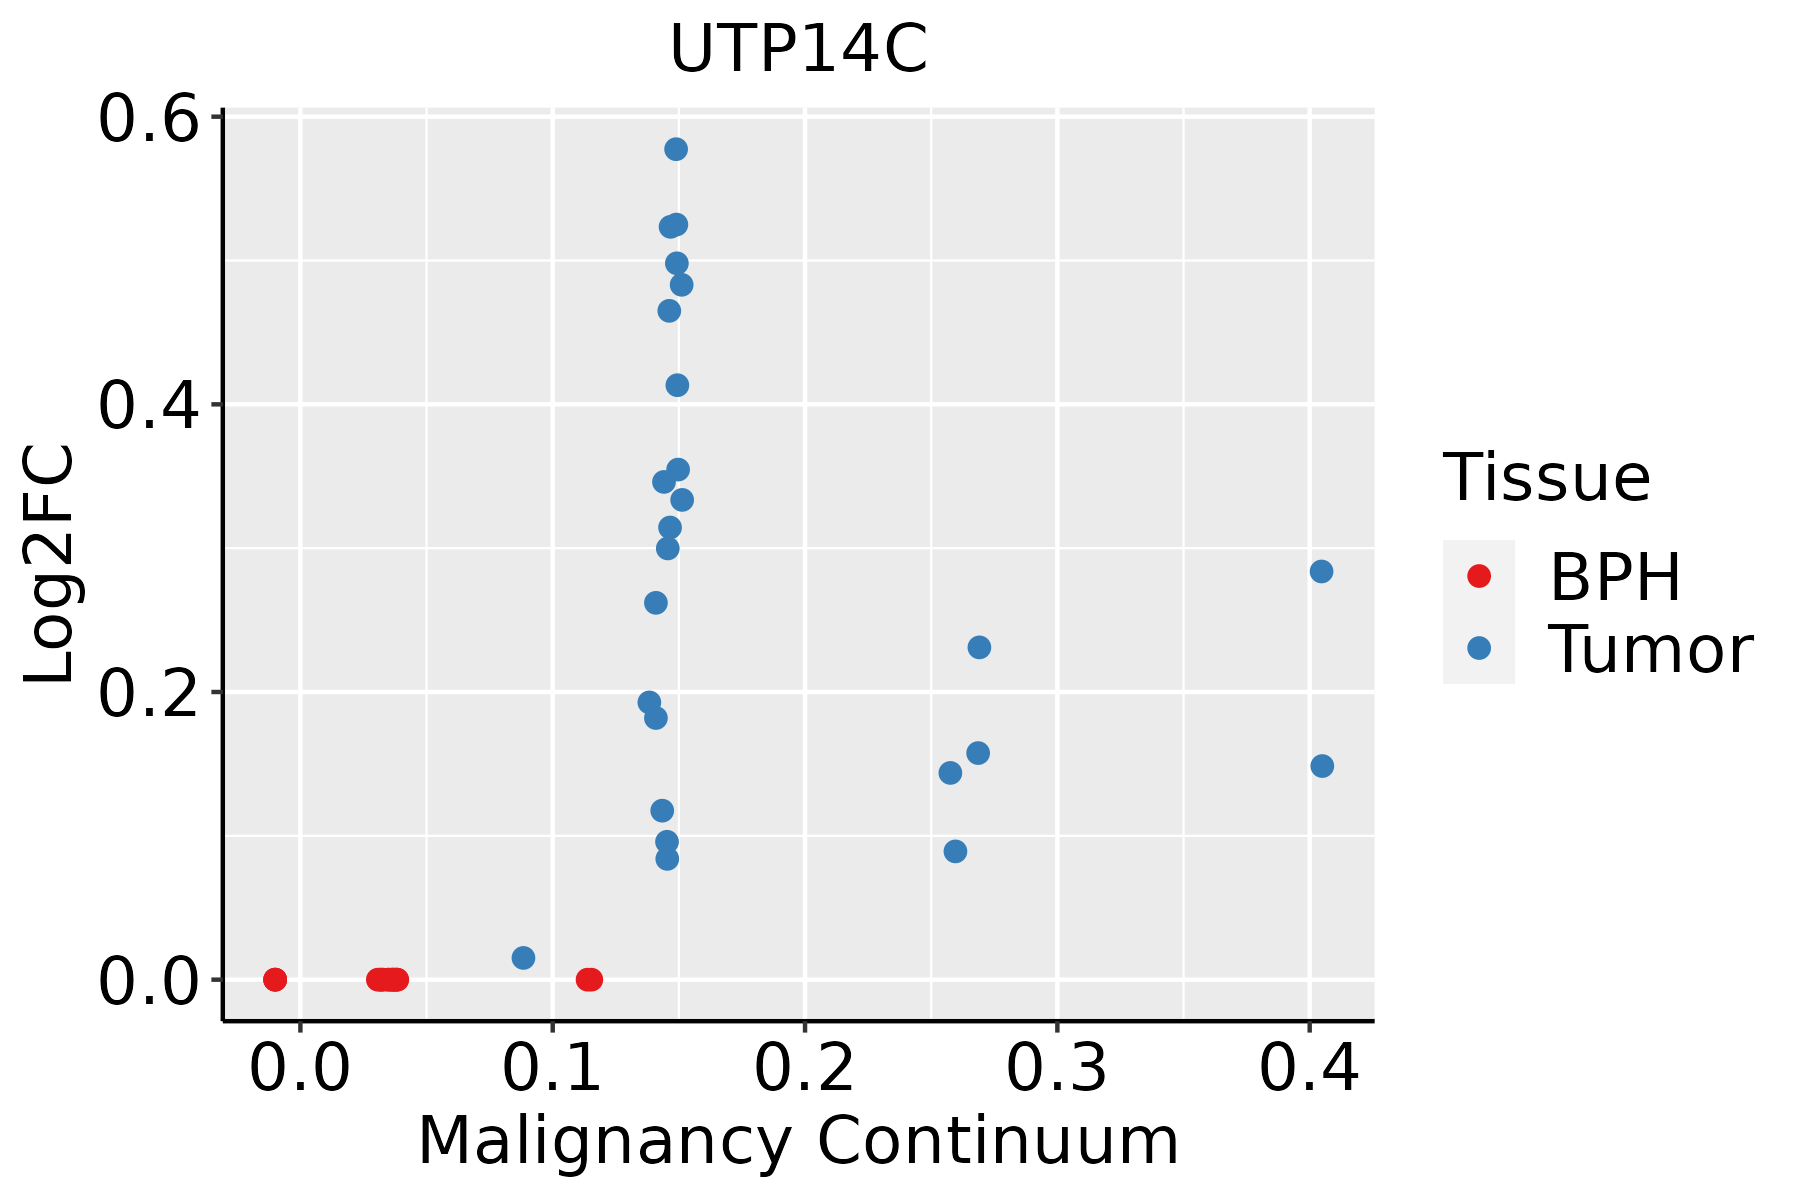 | BPH: Benign Prostatic Hyperplasia |
| ∗log2FC in expression of this searched gene in stem-like cells from each diseased tissue sample relative to stem-like cells in normal samples in each tissue plotted against the malignancy continuum. Samples are colored based on if they are from different disease stage. |
Top |
Malignant transformation related pathway analysis |
| Find out the enriched GO biological processes and KEGG pathways involved in transition from healthy to precancer to cancer |
| Tissue | Disease Stage | Enriched GO biological Processes |
| Colorectum | AD |  |
| Colorectum | SER |  |
| Colorectum | MSS |  |
| Colorectum | MSI-H |  |
| Colorectum | FAP |  |
| ∗Top 15 enriched GO BP terms are showed in the bar plot of each disease state in each tissue. Each row represents a significant GO biological process which is colored according to the -log10(p.adjust). |
| Page: 1 2 3 4 5 6 7 8 9 |
| GO ID | Tissue | Disease Stage | Description | Gene Ratio | Bg Ratio | pvalue | p.adjust | Count |
| GO:002261322 | Liver | HCC | ribonucleoprotein complex biogenesis | 355/7958 | 463/18723 | 7.76e-52 | 4.92e-48 | 355 |
| GO:004225422 | Liver | HCC | ribosome biogenesis | 246/7958 | 299/18723 | 4.99e-46 | 1.58e-42 | 246 |
| GO:00344702 | Liver | HCC | ncRNA processing | 293/7958 | 395/18723 | 4.26e-38 | 6.76e-35 | 293 |
| GO:001607212 | Liver | HCC | rRNA metabolic process | 193/7958 | 236/18723 | 1.26e-35 | 1.14e-32 | 193 |
| GO:000636421 | Liver | HCC | rRNA processing | 185/7958 | 225/18723 | 8.14e-35 | 6.45e-32 | 185 |
| GO:00346601 | Liver | HCC | ncRNA metabolic process | 332/7958 | 485/18723 | 1.48e-31 | 7.80e-29 | 332 |
| GO:002261319 | Prostate | Tumor | ribonucleoprotein complex biogenesis | 159/3246 | 463/18723 | 3.17e-19 | 1.52e-16 | 159 |
| GO:004225419 | Prostate | Tumor | ribosome biogenesis | 96/3246 | 299/18723 | 2.76e-10 | 1.51e-08 | 96 |
| GO:000636417 | Prostate | Tumor | rRNA processing | 69/3246 | 225/18723 | 5.98e-07 | 1.26e-05 | 69 |
| GO:001607217 | Prostate | Tumor | rRNA metabolic process | 71/3246 | 236/18723 | 9.17e-07 | 1.79e-05 | 71 |
| GO:003447013 | Prostate | Tumor | ncRNA processing | 94/3246 | 395/18723 | 6.02e-04 | 4.31e-03 | 94 |
| Page: 1 |
| Pathway ID | Tissue | Disease Stage | Description | Gene Ratio | Bg Ratio | pvalue | p.adjust | qvalue | Count |
| Page: 1 |
Top |
Cell-cell communication analysis |
| Identification of potential cell-cell interactions between two cell types and their ligand-receptor pairs for different disease states |
| Ligand | Receptor | LRpair | Pathway | Tissue | Disease Stage |
| Page: 1 |
Top |
Single-cell gene regulatory network inference analysis |
| Find out the significant the regulons (TFs) and the target genes of each regulon across cell types for different disease states |
| TF | Cell Type | Tissue | Disease Stage | Target Gene | RSS | Regulon Activity |
| ∗The dot plots of a searched regulon are shown for all cell subpopulations in each disease state of each tissue based on the regulon specific score inferred using pySCENIC and by calculating the average expression. |
| Page: 1 |
Top |
Somatic mutation of malignant transformation related genes |
| Annotation of somatic variants for genes involved in malignant transformation |
| Hugo Symbol | Variant Class | Variant Classification | dbSNP RS | HGVSc | HGVSp | HGVSp Short | SWISSPROT | BIOTYPE | SIFT | PolyPhen | Tumor Sample Barcode | Tissue | Histology | Sex | Age | Stage | Therapy Types | Drugs | Outcome |
| UTP14C | SNV | Missense_Mutation | c.2002N>C | p.Ile668Leu | p.I668L | Q5TAP6 | protein_coding | tolerated(0.13) | possibly_damaging(0.681) | TCGA-A8-A094-01 | Breast | breast invasive carcinoma | Female | >=65 | I/II | Unknown | Unknown | SD | |
| UTP14C | SNV | Missense_Mutation | c.2203N>T | p.Asp735Tyr | p.D735Y | Q5TAP6 | protein_coding | deleterious(0) | probably_damaging(0.968) | TCGA-B6-A0I8-01 | Breast | breast invasive carcinoma | Female | <65 | I/II | Unknown | Unknown | PD | |
| UTP14C | SNV | Missense_Mutation | rs754753792 | c.1871N>C | p.Asp624Ala | p.D624A | Q5TAP6 | protein_coding | deleterious(0) | probably_damaging(0.985) | TCGA-BH-A0BG-01 | Breast | breast invasive carcinoma | Female | >=65 | I/II | Unknown | Unknown | SD |
| UTP14C | deletion | Frame_Shift_Del | novel | c.722delN | p.Arg241GlnfsTer15 | p.R241Qfs*15 | Q5TAP6 | protein_coding | TCGA-EW-A2FV-01 | Breast | breast invasive carcinoma | Female | <65 | III/IV | Chemotherapy | docetaxel | SD | ||
| UTP14C | SNV | Missense_Mutation | rs764932517 | c.1936C>T | p.Arg646Cys | p.R646C | Q5TAP6 | protein_coding | tolerated(0.09) | benign(0.052) | TCGA-C5-A1MK-01 | Cervix | cervical & endocervical cancer | Female | >=65 | III/IV | Chemotherapy | carboplatin | PD |
| UTP14C | SNV | Missense_Mutation | c.1828N>C | p.Glu610Gln | p.E610Q | Q5TAP6 | protein_coding | deleterious(0) | possibly_damaging(0.823) | TCGA-DR-A0ZM-01 | Cervix | cervical & endocervical cancer | Female | <65 | III/IV | Unspecific | Cisplatin | SD | |
| UTP14C | SNV | Missense_Mutation | rs756344755 | c.1750N>C | p.Asp584His | p.D584H | Q5TAP6 | protein_coding | deleterious(0.01) | probably_damaging(0.974) | TCGA-Q1-A73O-01 | Cervix | cervical & endocervical cancer | Female | <65 | I/II | Chemotherapy | cisplatin | CR |
| UTP14C | SNV | Missense_Mutation | c.1268A>G | p.Glu423Gly | p.E423G | Q5TAP6 | protein_coding | deleterious(0.05) | benign(0.186) | TCGA-A6-6653-01 | Colorectum | colon adenocarcinoma | Male | >=65 | I/II | Unknown | Unknown | SD | |
| UTP14C | SNV | Missense_Mutation | c.1586C>A | p.Pro529His | p.P529H | Q5TAP6 | protein_coding | deleterious(0.01) | probably_damaging(0.963) | TCGA-AA-A010-01 | Colorectum | colon adenocarcinoma | Female | <65 | I/II | Chemotherapy | folinic | CR | |
| UTP14C | SNV | Missense_Mutation | c.493C>T | p.Pro165Ser | p.P165S | Q5TAP6 | protein_coding | tolerated(0.92) | benign(0.005) | TCGA-AA-A02R-01 | Colorectum | colon adenocarcinoma | Female | >=65 | I/II | Unknown | Unknown | PD |
| Page: 1 2 3 4 5 6 7 8 |
Top |
Related drugs of malignant transformation related genes |
| Identification of chemicals and drugs interact with genes involved in malignant transfromation |
| (DGIdb 4.0) |
| Entrez ID | Symbol | Category | Interaction Types | Drug Claim Name | Drug Name | PMIDs |
| Page: 1 |

Copyright 2023-Present -The University of Texas Health Science Center at Houston |