| Tissue | Expression Dynamics | Abbreviation |
| Cervix | 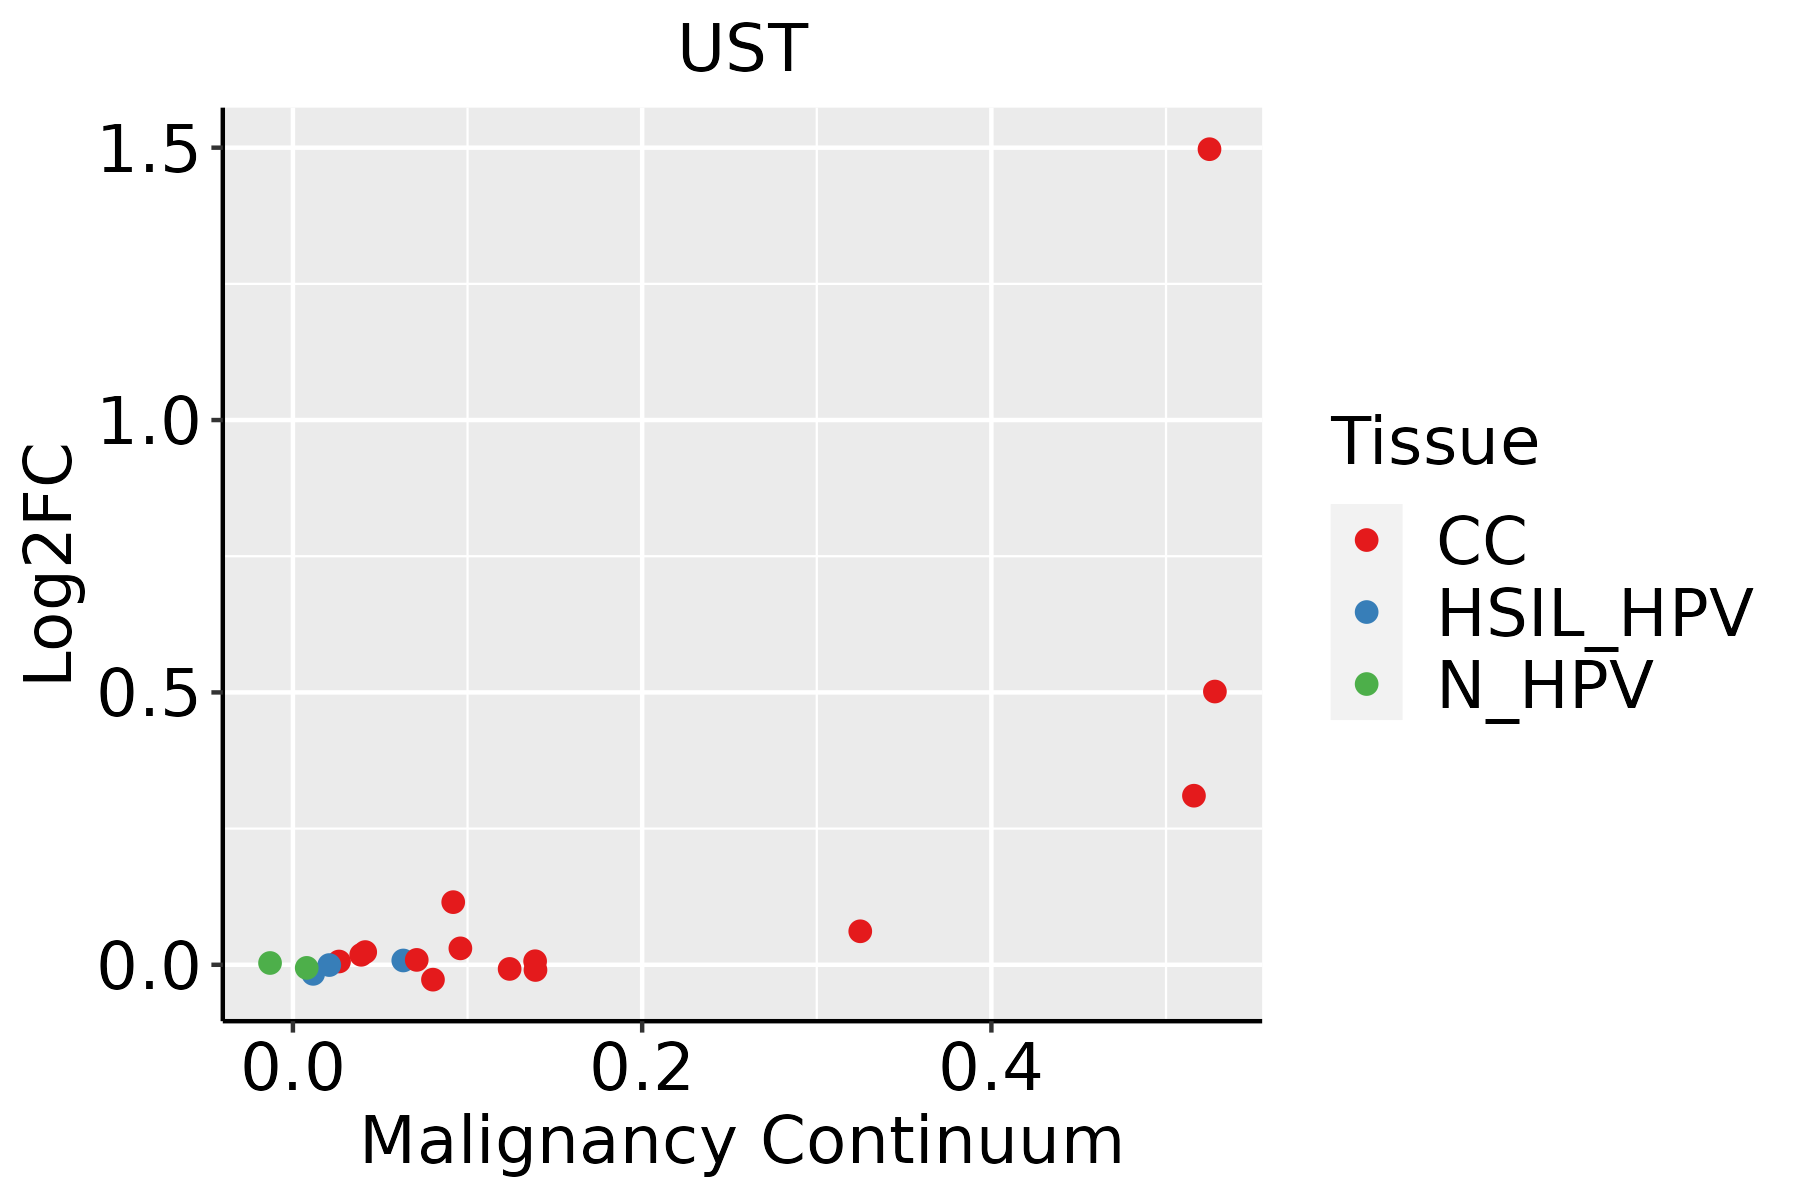 | CC: Cervix cancer |
| HSIL_HPV: HPV-infected high-grade squamous intraepithelial lesions |
| N_HPV: HPV-infected normal cervix |
| Colorectum (GSE201348) |  | FAP: Familial adenomatous polyposis |
| CRC: Colorectal cancer |
| Colorectum (HTA11) |  | AD: Adenomas |
| SER: Sessile serrated lesions |
| MSI-H: Microsatellite-high colorectal cancer |
| MSS: Microsatellite stable colorectal cancer |
| Liver | 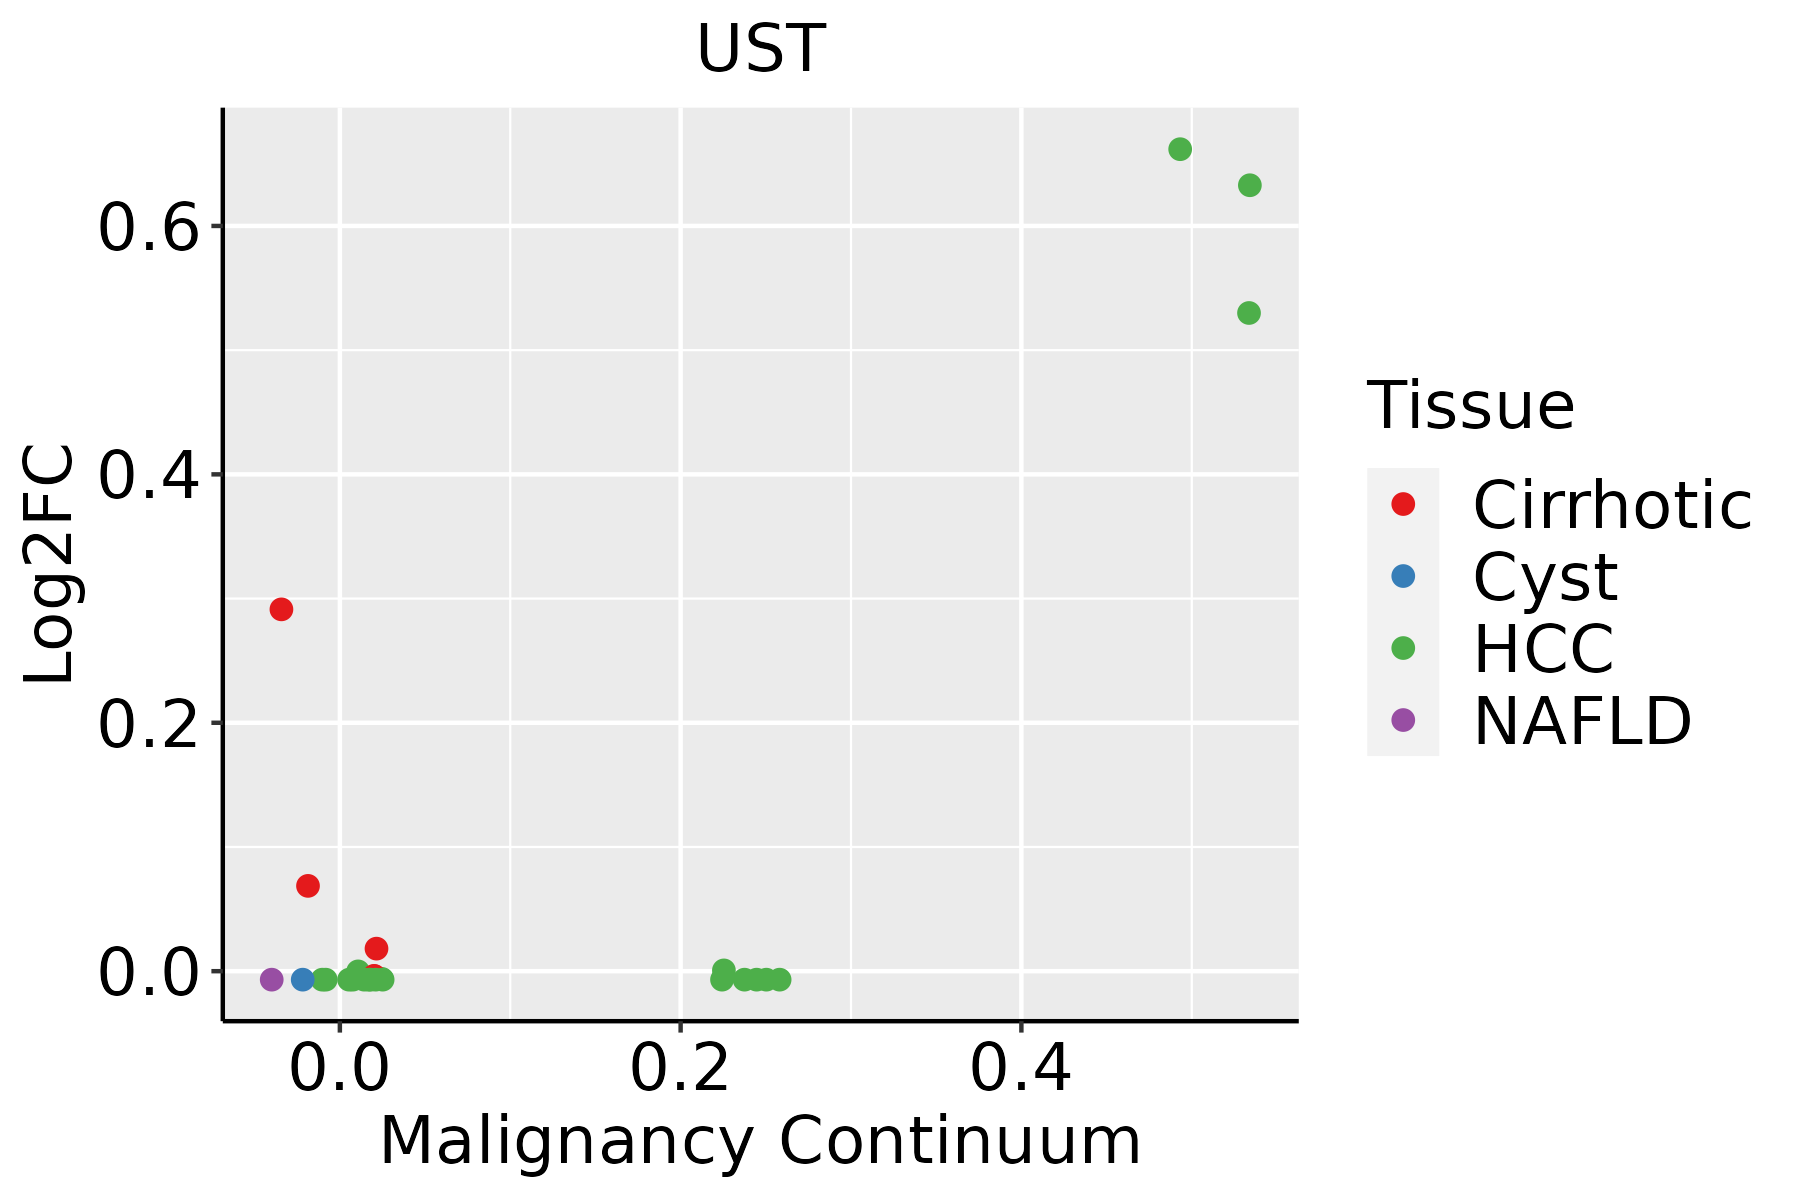 | HCC: Hepatocellular carcinoma |
| NAFLD: Non-alcoholic fatty liver disease |
| Lung | 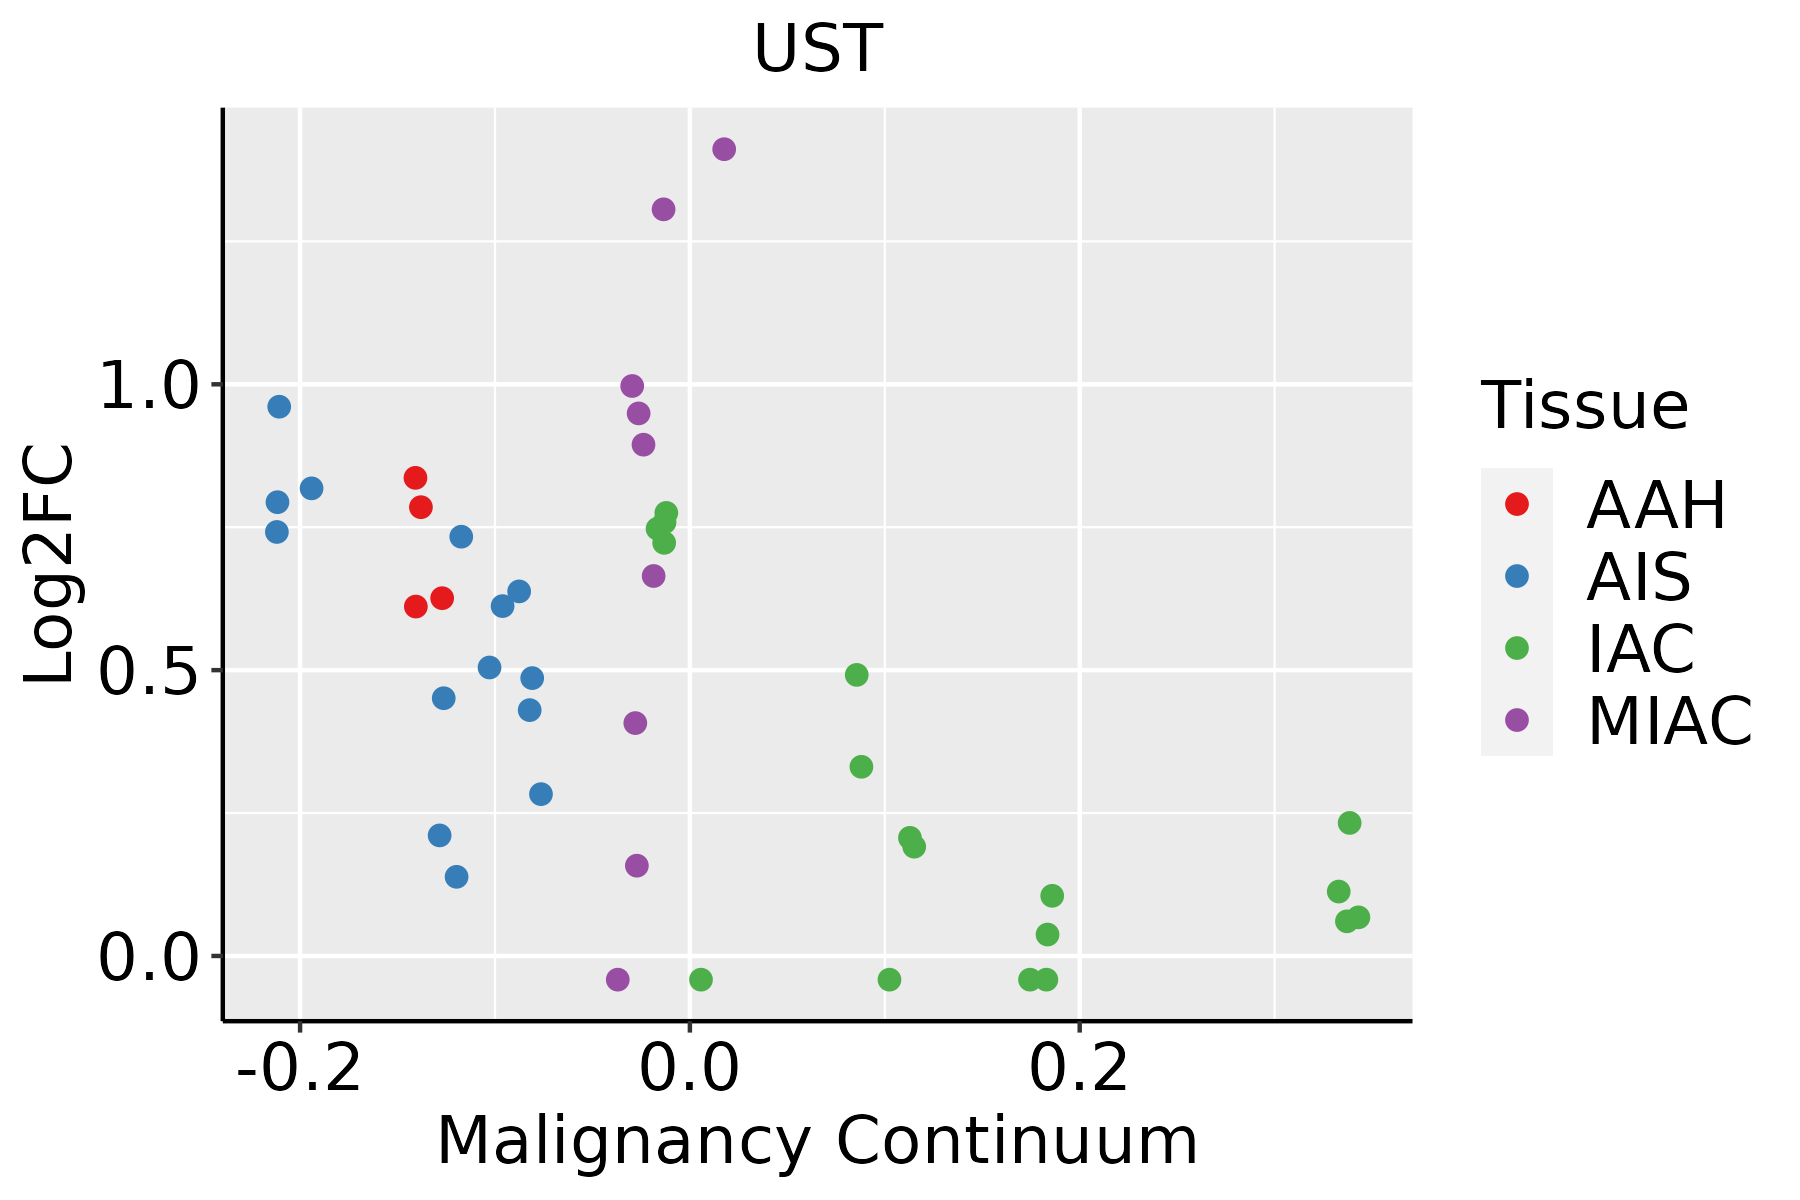 | AAH: Atypical adenomatous hyperplasia |
| AIS: Adenocarcinoma in situ |
| IAC: Invasive lung adenocarcinoma |
| MIA: Minimally invasive adenocarcinoma |
| Prostate |  | BPH: Benign Prostatic Hyperplasia |
| Skin | 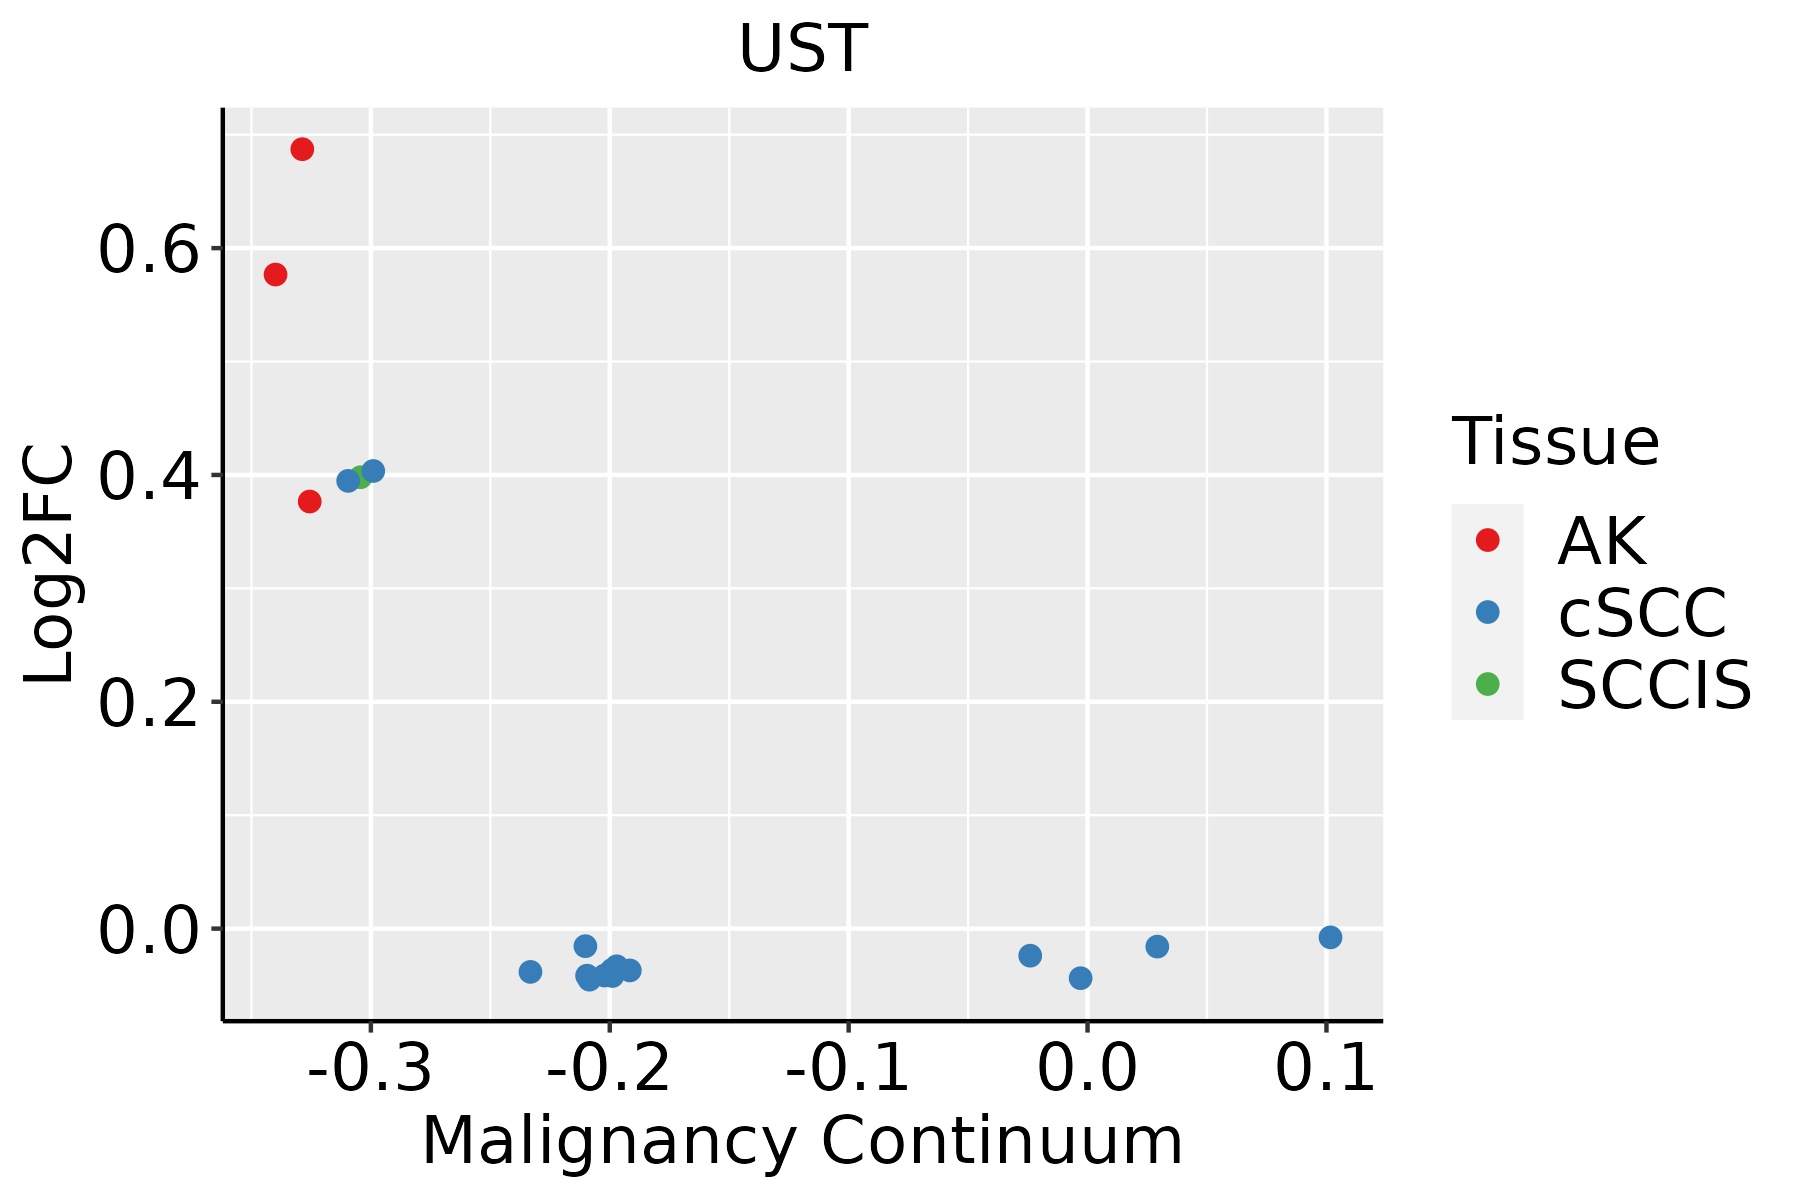 | AK: Actinic keratosis |
| cSCC: Cutaneous squamous cell carcinoma |
| SCCIS:squamous cell carcinoma in situ |
| GO ID | Tissue | Disease Stage | Description | Gene Ratio | Bg Ratio | pvalue | p.adjust | Count |
| GO:00071639 | Cervix | CC | establishment or maintenance of cell polarity | 63/2311 | 218/18723 | 4.25e-11 | 8.76e-09 | 63 |
| GO:00300108 | Cervix | CC | establishment of cell polarity | 42/2311 | 143/18723 | 4.30e-08 | 2.62e-06 | 42 |
| GO:00109757 | Cervix | CC | regulation of neuron projection development | 88/2311 | 445/18723 | 4.26e-06 | 1.09e-04 | 88 |
| GO:00615647 | Cervix | CC | axon development | 89/2311 | 467/18723 | 1.71e-05 | 3.27e-04 | 89 |
| GO:00074097 | Cervix | CC | axonogenesis | 78/2311 | 418/18723 | 1.14e-04 | 1.43e-03 | 78 |
| GO:00507705 | Cervix | CC | regulation of axonogenesis | 34/2311 | 154/18723 | 4.87e-04 | 4.76e-03 | 34 |
| GO:0007163 | Colorectum | AD | establishment or maintenance of cell polarity | 77/3918 | 218/18723 | 5.72e-07 | 2.08e-05 | 77 |
| GO:0010975 | Colorectum | AD | regulation of neuron projection development | 129/3918 | 445/18723 | 2.88e-05 | 5.37e-04 | 129 |
| GO:0007409 | Colorectum | AD | axonogenesis | 122/3918 | 418/18723 | 3.36e-05 | 6.15e-04 | 122 |
| GO:0006790 | Colorectum | AD | sulfur compound metabolic process | 101/3918 | 339/18723 | 6.46e-05 | 1.07e-03 | 101 |
| GO:0030010 | Colorectum | AD | establishment of cell polarity | 50/3918 | 143/18723 | 6.90e-05 | 1.11e-03 | 50 |
| GO:0061564 | Colorectum | AD | axon development | 132/3918 | 467/18723 | 8.40e-05 | 1.31e-03 | 132 |
| GO:0050770 | Colorectum | AD | regulation of axonogenesis | 49/3918 | 154/18723 | 9.88e-04 | 9.28e-03 | 49 |
| GO:00071632 | Colorectum | MSS | establishment or maintenance of cell polarity | 72/3467 | 218/18723 | 1.90e-07 | 8.30e-06 | 72 |
| GO:00300102 | Colorectum | MSS | establishment of cell polarity | 47/3467 | 143/18723 | 2.74e-05 | 5.58e-04 | 47 |
| GO:00109752 | Colorectum | MSS | regulation of neuron projection development | 115/3467 | 445/18723 | 6.91e-05 | 1.20e-03 | 115 |
| GO:00074092 | Colorectum | MSS | axonogenesis | 105/3467 | 418/18723 | 4.32e-04 | 5.23e-03 | 105 |
| GO:00615642 | Colorectum | MSS | axon development | 115/3467 | 467/18723 | 5.33e-04 | 6.00e-03 | 115 |
| GO:00067902 | Colorectum | MSS | sulfur compound metabolic process | 85/3467 | 339/18723 | 1.52e-03 | 1.39e-02 | 85 |
| GO:00507701 | Colorectum | MSS | regulation of axonogenesis | 43/3467 | 154/18723 | 2.69e-03 | 2.12e-02 | 43 |
| Hugo Symbol | Variant Class | Variant Classification | dbSNP RS | HGVSc | HGVSp | HGVSp Short | SWISSPROT | BIOTYPE | SIFT | PolyPhen | Tumor Sample Barcode | Tissue | Histology | Sex | Age | Stage | Therapy Types | Drugs | Outcome |
| UST | SNV | Missense_Mutation | rs370216214 | c.1078N>T | p.Arg360Cys | p.R360C | Q9Y2C2 | protein_coding | deleterious(0.01) | possibly_damaging(0.719) | TCGA-A2-A0ET-01 | Breast | breast invasive carcinoma | Female | <65 | III/IV | Chemotherapy | cytoxan | SD |
| UST | SNV | Missense_Mutation | | c.1099C>T | p.His367Tyr | p.H367Y | Q9Y2C2 | protein_coding | tolerated_low_confidence(0.6) | benign(0.027) | TCGA-A2-A0YK-01 | Breast | breast invasive carcinoma | Female | <65 | I/II | Chemotherapy | cytoxan | SD |
| UST | SNV | Missense_Mutation | rs772986508 | c.478G>A | p.Glu160Lys | p.E160K | Q9Y2C2 | protein_coding | tolerated(0.55) | benign(0.031) | TCGA-A2-A1FV-01 | Breast | breast invasive carcinoma | Female | >=65 | I/II | Chemotherapy | cyclophosphamide | SD |
| UST | SNV | Missense_Mutation | rs370896083 | c.31N>C | p.Gly11Arg | p.G11R | Q9Y2C2 | protein_coding | deleterious_low_confidence(0) | benign(0.058) | TCGA-GM-A2DH-01 | Breast | breast invasive carcinoma | Female | <65 | I/II | Chemotherapy | taxol | CR |
| UST | SNV | Missense_Mutation | novel | c.401N>C | p.Val134Ala | p.V134A | Q9Y2C2 | protein_coding | tolerated(0.27) | benign(0.246) | TCGA-PL-A8LZ-01 | Breast | breast invasive carcinoma | Female | <65 | III/IV | Chemotherapy | paclitaxel | SD |
| UST | insertion | Nonsense_Mutation | novel | c.936_937insAGACTATTGTAGGTACTTAGTTGTTGGATGCAT | p.Pro312_Glu313insArgLeuLeuTerValLeuSerCysTrpMetHis | p.P312_E313insRLL*VLSCWMH | Q9Y2C2 | protein_coding | | | TCGA-A2-A0EQ-01 | Breast | breast invasive carcinoma | Female | <65 | I/II | Chemotherapy | adriamycin | SD |
| UST | SNV | Missense_Mutation | novel | c.433N>G | p.Thr145Ala | p.T145A | Q9Y2C2 | protein_coding | deleterious(0.04) | possibly_damaging(0.864) | TCGA-VS-A9V1-01 | Cervix | cervical & endocervical cancer | Female | <65 | I/II | Chemotherapy | cisplatin | PD |
| UST | SNV | Missense_Mutation | | c.490N>G | p.Leu164Val | p.L164V | Q9Y2C2 | protein_coding | tolerated(0.14) | benign(0.137) | TCGA-A6-6141-01 | Colorectum | colon adenocarcinoma | Male | <65 | I/II | Chemotherapy | 5-fu | SD |
| UST | SNV | Missense_Mutation | | c.1145C>T | p.Pro382Leu | p.P382L | Q9Y2C2 | protein_coding | deleterious_low_confidence(0.02) | benign(0.245) | TCGA-AA-A02R-01 | Colorectum | colon adenocarcinoma | Female | >=65 | I/II | Unknown | Unknown | PD |
| UST | SNV | Missense_Mutation | rs746546399 | c.673N>T | p.Arg225Cys | p.R225C | Q9Y2C2 | protein_coding | deleterious(0) | probably_damaging(0.985) | TCGA-AD-5900-01 | Colorectum | colon adenocarcinoma | Male | >=65 | I/II | Unknown | Unknown | SD |


