
|
|||||
|
 | |
| |
| |
| |
| |
| |
|
Gene: USP9Y |
Gene summary for USP9Y |
| Gene information | Species | Human | Gene symbol | USP9Y | Gene ID | 8287 |
| Gene name | ubiquitin specific peptidase 9 Y-linked | |
| Gene Alias | DFFRY | |
| Cytomap | Yq11.221 | |
| Gene Type | protein-coding | GO ID | GO:0000003 | UniProtAcc | O00507 |
Top |
Malignant transformation analysis |
| Identification of the aberrant gene expression in precancerous and cancerous lesions by comparing the gene expression of stem-like cells in diseased tissues with normal stem cells |
| Entrez ID | Symbol | Replicates | Species | Organ | Tissue | Adj P-value | Log2FC | Malignancy |
| 8287 | USP9Y | LZE4T | Human | Esophagus | ESCC | 1.70e-21 | 5.88e-01 | 0.0811 |
| 8287 | USP9Y | P5T-E | Human | Esophagus | ESCC | 4.70e-03 | -1.52e-02 | 0.1327 |
| 8287 | USP9Y | P10T-E | Human | Esophagus | ESCC | 3.09e-07 | 1.48e-01 | 0.116 |
| 8287 | USP9Y | P12T-E | Human | Esophagus | ESCC | 2.91e-08 | 2.98e-02 | 0.1122 |
| 8287 | USP9Y | P22T-E | Human | Esophagus | ESCC | 1.46e-08 | 6.73e-03 | 0.1236 |
| 8287 | USP9Y | P28T-E | Human | Esophagus | ESCC | 7.82e-09 | 4.58e-02 | 0.1149 |
| 8287 | USP9Y | P37T-E | Human | Esophagus | ESCC | 5.77e-08 | 2.46e-02 | 0.1371 |
| 8287 | USP9Y | P44T-E | Human | Esophagus | ESCC | 3.82e-02 | 4.24e-02 | 0.1096 |
| 8287 | USP9Y | P52T-E | Human | Esophagus | ESCC | 1.98e-06 | 5.67e-02 | 0.1555 |
| 8287 | USP9Y | P56T-E | Human | Esophagus | ESCC | 1.15e-02 | 6.90e-01 | 0.1613 |
| 8287 | USP9Y | P57T-E | Human | Esophagus | ESCC | 1.63e-06 | -1.81e-03 | 0.0926 |
| 8287 | USP9Y | P79T-E | Human | Esophagus | ESCC | 5.71e-04 | 3.01e-03 | 0.1154 |
| 8287 | USP9Y | P127T-E | Human | Esophagus | ESCC | 4.33e-18 | 1.82e-01 | 0.0826 |
| 8287 | USP9Y | NAFLD1 | Human | Liver | NAFLD | 2.31e-03 | 5.44e-01 | -0.04 |
| 8287 | USP9Y | HCC2_Meng | Human | Liver | HCC | 1.93e-02 | -1.19e-01 | 0.0107 |
| 8287 | USP9Y | cirrhotic1 | Human | Liver | Cirrhotic | 1.93e-02 | -1.19e-01 | 0.0202 |
| 8287 | USP9Y | HCC1 | Human | Liver | HCC | 3.97e-12 | 5.13e-01 | 0.5336 |
| 8287 | USP9Y | HCC2 | Human | Liver | HCC | 6.55e-09 | 2.99e+00 | 0.5341 |
| 8287 | USP9Y | Pt14.d | Human | Liver | HCC | 4.06e-02 | -1.19e-01 | 0.0143 |
| 8287 | USP9Y | RNA-P23T2-P23T2-1 | Human | Lung | MIAC | 6.80e-05 | 8.52e-01 | -0.037 |
| Page: 1 2 |
| Tissue | Expression Dynamics | Abbreviation |
| Esophagus | 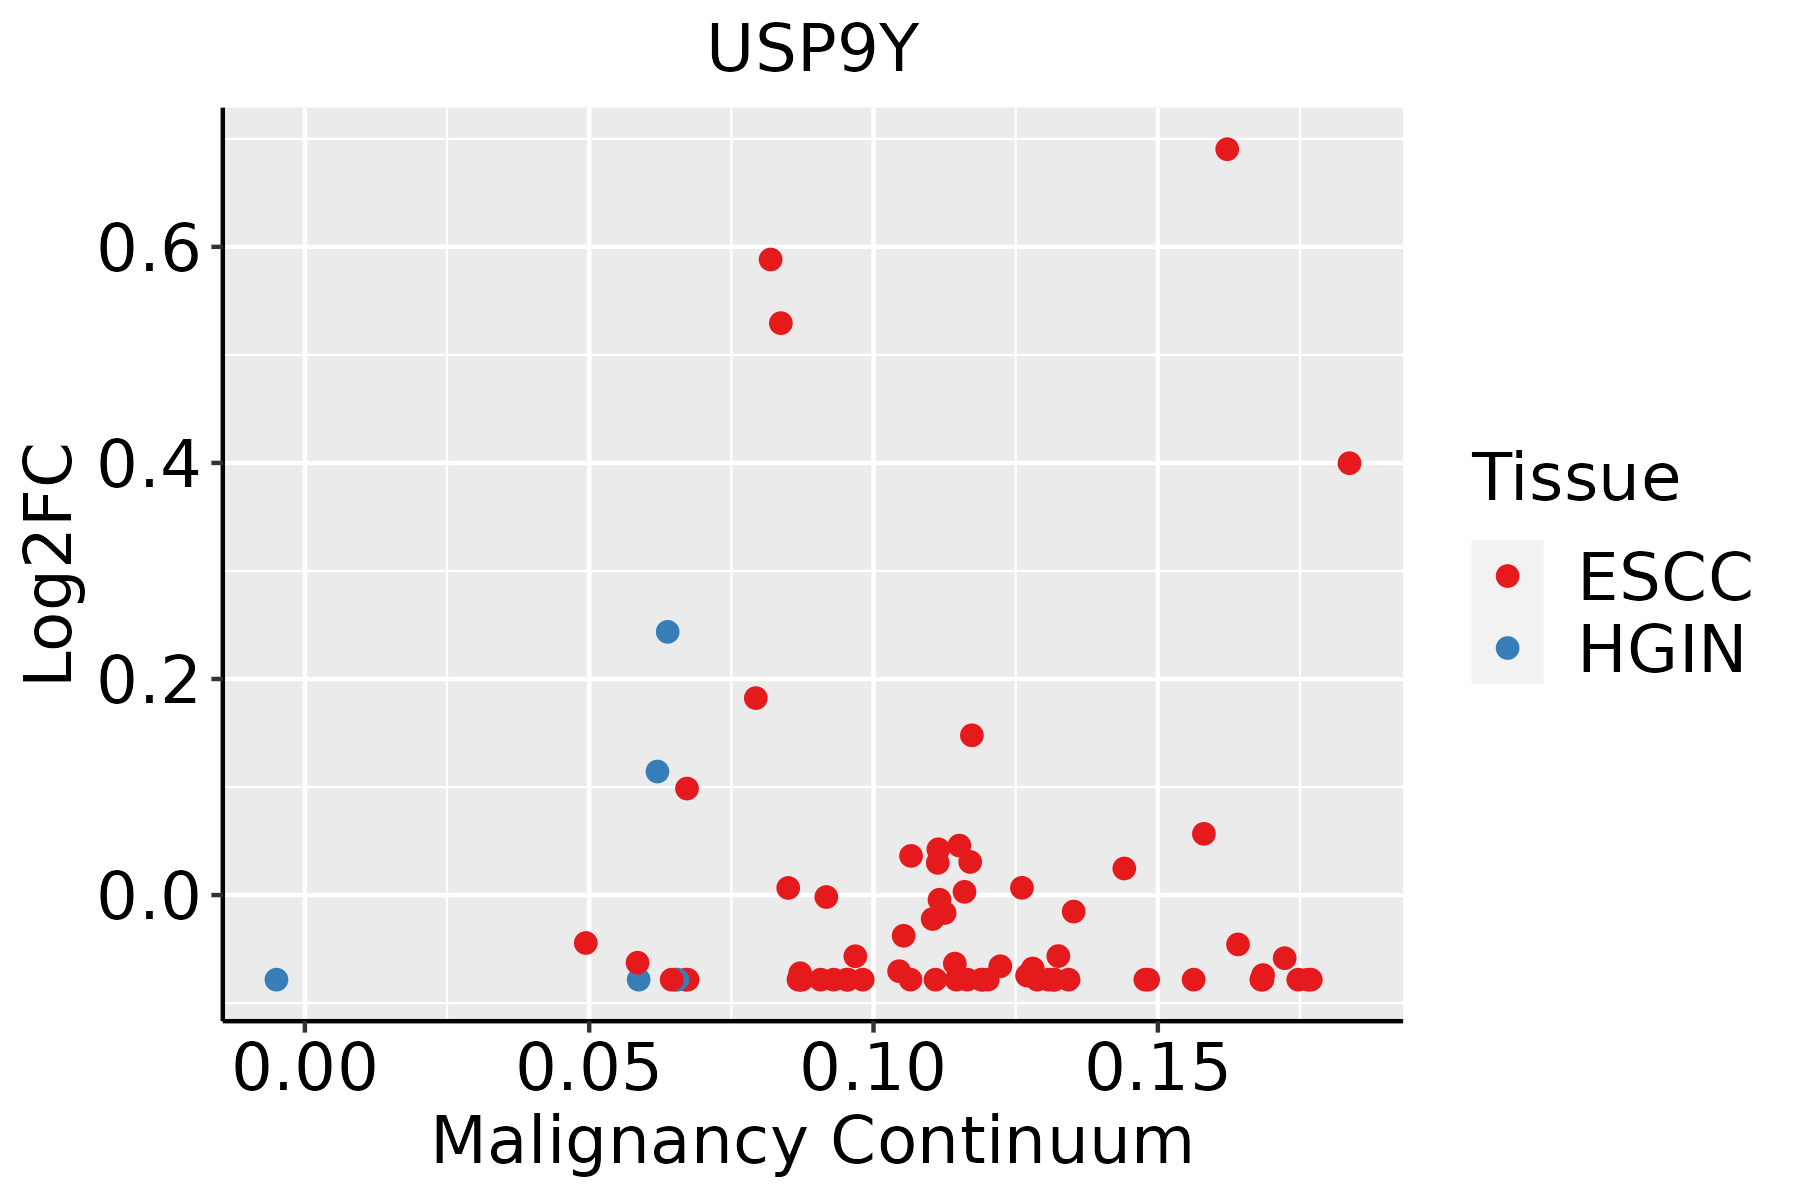 | ESCC: Esophageal squamous cell carcinoma |
| HGIN: High-grade intraepithelial neoplasias | ||
| LGIN: Low-grade intraepithelial neoplasias | ||
| Liver | 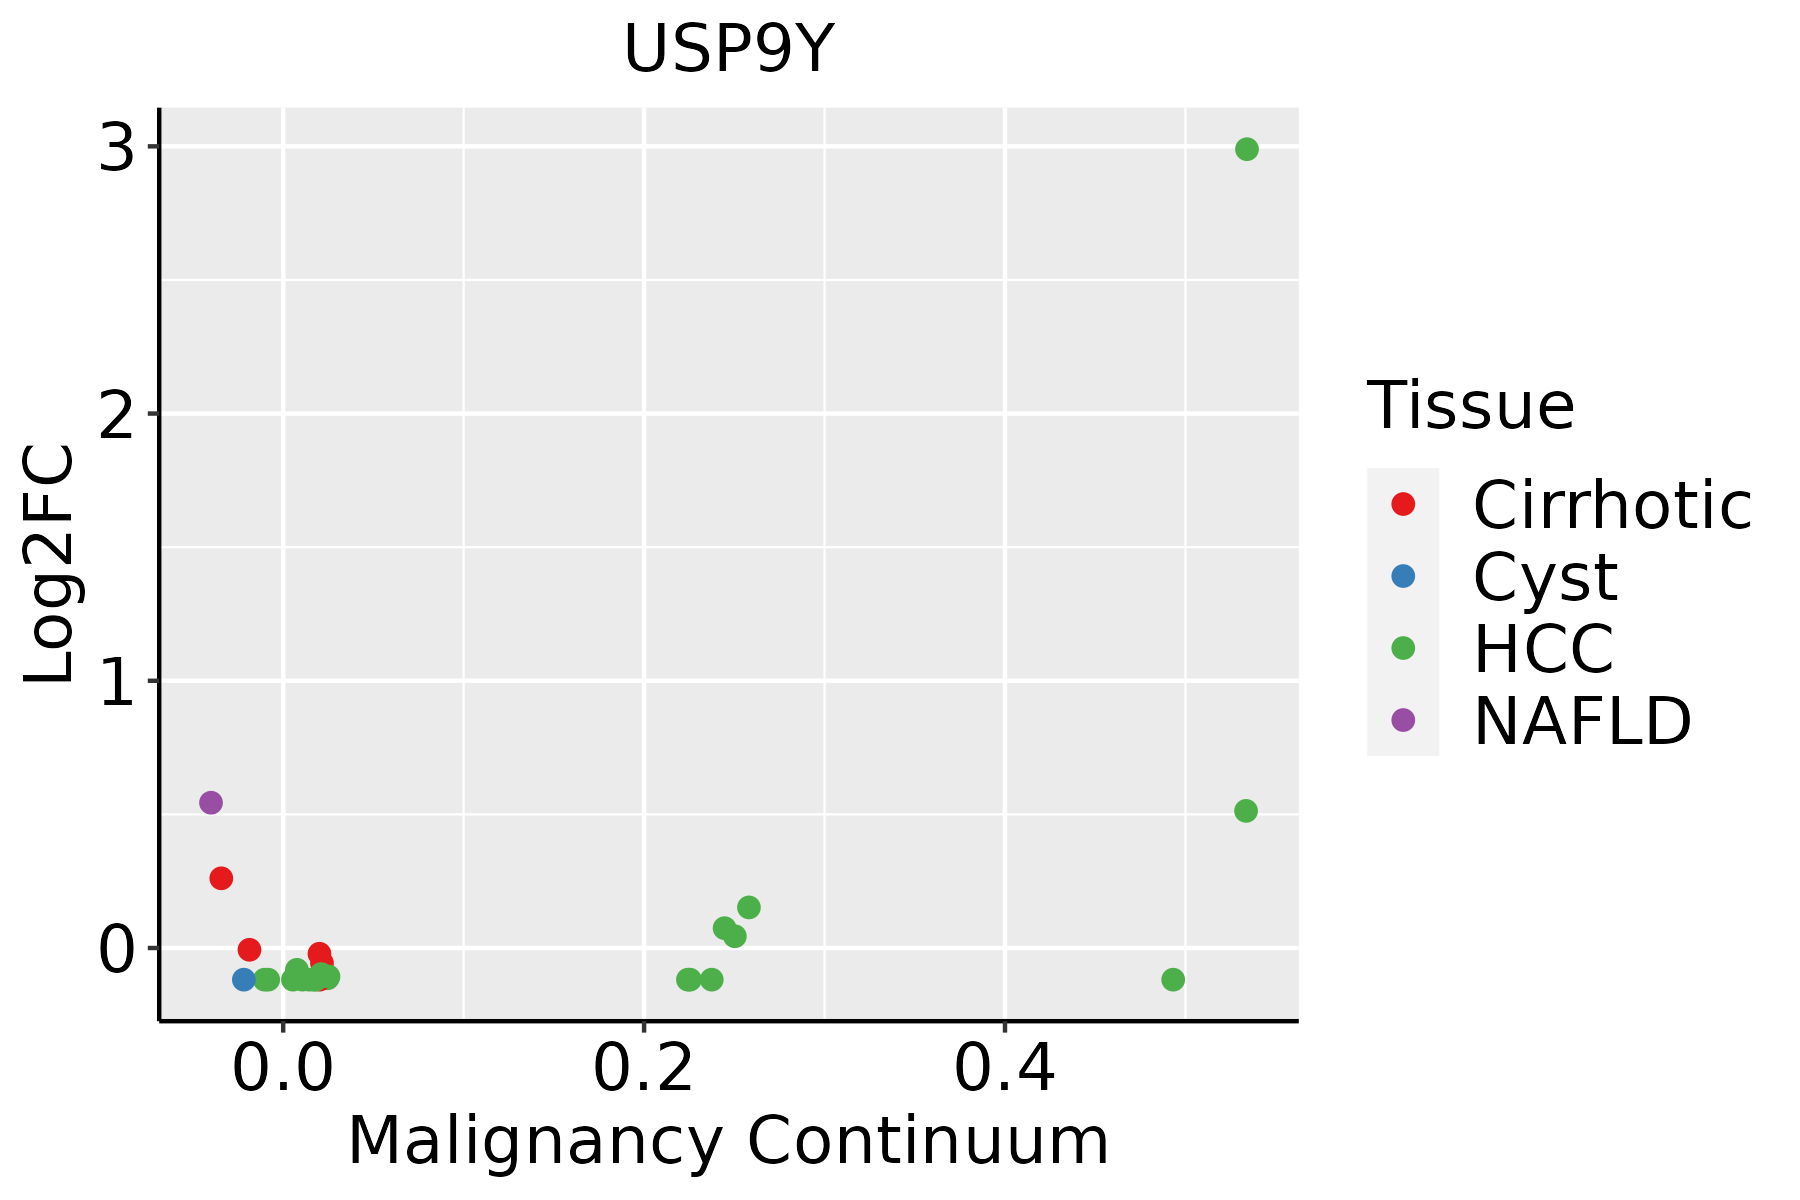 | HCC: Hepatocellular carcinoma |
| NAFLD: Non-alcoholic fatty liver disease | ||
| Lung | 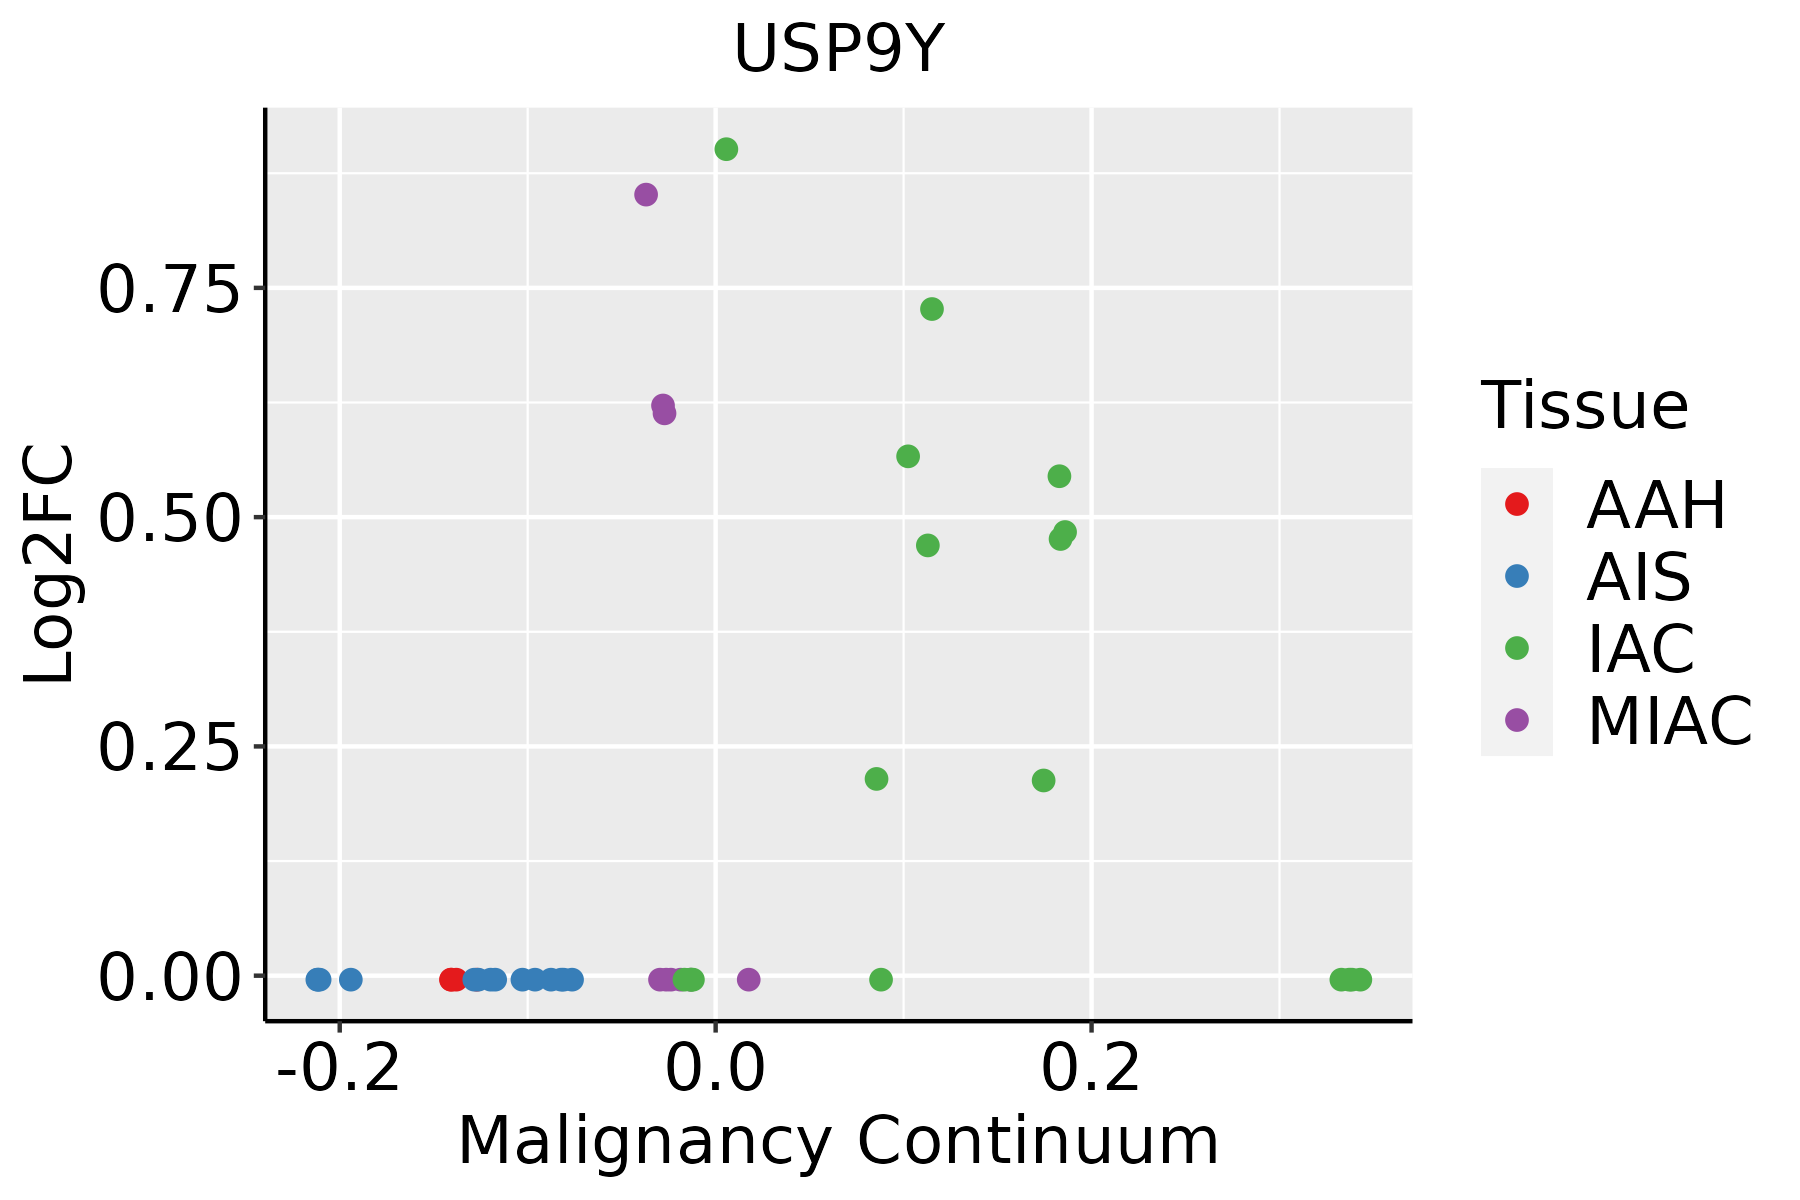 | AAH: Atypical adenomatous hyperplasia |
| AIS: Adenocarcinoma in situ | ||
| IAC: Invasive lung adenocarcinoma | ||
| MIA: Minimally invasive adenocarcinoma |
| ∗log2FC in expression of this searched gene in stem-like cells from each diseased tissue sample relative to stem-like cells in normal samples in each tissue plotted against the malignancy continuum. Samples are colored based on if they are from different disease stage. |
Top |
Malignant transformation related pathway analysis |
| Find out the enriched GO biological processes and KEGG pathways involved in transition from healthy to precancer to cancer |
| Tissue | Disease Stage | Enriched GO biological Processes |
| Colorectum | AD |  |
| Colorectum | SER |  |
| Colorectum | MSS |  |
| Colorectum | MSI-H |  |
| Colorectum | FAP |  |
| ∗Top 15 enriched GO BP terms are showed in the bar plot of each disease state in each tissue. Each row represents a significant GO biological process which is colored according to the -log10(p.adjust). |
| Page: 1 2 3 4 5 6 7 8 9 |
| GO ID | Tissue | Disease Stage | Description | Gene Ratio | Bg Ratio | pvalue | p.adjust | Count |
| GO:00715599 | Esophagus | ESCC | response to transforming growth factor beta | 157/8552 | 256/18723 | 2.95e-07 | 4.23e-06 | 157 |
| GO:00715609 | Esophagus | ESCC | cellular response to transforming growth factor beta stimulus | 151/8552 | 250/18723 | 1.78e-06 | 2.10e-05 | 151 |
| GO:00071799 | Esophagus | ESCC | transforming growth factor beta receptor signaling pathway | 121/8552 | 198/18723 | 8.26e-06 | 8.03e-05 | 121 |
| GO:007064612 | Esophagus | ESCC | protein modification by small protein removal | 95/8552 | 157/18723 | 1.25e-04 | 8.56e-04 | 95 |
| GO:000717810 | Esophagus | ESCC | transmembrane receptor protein serine/threonine kinase signaling pathway | 195/8552 | 355/18723 | 2.58e-04 | 1.58e-03 | 195 |
| GO:00165793 | Esophagus | ESCC | protein deubiquitination | 79/8552 | 139/18723 | 5.23e-03 | 1.97e-02 | 79 |
| GO:00715593 | Liver | NAFLD | response to transforming growth factor beta | 51/1882 | 256/18723 | 1.43e-06 | 6.58e-05 | 51 |
| GO:00715603 | Liver | NAFLD | cellular response to transforming growth factor beta stimulus | 48/1882 | 250/18723 | 8.27e-06 | 2.76e-04 | 48 |
| GO:00071793 | Liver | NAFLD | transforming growth factor beta receptor signaling pathway | 37/1882 | 198/18723 | 1.53e-04 | 2.82e-03 | 37 |
| GO:00071784 | Liver | NAFLD | transmembrane receptor protein serine/threonine kinase signaling pathway | 56/1882 | 355/18723 | 4.50e-04 | 6.62e-03 | 56 |
| GO:0070646 | Liver | NAFLD | protein modification by small protein removal | 29/1882 | 157/18723 | 9.11e-04 | 1.09e-02 | 29 |
| GO:0016579 | Liver | NAFLD | protein deubiquitination | 26/1882 | 139/18723 | 1.35e-03 | 1.52e-02 | 26 |
| GO:007155911 | Liver | Cirrhotic | response to transforming growth factor beta | 96/4634 | 256/18723 | 3.55e-06 | 6.09e-05 | 96 |
| GO:007156011 | Liver | Cirrhotic | cellular response to transforming growth factor beta stimulus | 93/4634 | 250/18723 | 7.34e-06 | 1.13e-04 | 93 |
| GO:000717911 | Liver | Cirrhotic | transforming growth factor beta receptor signaling pathway | 71/4634 | 198/18723 | 3.02e-04 | 2.65e-03 | 71 |
| GO:000717811 | Liver | Cirrhotic | transmembrane receptor protein serine/threonine kinase signaling pathway | 111/4634 | 355/18723 | 2.98e-03 | 1.70e-02 | 111 |
| GO:007155921 | Liver | HCC | response to transforming growth factor beta | 141/7958 | 256/18723 | 3.08e-05 | 3.16e-04 | 141 |
| GO:007156021 | Liver | HCC | cellular response to transforming growth factor beta stimulus | 137/7958 | 250/18723 | 5.47e-05 | 5.14e-04 | 137 |
| GO:00706461 | Liver | HCC | protein modification by small protein removal | 91/7958 | 157/18723 | 6.50e-05 | 5.92e-04 | 91 |
| GO:00165791 | Liver | HCC | protein deubiquitination | 78/7958 | 139/18723 | 8.13e-04 | 4.87e-03 | 78 |
| Page: 1 2 |
| Pathway ID | Tissue | Disease Stage | Description | Gene Ratio | Bg Ratio | pvalue | p.adjust | qvalue | Count |
| Page: 1 |
Top |
Cell-cell communication analysis |
| Identification of potential cell-cell interactions between two cell types and their ligand-receptor pairs for different disease states |
| Ligand | Receptor | LRpair | Pathway | Tissue | Disease Stage |
| Page: 1 |
Top |
Single-cell gene regulatory network inference analysis |
| Find out the significant the regulons (TFs) and the target genes of each regulon across cell types for different disease states |
| TF | Cell Type | Tissue | Disease Stage | Target Gene | RSS | Regulon Activity |
| ∗The dot plots of a searched regulon are shown for all cell subpopulations in each disease state of each tissue based on the regulon specific score inferred using pySCENIC and by calculating the average expression. |
| Page: 1 |
Top |
Somatic mutation of malignant transformation related genes |
| Annotation of somatic variants for genes involved in malignant transformation |
| Hugo Symbol | Variant Class | Variant Classification | dbSNP RS | HGVSc | HGVSp | HGVSp Short | SWISSPROT | BIOTYPE | SIFT | PolyPhen | Tumor Sample Barcode | Tissue | Histology | Sex | Age | Stage | Therapy Types | Drugs | Outcome |
| USP9Y | SNV | Missense_Mutation | novel | c.383N>A | p.Ser128Tyr | p.S128Y | O00507 | protein_coding | deleterious(0) | probably_damaging(0.999) | TCGA-AA-A00N-01 | Colorectum | colon adenocarcinoma | Male | >=65 | I/II | Unknown | Unknown | PD |
| USP9Y | SNV | Missense_Mutation | c.6124N>G | p.Thr2042Ala | p.T2042A | O00507 | protein_coding | tolerated(0.89) | benign(0.001) | TCGA-AA-A00N-01 | Colorectum | colon adenocarcinoma | Male | >=65 | I/II | Unknown | Unknown | PD | |
| USP9Y | SNV | Missense_Mutation | c.4171N>A | p.Gly1391Ser | p.G1391S | O00507 | protein_coding | tolerated(1) | benign(0) | TCGA-AD-6895-01 | Colorectum | colon adenocarcinoma | Male | >=65 | III/IV | Unknown | Unknown | SD | |
| USP9Y | SNV | Missense_Mutation | novel | c.1978A>C | p.Asn660His | p.N660H | O00507 | protein_coding | deleterious(0.02) | possibly_damaging(0.887) | TCGA-AZ-4315-01 | Colorectum | colon adenocarcinoma | Male | <65 | I/II | Unknown | Unknown | SD |
| USP9Y | SNV | Missense_Mutation | novel | c.3739A>G | p.Ile1247Val | p.I1247V | O00507 | protein_coding | tolerated(0.66) | benign(0) | TCGA-AZ-4315-01 | Colorectum | colon adenocarcinoma | Male | <65 | I/II | Unknown | Unknown | SD |
| USP9Y | SNV | Missense_Mutation | rs377271136 | c.6193C>T | p.Arg2065Cys | p.R2065C | O00507 | protein_coding | deleterious(0) | probably_damaging(0.97) | TCGA-AZ-4315-01 | Colorectum | colon adenocarcinoma | Male | <65 | I/II | Unknown | Unknown | SD |
| USP9Y | SNV | Missense_Mutation | c.4780N>T | p.Gly1594Cys | p.G1594C | O00507 | protein_coding | tolerated(0.06) | possibly_damaging(0.778) | TCGA-AZ-6601-01 | Colorectum | colon adenocarcinoma | Male | >=65 | I/II | Unknown | Unknown | PD | |
| USP9Y | SNV | Missense_Mutation | novel | c.890N>C | p.Lys297Thr | p.K297T | O00507 | protein_coding | deleterious(0.04) | probably_damaging(0.971) | TCGA-CA-6717-01 | Colorectum | colon adenocarcinoma | Male | <65 | I/II | Chemotherapy | oxaliplatin | CR |
| USP9Y | SNV | Missense_Mutation | c.3073N>A | p.Val1025Ile | p.V1025I | O00507 | protein_coding | tolerated(0.08) | benign(0.083) | TCGA-D5-6530-01 | Colorectum | colon adenocarcinoma | Male | <65 | I/II | Unknown | Unknown | SD | |
| USP9Y | SNV | Missense_Mutation | c.2383N>G | p.Lys795Glu | p.K795E | O00507 | protein_coding | deleterious(0) | possibly_damaging(0.867) | TCGA-AG-A002-01 | Colorectum | rectum adenocarcinoma | Male | <65 | I/II | Unknown | Unknown | SD |
| Page: 1 2 3 4 5 |
Top |
Related drugs of malignant transformation related genes |
| Identification of chemicals and drugs interact with genes involved in malignant transfromation |
| (DGIdb 4.0) |
| Entrez ID | Symbol | Category | Interaction Types | Drug Claim Name | Drug Name | PMIDs |
| 8287 | USP9Y | ENZYME, PROTEASE | TESTOSTERONE | TESTOSTERONE | 10439009 |
| Page: 1 |

Copyright 2023-Present -The University of Texas Health Science Center at Houston |