| Tissue | Expression Dynamics | Abbreviation |
| Cervix | 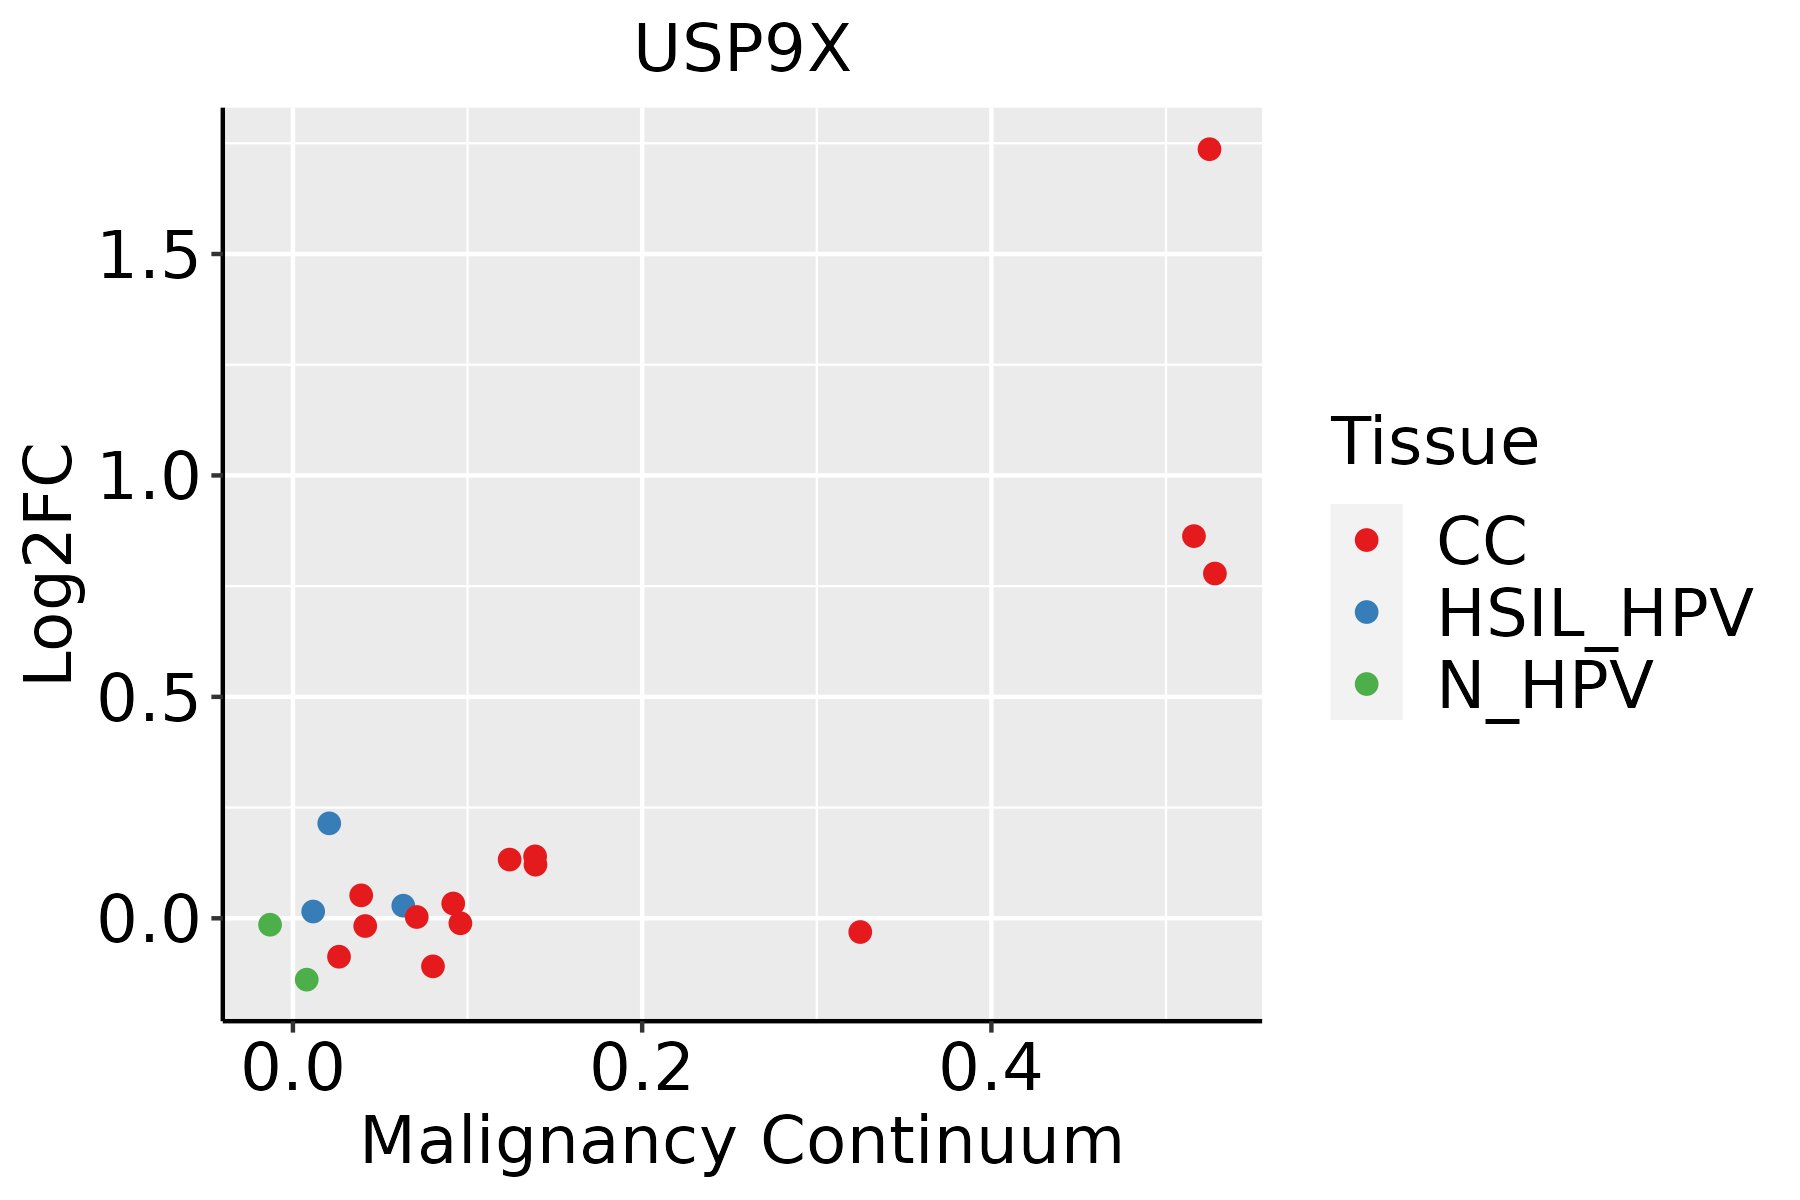 | CC: Cervix cancer |
| HSIL_HPV: HPV-infected high-grade squamous intraepithelial lesions |
| N_HPV: HPV-infected normal cervix |
| Colorectum (GSE201348) |  | FAP: Familial adenomatous polyposis |
| CRC: Colorectal cancer |
| Colorectum (HTA11) |  | AD: Adenomas |
| SER: Sessile serrated lesions |
| MSI-H: Microsatellite-high colorectal cancer |
| MSS: Microsatellite stable colorectal cancer |
| Endometrium | 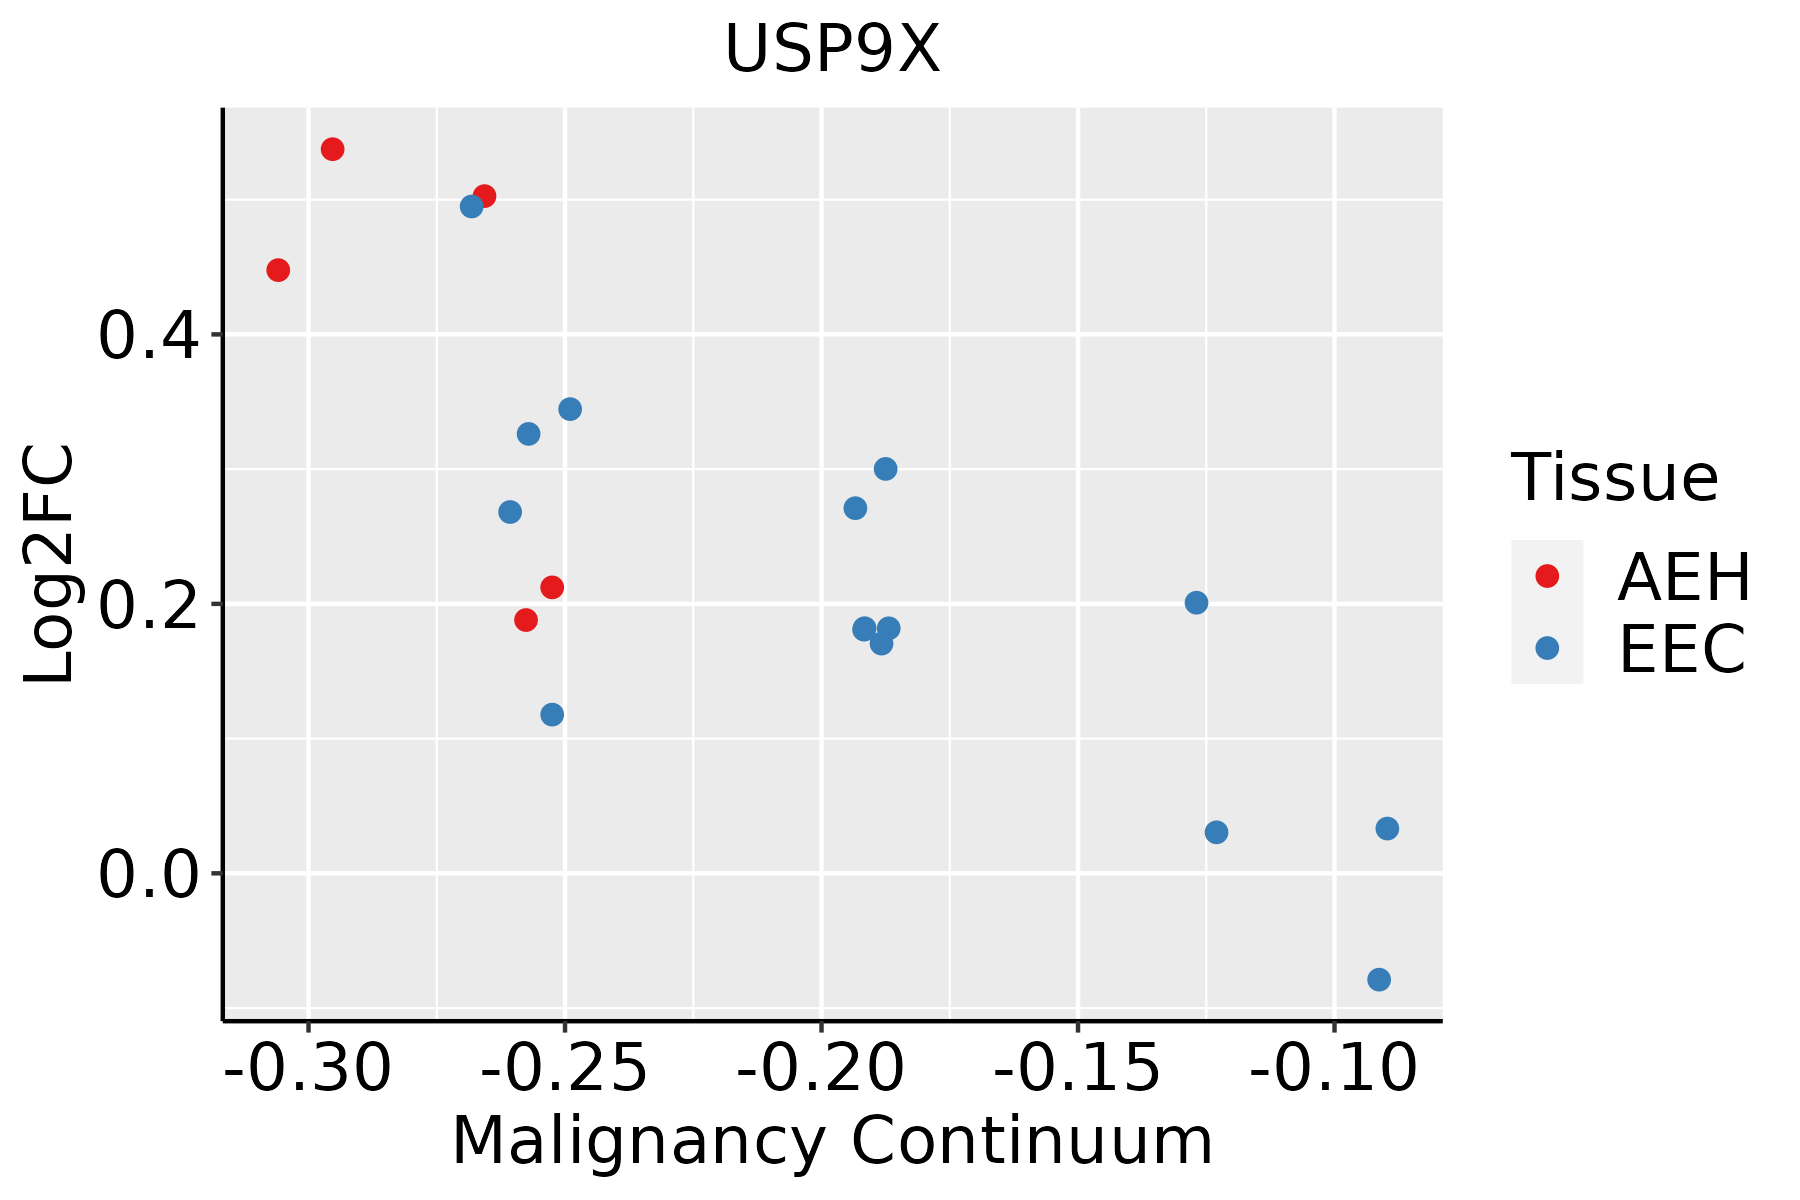 | AEH: Atypical endometrial hyperplasia |
| EEC: Endometrioid Cancer |
| Esophagus |  | ESCC: Esophageal squamous cell carcinoma |
| HGIN: High-grade intraepithelial neoplasias |
| LGIN: Low-grade intraepithelial neoplasias |
| Liver | 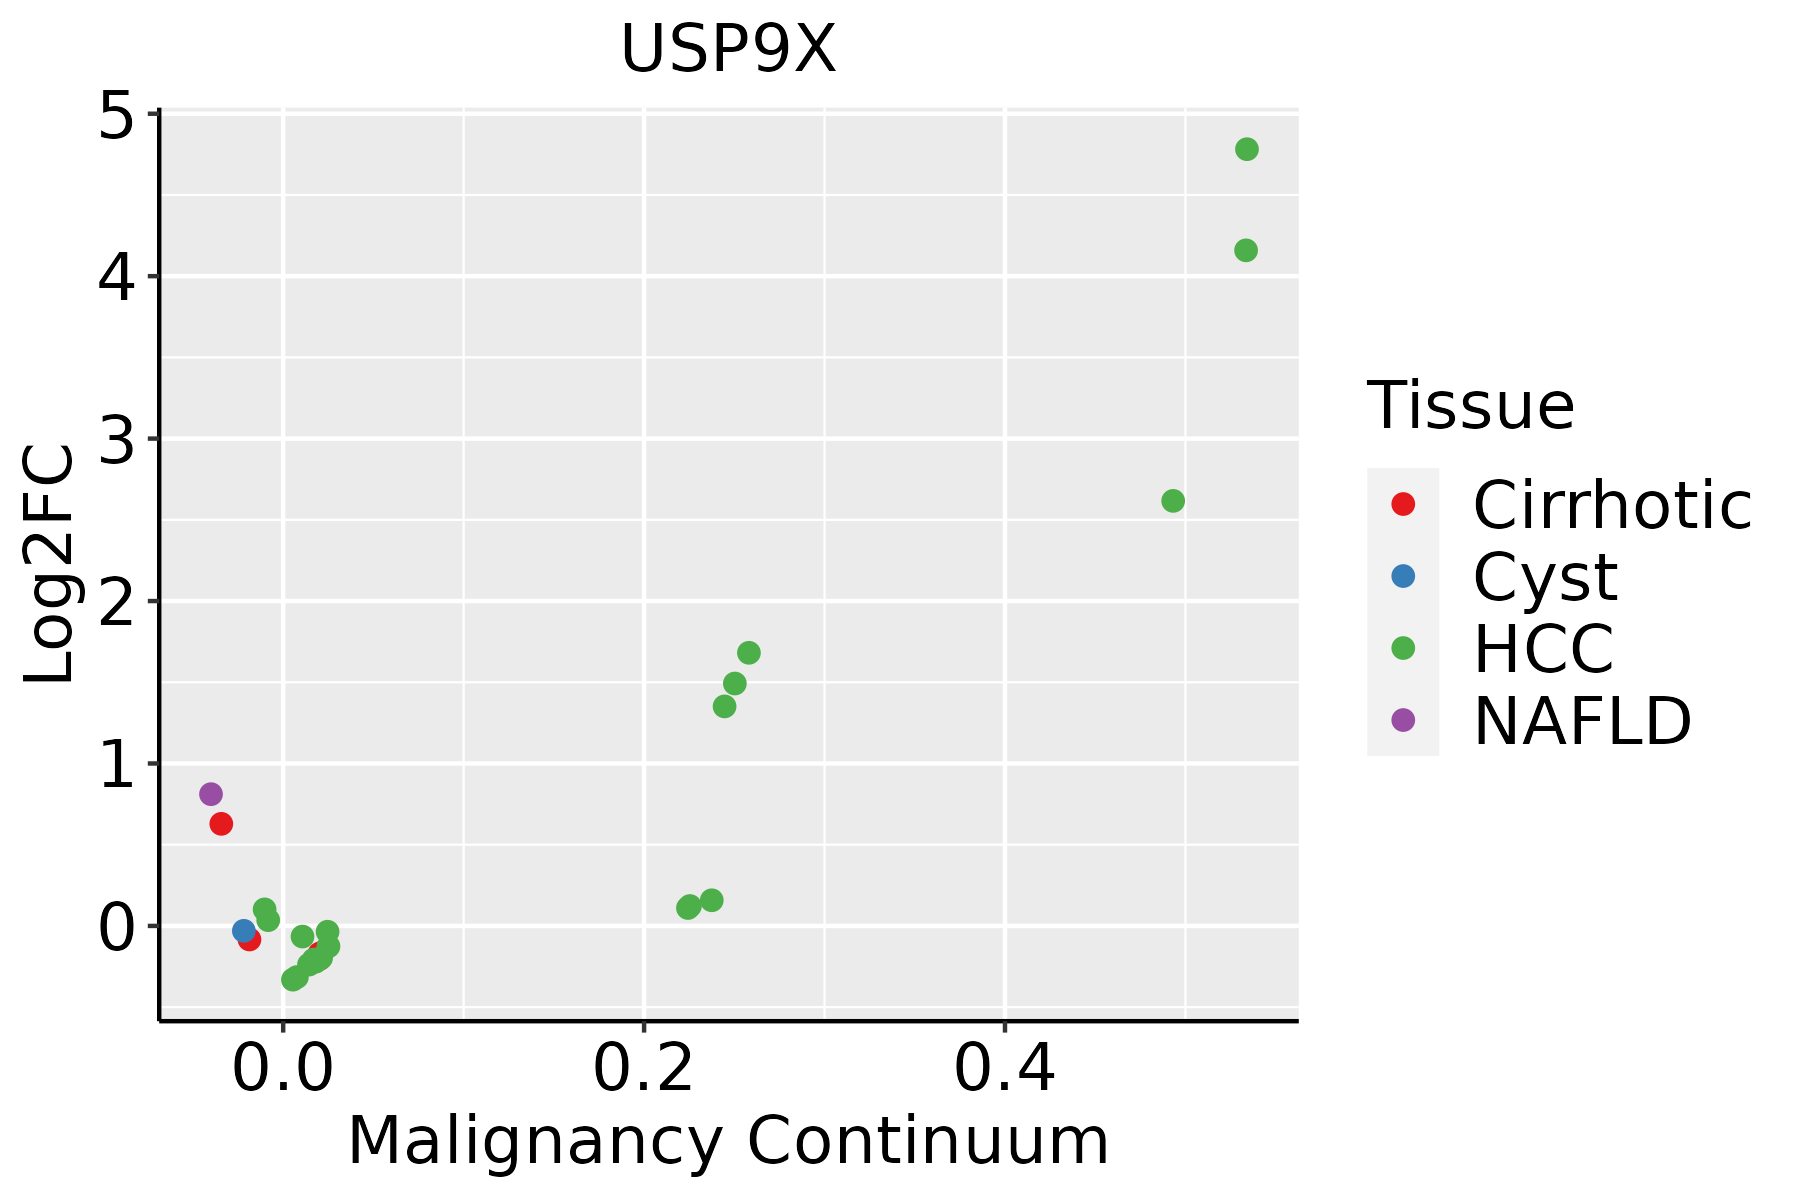 | HCC: Hepatocellular carcinoma |
| NAFLD: Non-alcoholic fatty liver disease |
| Lung | 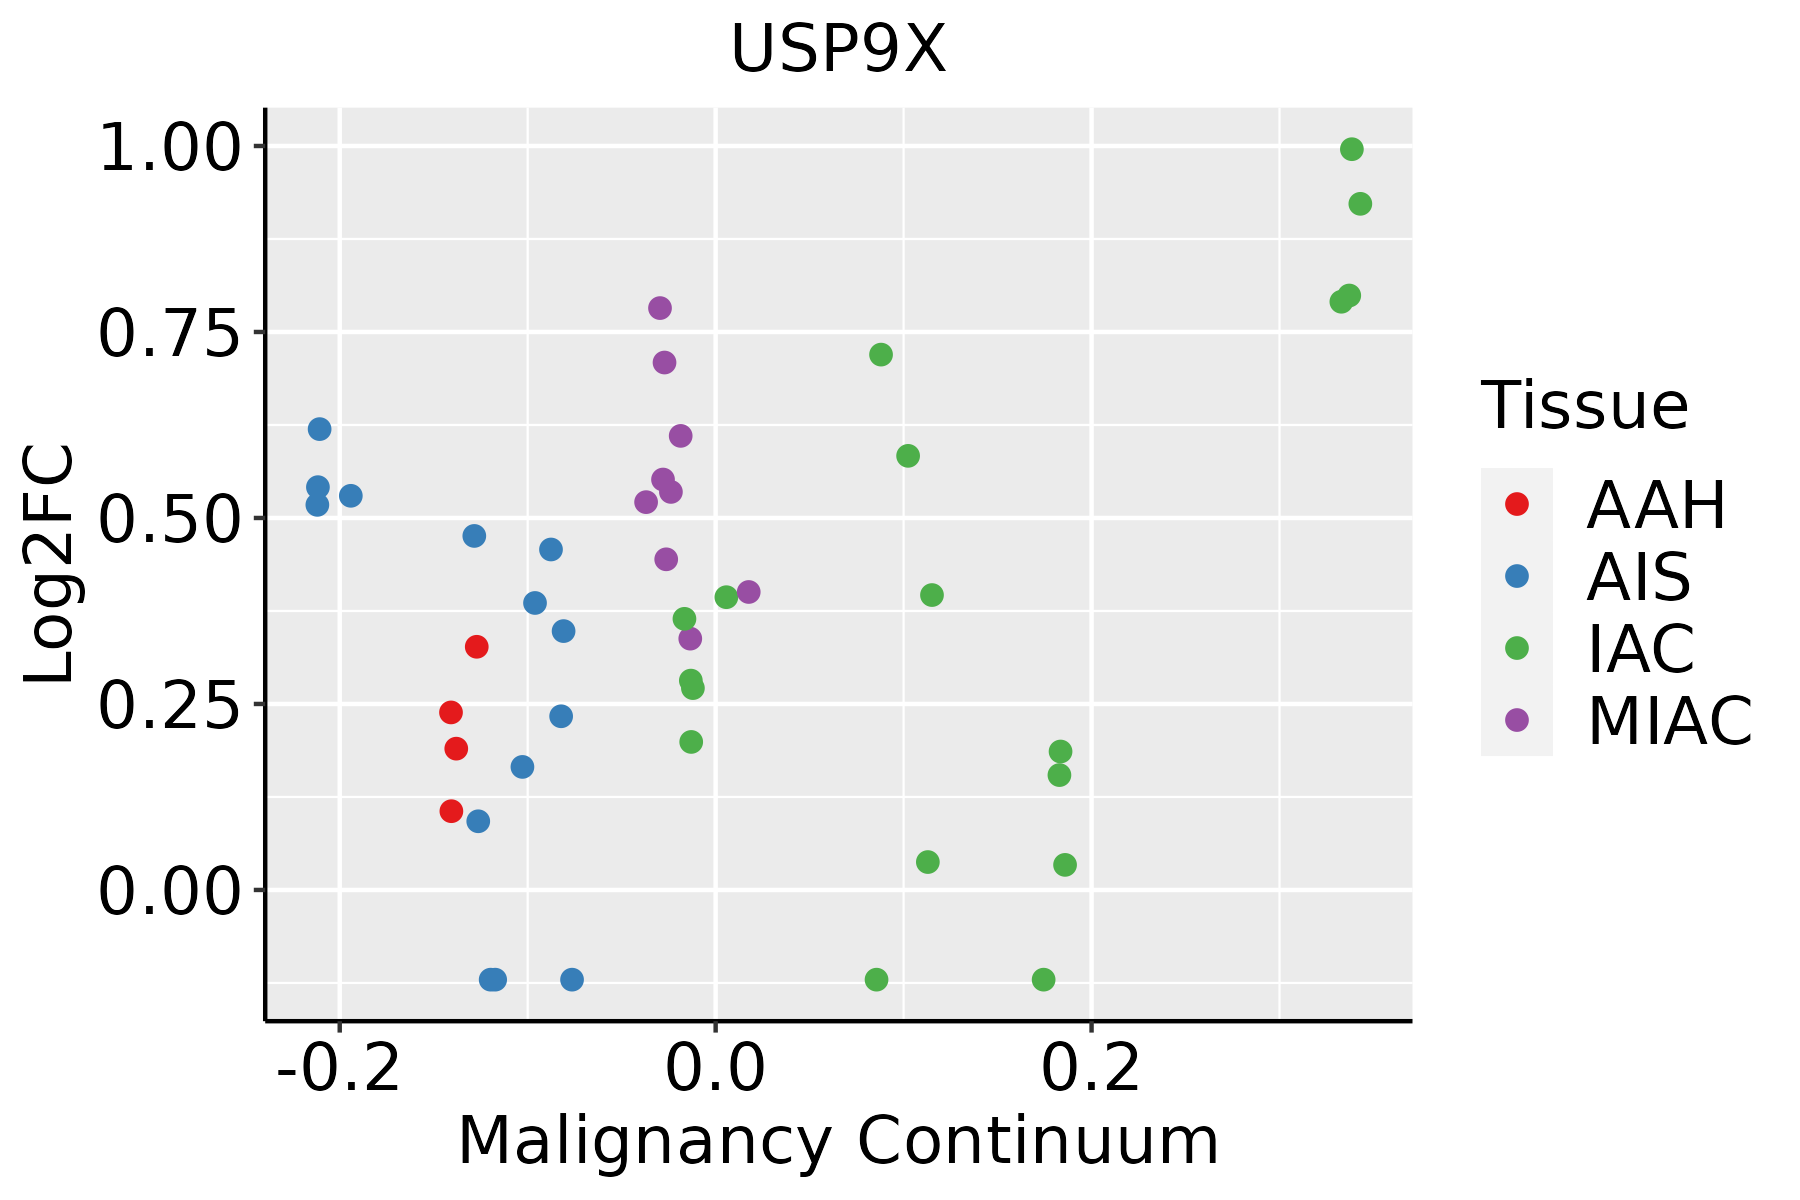 | AAH: Atypical adenomatous hyperplasia |
| AIS: Adenocarcinoma in situ |
| IAC: Invasive lung adenocarcinoma |
| MIA: Minimally invasive adenocarcinoma |
| Oral Cavity |  | EOLP: Erosive Oral lichen planus |
| LP: leukoplakia |
| NEOLP: Non-erosive oral lichen planus |
| OSCC: Oral squamous cell carcinoma |
| Prostate |  | BPH: Benign Prostatic Hyperplasia |
| Skin | 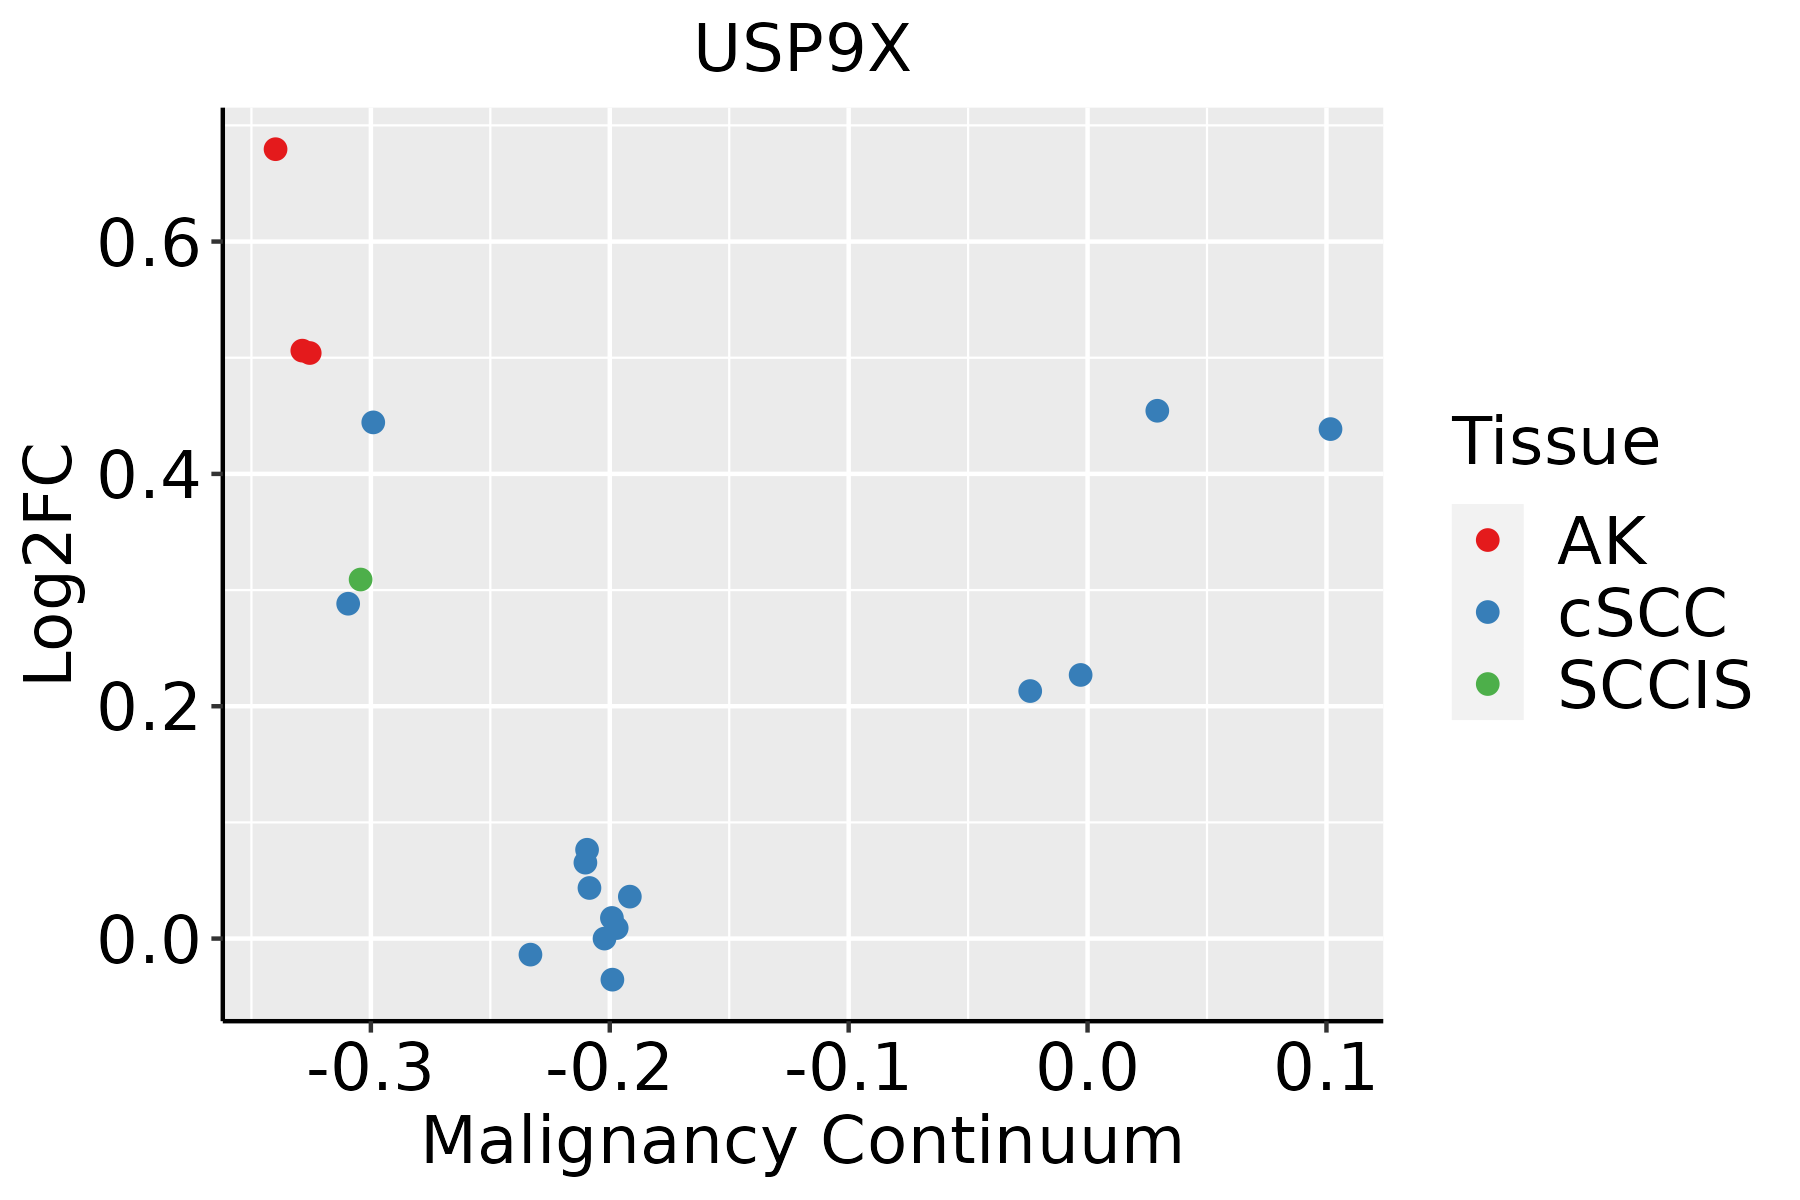 | AK: Actinic keratosis |
| cSCC: Cutaneous squamous cell carcinoma |
| SCCIS:squamous cell carcinoma in situ |
| Thyroid | 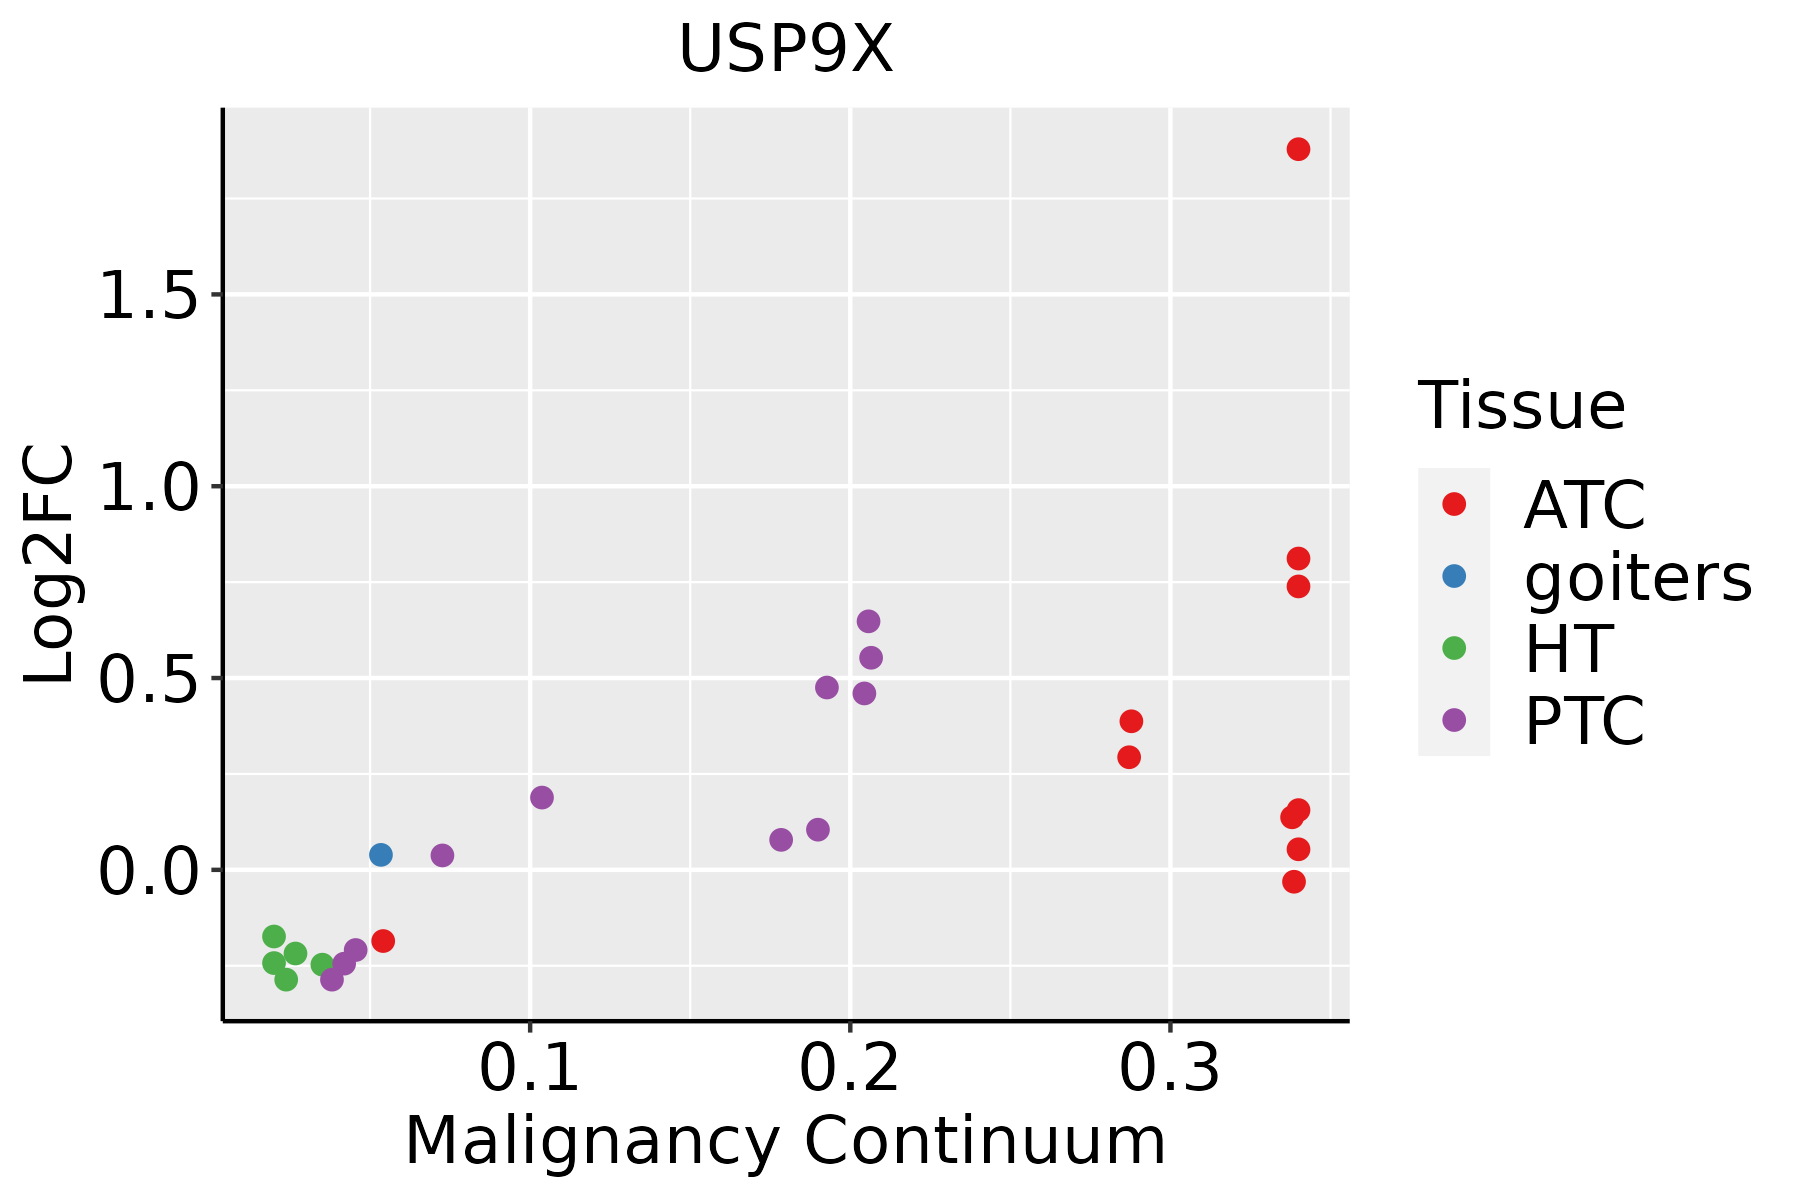 | ATC: Anaplastic thyroid cancer |
| HT: Hashimoto's thyroiditis |
| PTC: Papillary thyroid cancer |
| GO ID | Tissue | Disease Stage | Description | Gene Ratio | Bg Ratio | pvalue | p.adjust | Count |
| GO:00485118 | Cervix | CC | rhythmic process | 65/2311 | 298/18723 | 2.79e-06 | 8.04e-05 | 65 |
| GO:003164710 | Cervix | CC | regulation of protein stability | 63/2311 | 298/18723 | 1.14e-05 | 2.45e-04 | 63 |
| GO:00160498 | Cervix | CC | cell growth | 92/2311 | 482/18723 | 1.16e-05 | 2.49e-04 | 92 |
| GO:00615647 | Cervix | CC | axon development | 89/2311 | 467/18723 | 1.71e-05 | 3.27e-04 | 89 |
| GO:005082110 | Cervix | CC | protein stabilization | 43/2311 | 191/18723 | 5.90e-05 | 8.54e-04 | 43 |
| GO:00076238 | Cervix | CC | circadian rhythm | 46/2311 | 210/18723 | 6.76e-05 | 9.60e-04 | 46 |
| GO:00074097 | Cervix | CC | axonogenesis | 78/2311 | 418/18723 | 1.14e-04 | 1.43e-03 | 78 |
| GO:00071786 | Cervix | CC | transmembrane receptor protein serine/threonine kinase signaling pathway | 67/2311 | 355/18723 | 2.39e-04 | 2.67e-03 | 67 |
| GO:00715595 | Cervix | CC | response to transforming growth factor beta | 50/2311 | 256/18723 | 6.31e-04 | 5.91e-03 | 50 |
| GO:00715605 | Cervix | CC | cellular response to transforming growth factor beta stimulus | 49/2311 | 250/18723 | 6.55e-04 | 6.05e-03 | 49 |
| GO:00605606 | Cervix | CC | developmental growth involved in morphogenesis | 46/2311 | 234/18723 | 8.82e-04 | 7.63e-03 | 46 |
| GO:00510528 | Cervix | CC | regulation of DNA metabolic process | 65/2311 | 359/18723 | 9.25e-04 | 7.84e-03 | 65 |
| GO:00486756 | Cervix | CC | axon extension | 26/2311 | 120/18723 | 2.80e-03 | 1.87e-02 | 26 |
| GO:19901385 | Cervix | CC | neuron projection extension | 34/2311 | 172/18723 | 3.52e-03 | 2.27e-02 | 34 |
| GO:00071795 | Cervix | CC | transforming growth factor beta receptor signaling pathway | 38/2311 | 198/18723 | 3.62e-03 | 2.31e-02 | 38 |
| GO:19900006 | Cervix | CC | amyloid fibril formation | 10/2311 | 34/18723 | 6.40e-03 | 3.58e-02 | 10 |
| GO:00485886 | Cervix | CC | developmental cell growth | 42/2311 | 234/18723 | 7.88e-03 | 4.15e-02 | 42 |
| GO:00711083 | Cervix | CC | protein K48-linked deubiquitination | 10/2311 | 35/18723 | 7.99e-03 | 4.18e-02 | 10 |
| GO:003164715 | Cervix | HSIL_HPV | regulation of protein stability | 31/737 | 298/18723 | 8.69e-07 | 4.19e-05 | 31 |
| GO:005082115 | Cervix | HSIL_HPV | protein stabilization | 21/737 | 191/18723 | 2.17e-05 | 6.58e-04 | 21 |
| Hugo Symbol | Variant Class | Variant Classification | dbSNP RS | HGVSc | HGVSp | HGVSp Short | SWISSPROT | BIOTYPE | SIFT | PolyPhen | Tumor Sample Barcode | Tissue | Histology | Sex | Age | Stage | Therapy Types | Drugs | Outcome |
| USP9X | SNV | Missense_Mutation | novel | c.1903N>A | p.Glu635Lys | p.E635K | Q93008 | protein_coding | tolerated(0.3) | benign(0.009) | TCGA-5L-AAT0-01 | Breast | breast invasive carcinoma | Female | <65 | I/II | Hormone Therapy | tamoxiphen | SD |
| USP9X | SNV | Missense_Mutation | novel | c.6115N>A | p.Glu2039Lys | p.E2039K | Q93008 | protein_coding | tolerated(0.05) | benign(0.33) | TCGA-5L-AAT1-01 | Breast | breast invasive carcinoma | Female | <65 | III/IV | Hormone Therapy | letrozol | SD |
| USP9X | SNV | Missense_Mutation | | c.1969N>T | p.Arg657Trp | p.R657W | Q93008 | protein_coding | deleterious(0) | probably_damaging(0.998) | TCGA-A1-A0SP-01 | Breast | breast invasive carcinoma | Female | <65 | I/II | Chemotherapy | | SD |
| USP9X | SNV | Missense_Mutation | | c.3418G>C | p.Asp1140His | p.D1140H | Q93008 | protein_coding | deleterious(0.04) | probably_damaging(0.992) | TCGA-A2-A04W-01 | Breast | breast invasive carcinoma | Female | <65 | I/II | Chemotherapy | cytoxan | SD |
| USP9X | SNV | Missense_Mutation | | c.6586N>G | p.Leu2196Val | p.L2196V | Q93008 | protein_coding | deleterious(0) | probably_damaging(0.999) | TCGA-A7-A26J-01 | Breast | breast invasive carcinoma | Female | <65 | I/II | Hormone Therapy | tamoxiphen | SD |
| USP9X | SNV | Missense_Mutation | | c.1795N>T | p.Arg599Cys | p.R599C | Q93008 | protein_coding | deleterious(0) | probably_damaging(1) | TCGA-A8-A07W-01 | Breast | breast invasive carcinoma | Female | >=65 | III/IV | Hormone Therapy | exemestane | SD |
| USP9X | SNV | Missense_Mutation | | c.283N>C | p.Glu95Gln | p.E95Q | Q93008 | protein_coding | deleterious(0.01) | probably_damaging(0.974) | TCGA-AC-A23H-01 | Breast | breast invasive carcinoma | Female | >=65 | I/II | Unknown | Unknown | PD |
| USP9X | SNV | Missense_Mutation | novel | c.1644G>T | p.Lys548Asn | p.K548N | Q93008 | protein_coding | deleterious(0) | probably_damaging(0.989) | TCGA-AN-A046-01 | Breast | breast invasive carcinoma | Female | >=65 | I/II | Unknown | Unknown | SD |
| USP9X | SNV | Missense_Mutation | | c.6172C>G | p.His2058Asp | p.H2058D | Q93008 | protein_coding | deleterious(0) | benign(0.347) | TCGA-AN-A0G0-01 | Breast | breast invasive carcinoma | Female | <65 | I/II | Unknown | Unknown | SD |
| USP9X | SNV | Missense_Mutation | rs371450770 | c.3158N>T | p.Thr1053Met | p.T1053M | Q93008 | protein_coding | deleterious(0.01) | possibly_damaging(0.487) | TCGA-AO-A0JD-01 | Breast | breast invasive carcinoma | Female | <65 | III/IV | Chemotherapy | cyclophosphamide | SD |


