
|
|||||
|
 | |
| |
| |
| |
| |
| |
|
Gene: USP6NL |
Gene summary for USP6NL |
| Gene information | Species | Human | Gene symbol | USP6NL | Gene ID | 9712 |
| Gene name | USP6 N-terminal like | |
| Gene Alias | RNTRE | |
| Cytomap | 10p14 | |
| Gene Type | protein-coding | GO ID | GO:0006810 | UniProtAcc | Q92738 |
Top |
Malignant transformation analysis |
| Identification of the aberrant gene expression in precancerous and cancerous lesions by comparing the gene expression of stem-like cells in diseased tissues with normal stem cells |
| Entrez ID | Symbol | Replicates | Species | Organ | Tissue | Adj P-value | Log2FC | Malignancy |
| 9712 | USP6NL | CCI_2 | Human | Cervix | CC | 1.82e-09 | 1.17e+00 | 0.5249 |
| 9712 | USP6NL | CCI_3 | Human | Cervix | CC | 3.15e-11 | 7.71e-01 | 0.516 |
| 9712 | USP6NL | H2 | Human | Cervix | HSIL_HPV | 3.03e-07 | 2.94e-01 | 0.0632 |
| 9712 | USP6NL | AEH-subject1 | Human | Endometrium | AEH | 1.53e-36 | 7.37e-01 | -0.3059 |
| 9712 | USP6NL | AEH-subject2 | Human | Endometrium | AEH | 6.40e-07 | 3.55e-01 | -0.2525 |
| 9712 | USP6NL | AEH-subject3 | Human | Endometrium | AEH | 2.17e-08 | 3.66e-01 | -0.2576 |
| 9712 | USP6NL | AEH-subject4 | Human | Endometrium | AEH | 2.77e-19 | 6.50e-01 | -0.2657 |
| 9712 | USP6NL | AEH-subject5 | Human | Endometrium | AEH | 2.68e-25 | 7.22e-01 | -0.2953 |
| 9712 | USP6NL | EEC-subject1 | Human | Endometrium | EEC | 9.14e-34 | 8.41e-01 | -0.2682 |
| 9712 | USP6NL | EEC-subject2 | Human | Endometrium | EEC | 4.95e-15 | 5.00e-01 | -0.2607 |
| 9712 | USP6NL | EEC-subject3 | Human | Endometrium | EEC | 1.41e-09 | 3.99e-01 | -0.2525 |
| 9712 | USP6NL | EEC-subject4 | Human | Endometrium | EEC | 1.08e-02 | 2.17e-01 | -0.2571 |
| 9712 | USP6NL | EEC-subject5 | Human | Endometrium | EEC | 1.35e-07 | 3.34e-01 | -0.249 |
| 9712 | USP6NL | GSM6177620_NYU_UCEC1_lib3_lib3 | Human | Endometrium | EEC | 2.61e-02 | -3.34e-02 | -0.1883 |
| 9712 | USP6NL | GSM6177621_NYU_UCEC2_lib1_lib1 | Human | Endometrium | EEC | 1.17e-03 | 9.77e-02 | -0.1934 |
| 9712 | USP6NL | GSM6177622_NYU_UCEC3_lib1_lib1 | Human | Endometrium | EEC | 9.56e-05 | 6.70e-03 | -0.1917 |
| 9712 | USP6NL | GSM6177622_NYU_UCEC3_lib2_lib2 | Human | Endometrium | EEC | 3.60e-03 | -4.98e-02 | -0.1916 |
| 9712 | USP6NL | LZE4T | Human | Esophagus | ESCC | 1.90e-03 | 7.06e-02 | 0.0811 |
| 9712 | USP6NL | LZE20T | Human | Esophagus | ESCC | 7.61e-03 | 1.37e-01 | 0.0662 |
| 9712 | USP6NL | LZE22D1 | Human | Esophagus | HGIN | 1.09e-02 | 1.59e-01 | 0.0595 |
| Page: 1 2 3 4 5 |
| Tissue | Expression Dynamics | Abbreviation |
| Cervix |  | CC: Cervix cancer |
| HSIL_HPV: HPV-infected high-grade squamous intraepithelial lesions | ||
| N_HPV: HPV-infected normal cervix | ||
| Endometrium |  | AEH: Atypical endometrial hyperplasia |
| EEC: Endometrioid Cancer | ||
| Esophagus | 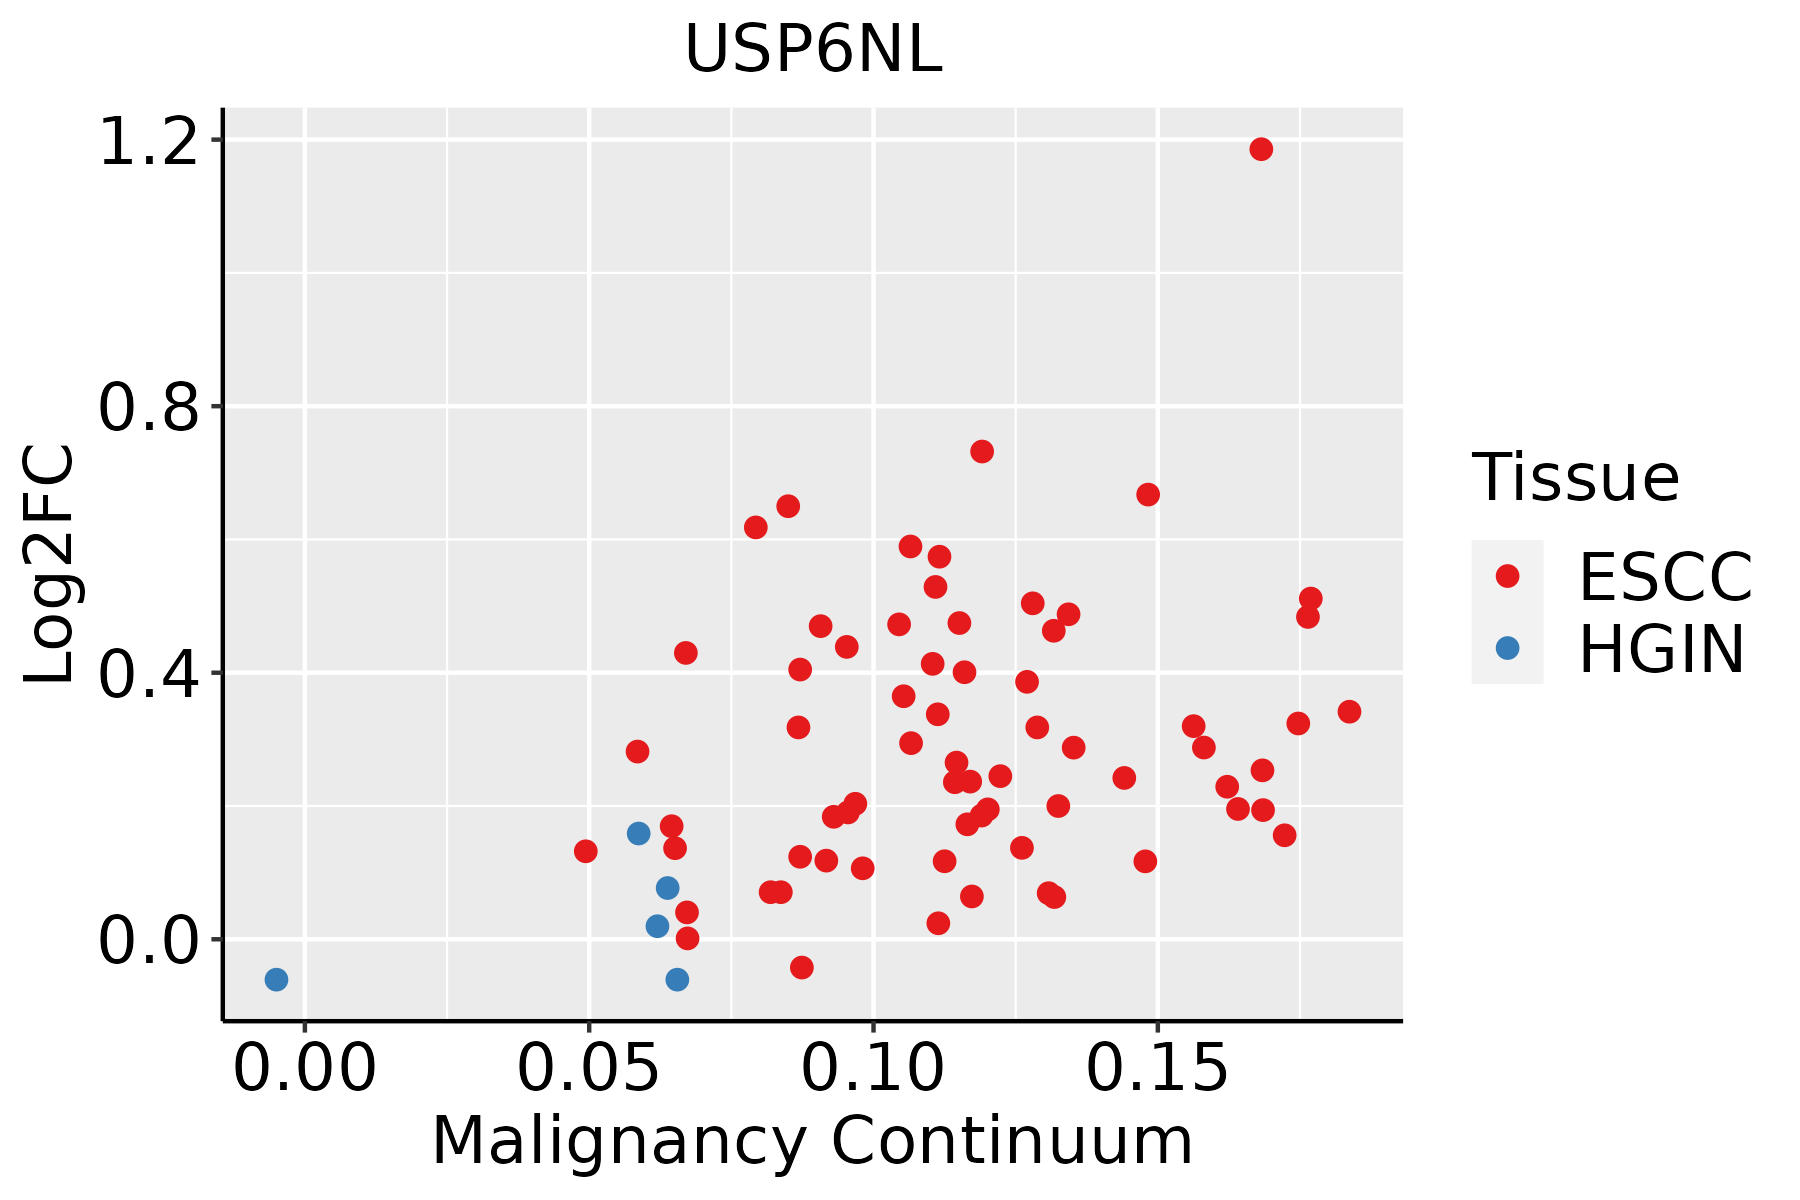 | ESCC: Esophageal squamous cell carcinoma |
| HGIN: High-grade intraepithelial neoplasias | ||
| LGIN: Low-grade intraepithelial neoplasias | ||
| Liver | 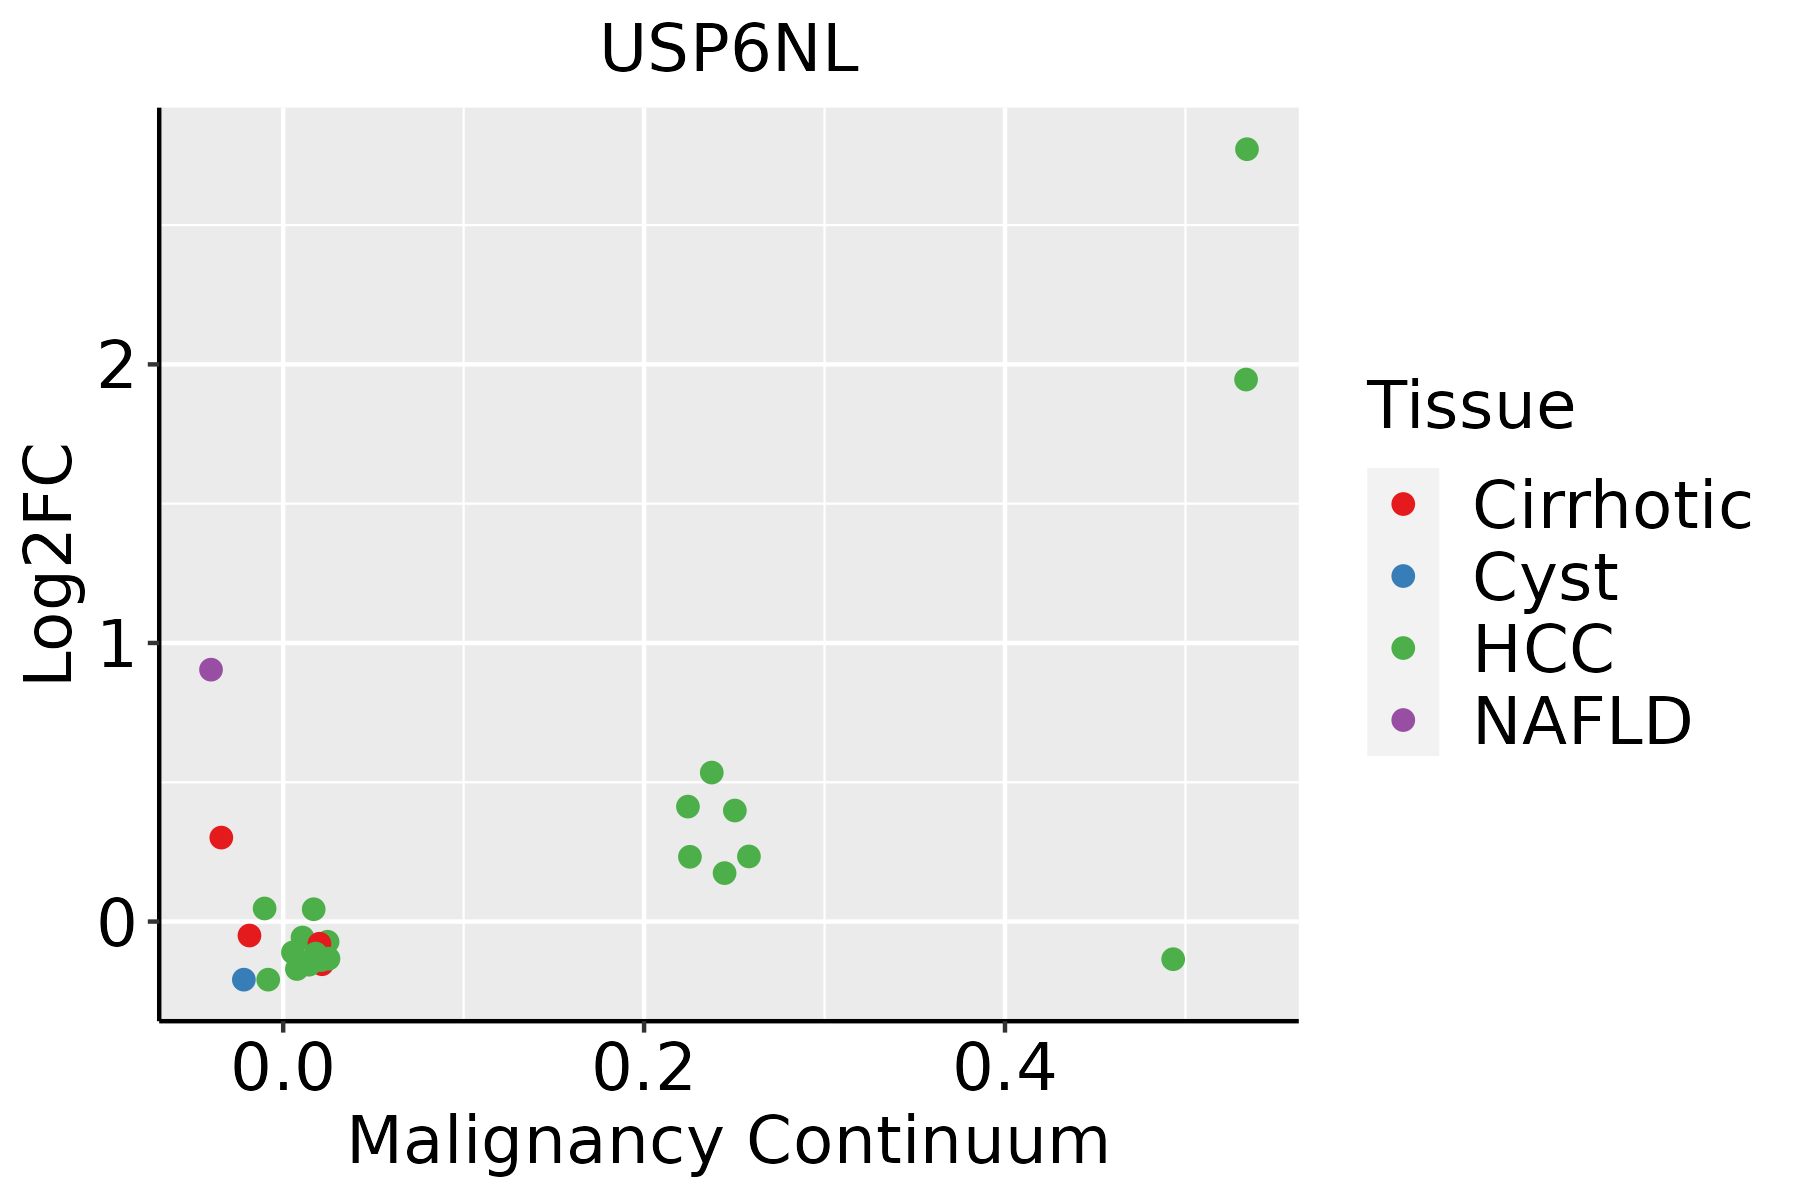 | HCC: Hepatocellular carcinoma |
| NAFLD: Non-alcoholic fatty liver disease | ||
| Lung | 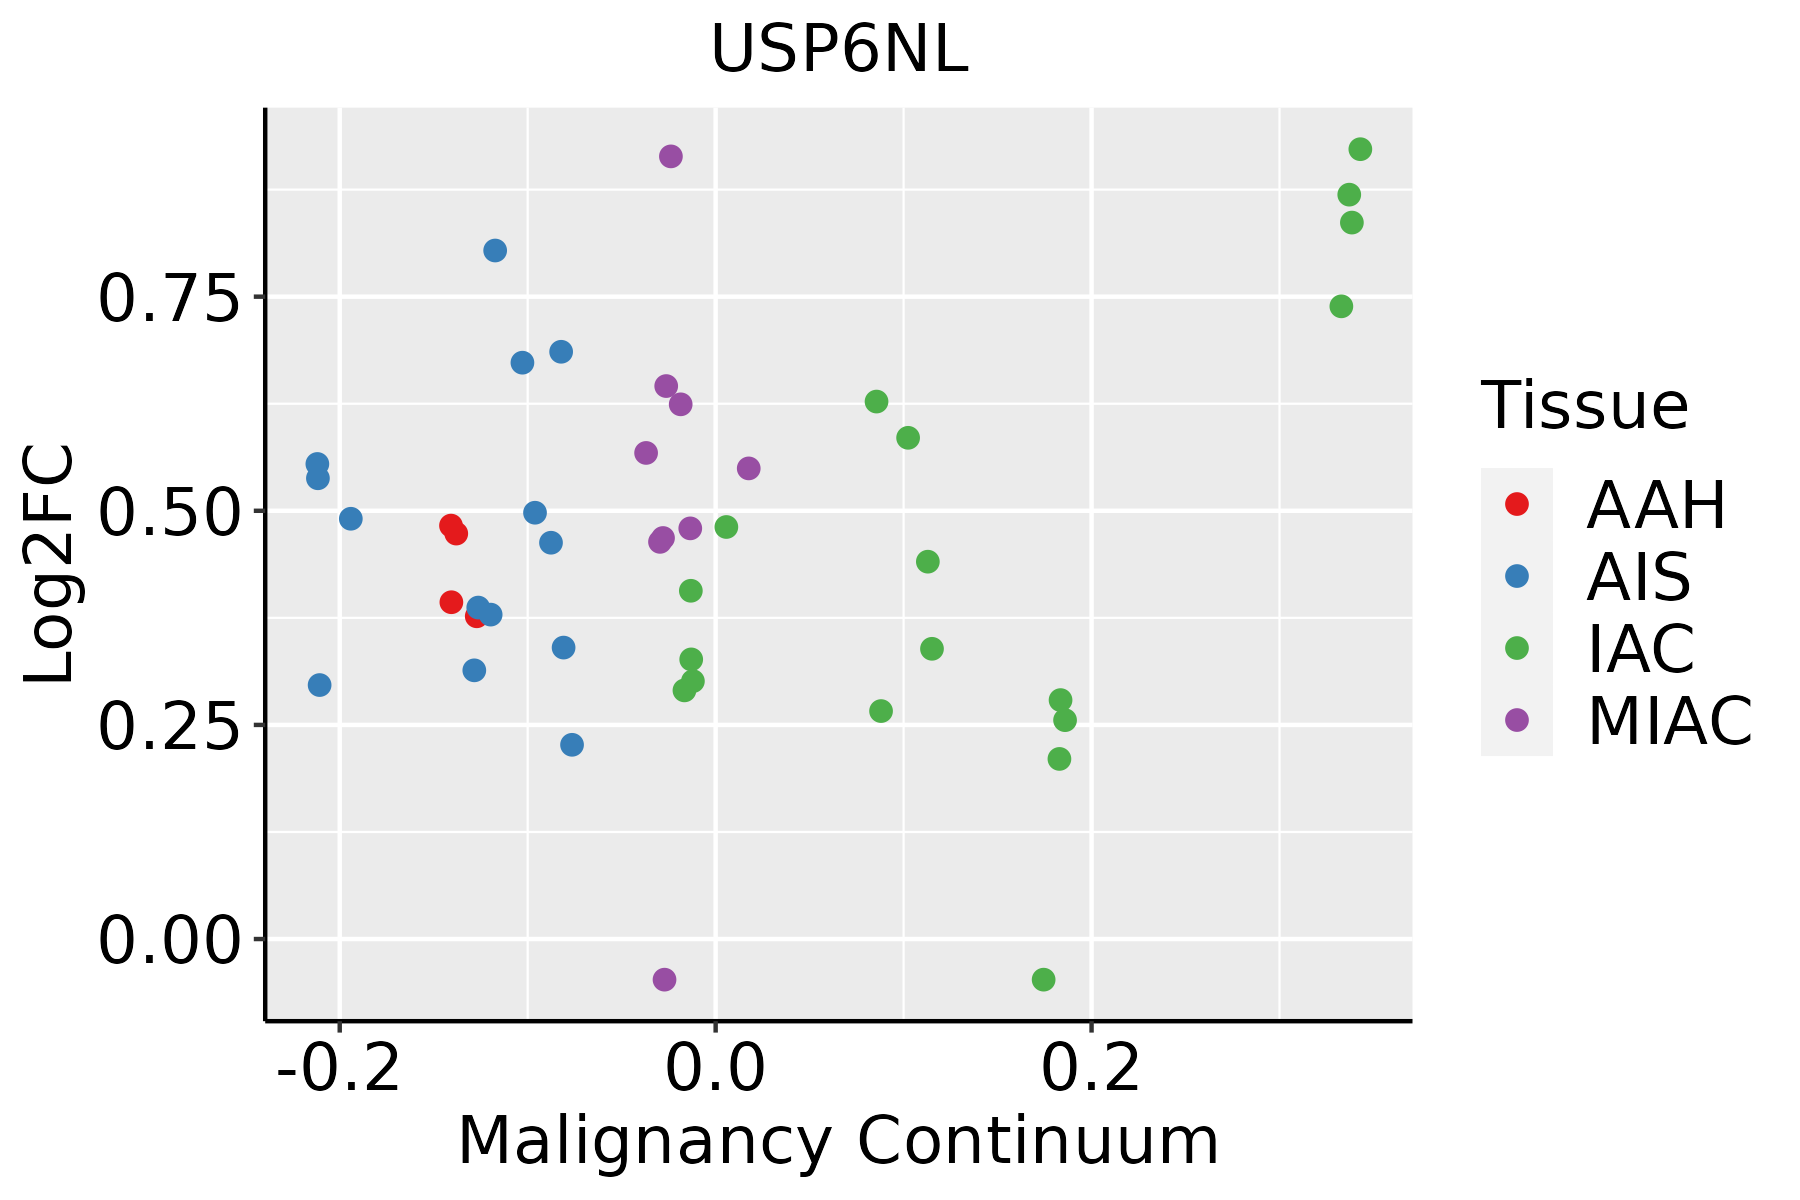 | AAH: Atypical adenomatous hyperplasia |
| AIS: Adenocarcinoma in situ | ||
| IAC: Invasive lung adenocarcinoma | ||
| MIA: Minimally invasive adenocarcinoma |
| ∗log2FC in expression of this searched gene in stem-like cells from each diseased tissue sample relative to stem-like cells in normal samples in each tissue plotted against the malignancy continuum. Samples are colored based on if they are from different disease stage. |
Top |
Malignant transformation related pathway analysis |
| Find out the enriched GO biological processes and KEGG pathways involved in transition from healthy to precancer to cancer |
| Tissue | Disease Stage | Enriched GO biological Processes |
| Colorectum | AD |  |
| Colorectum | SER |  |
| Colorectum | MSS |  |
| Colorectum | MSI-H |  |
| Colorectum | FAP |  |
| ∗Top 15 enriched GO BP terms are showed in the bar plot of each disease state in each tissue. Each row represents a significant GO biological process which is colored according to the -log10(p.adjust). |
| Page: 1 2 3 4 5 6 7 8 9 |
| GO ID | Tissue | Disease Stage | Description | Gene Ratio | Bg Ratio | pvalue | p.adjust | Count |
| GO:001603210 | Cervix | CC | viral process | 109/2311 | 415/18723 | 5.40e-15 | 6.46e-12 | 109 |
| GO:001905810 | Cervix | CC | viral life cycle | 87/2311 | 317/18723 | 2.20e-13 | 1.20e-10 | 87 |
| GO:00430877 | Cervix | CC | regulation of GTPase activity | 79/2311 | 348/18723 | 4.21e-08 | 2.60e-06 | 79 |
| GO:00435476 | Cervix | CC | positive regulation of GTPase activity | 53/2311 | 255/18723 | 8.72e-05 | 1.16e-03 | 53 |
| GO:19033583 | Cervix | CC | regulation of Golgi organization | 7/2311 | 17/18723 | 2.72e-03 | 1.85e-02 | 7 |
| GO:00070304 | Cervix | CC | Golgi organization | 32/2311 | 157/18723 | 2.78e-03 | 1.87e-02 | 32 |
| GO:001905815 | Cervix | HSIL_HPV | viral life cycle | 35/737 | 317/18723 | 3.94e-08 | 3.17e-06 | 35 |
| GO:001603215 | Cervix | HSIL_HPV | viral process | 41/737 | 415/18723 | 6.43e-08 | 4.49e-06 | 41 |
| GO:001603216 | Endometrium | AEH | viral process | 110/2100 | 415/18723 | 1.99e-18 | 1.09e-15 | 110 |
| GO:001905816 | Endometrium | AEH | viral life cycle | 86/2100 | 317/18723 | 2.53e-15 | 7.58e-13 | 86 |
| GO:00430878 | Endometrium | AEH | regulation of GTPase activity | 66/2100 | 348/18723 | 1.26e-05 | 2.77e-04 | 66 |
| GO:00435477 | Endometrium | AEH | positive regulation of GTPase activity | 48/2100 | 255/18723 | 2.18e-04 | 2.67e-03 | 48 |
| GO:00070305 | Endometrium | AEH | Golgi organization | 32/2100 | 157/18723 | 5.73e-04 | 5.69e-03 | 32 |
| GO:00906304 | Endometrium | AEH | activation of GTPase activity | 22/2100 | 115/18723 | 8.42e-03 | 4.60e-02 | 22 |
| GO:001603217 | Endometrium | EEC | viral process | 112/2168 | 415/18723 | 2.48e-18 | 1.35e-15 | 112 |
| GO:001905817 | Endometrium | EEC | viral life cycle | 86/2168 | 317/18723 | 1.63e-14 | 4.65e-12 | 86 |
| GO:004308712 | Endometrium | EEC | regulation of GTPase activity | 67/2168 | 348/18723 | 1.84e-05 | 3.43e-04 | 67 |
| GO:004354712 | Endometrium | EEC | positive regulation of GTPase activity | 50/2168 | 255/18723 | 1.26e-04 | 1.66e-03 | 50 |
| GO:000703012 | Endometrium | EEC | Golgi organization | 32/2168 | 157/18723 | 9.87e-04 | 8.76e-03 | 32 |
| GO:009063012 | Endometrium | EEC | activation of GTPase activity | 23/2168 | 115/18723 | 6.04e-03 | 3.57e-02 | 23 |
| Page: 1 2 3 4 |
| Pathway ID | Tissue | Disease Stage | Description | Gene Ratio | Bg Ratio | pvalue | p.adjust | qvalue | Count |
| Page: 1 |
Top |
Cell-cell communication analysis |
| Identification of potential cell-cell interactions between two cell types and their ligand-receptor pairs for different disease states |
| Ligand | Receptor | LRpair | Pathway | Tissue | Disease Stage |
| Page: 1 |
Top |
Single-cell gene regulatory network inference analysis |
| Find out the significant the regulons (TFs) and the target genes of each regulon across cell types for different disease states |
| TF | Cell Type | Tissue | Disease Stage | Target Gene | RSS | Regulon Activity |
| ∗The dot plots of a searched regulon are shown for all cell subpopulations in each disease state of each tissue based on the regulon specific score inferred using pySCENIC and by calculating the average expression. |
| Page: 1 |
Top |
Somatic mutation of malignant transformation related genes |
| Annotation of somatic variants for genes involved in malignant transformation |
| Hugo Symbol | Variant Class | Variant Classification | dbSNP RS | HGVSc | HGVSp | HGVSp Short | SWISSPROT | BIOTYPE | SIFT | PolyPhen | Tumor Sample Barcode | Tissue | Histology | Sex | Age | Stage | Therapy Types | Drugs | Outcome |
| USP6NL | SNV | Missense_Mutation | c.1697C>T | p.Ser566Leu | p.S566L | Q92738 | protein_coding | deleterious(0) | probably_damaging(0.998) | TCGA-AC-A23H-01 | Breast | breast invasive carcinoma | Female | >=65 | I/II | Unknown | Unknown | PD | |
| USP6NL | SNV | Missense_Mutation | c.754C>G | p.Gln252Glu | p.Q252E | Q92738 | protein_coding | deleterious(0.03) | probably_damaging(0.943) | TCGA-AC-A23H-01 | Breast | breast invasive carcinoma | Female | >=65 | I/II | Unknown | Unknown | PD | |
| USP6NL | SNV | Missense_Mutation | c.338N>A | p.Arg113Gln | p.R113Q | Q92738 | protein_coding | deleterious(0) | probably_damaging(0.994) | TCGA-AN-A046-01 | Breast | breast invasive carcinoma | Female | >=65 | I/II | Unknown | Unknown | SD | |
| USP6NL | SNV | Missense_Mutation | c.1888G>C | p.Ala630Pro | p.A630P | Q92738 | protein_coding | tolerated_low_confidence(1) | benign(0) | TCGA-D8-A1XK-01 | Breast | breast invasive carcinoma | Female | <65 | I/II | Chemotherapy | doxorubicine+cyclophosphamide | SD | |
| USP6NL | insertion | In_Frame_Ins | novel | c.57_58insAACAGGAGATTAAATCATAGAAAG | p.Asp19_Ser20insAsnArgArgLeuAsnHisArgLys | p.D19_S20insNRRLNHRK | Q92738 | protein_coding | TCGA-A8-A07J-01 | Breast | breast invasive carcinoma | Female | <65 | I/II | Chemotherapy | 5-fluorouracil | CR | ||
| USP6NL | insertion | Frame_Shift_Ins | novel | c.2236_2237insCCTTTGGATGGAGCAGGTTTGAGAC | p.Tyr746SerfsTer13 | p.Y746Sfs*13 | Q92738 | protein_coding | TCGA-AN-A0FN-01 | Breast | breast invasive carcinoma | Female | <65 | I/II | Unknown | Unknown | SD | ||
| USP6NL | insertion | Frame_Shift_Ins | novel | c.1156_1157insAGTTACCGTCCCAGGTCCT | p.Pro386GlnfsTer14 | p.P386Qfs*14 | Q92738 | protein_coding | TCGA-BH-A0HO-01 | Breast | breast invasive carcinoma | Female | <65 | I/II | Chemotherapy | cyclophosphamide | SD | ||
| USP6NL | insertion | Frame_Shift_Ins | novel | c.1154_1155insCCCCGCGCTC | p.Lys385AsnfsTer12 | p.K385Nfs*12 | Q92738 | protein_coding | TCGA-BH-A0HO-01 | Breast | breast invasive carcinoma | Female | <65 | I/II | Chemotherapy | cyclophosphamide | SD | ||
| USP6NL | SNV | Missense_Mutation | novel | c.2168G>T | p.Gly723Val | p.G723V | Q92738 | protein_coding | deleterious_low_confidence(0.01) | benign(0.408) | TCGA-2W-A8YY-01 | Cervix | cervical & endocervical cancer | Female | <65 | I/II | Chemotherapy | cisplatin | CR |
| USP6NL | SNV | Missense_Mutation | rs756050004 | c.1318G>A | p.Gly440Arg | p.G440R | Q92738 | protein_coding | deleterious(0.05) | benign(0.023) | TCGA-2W-A8YY-01 | Cervix | cervical & endocervical cancer | Female | <65 | I/II | Chemotherapy | cisplatin | CR |
| Page: 1 2 3 4 5 6 7 8 9 10 |
Top |
Related drugs of malignant transformation related genes |
| Identification of chemicals and drugs interact with genes involved in malignant transfromation |
| (DGIdb 4.0) |
| Entrez ID | Symbol | Category | Interaction Types | Drug Claim Name | Drug Name | PMIDs |
| Page: 1 |

Copyright 2023-Present -The University of Texas Health Science Center at Houston |