
|
|||||
|
 | |
| |
| |
| |
| |
| |
|
Gene: USP5 |
Gene summary for USP5 |
| Gene information | Species | Human | Gene symbol | USP5 | Gene ID | 8078 |
| Gene name | ubiquitin specific peptidase 5 | |
| Gene Alias | ISOT | |
| Cytomap | 12p13.31 | |
| Gene Type | protein-coding | GO ID | GO:0006464 | UniProtAcc | A0A140VJZ1 |
Top |
Malignant transformation analysis |
| Identification of the aberrant gene expression in precancerous and cancerous lesions by comparing the gene expression of stem-like cells in diseased tissues with normal stem cells |
| Entrez ID | Symbol | Replicates | Species | Organ | Tissue | Adj P-value | Log2FC | Malignancy |
| 8078 | USP5 | HTA11_3410_2000001011 | Human | Colorectum | AD | 9.57e-04 | 1.56e-01 | 0.0155 |
| 8078 | USP5 | HTA11_2487_2000001011 | Human | Colorectum | SER | 5.92e-04 | 2.68e-01 | -0.1808 |
| 8078 | USP5 | HTA11_1938_2000001011 | Human | Colorectum | AD | 8.81e-10 | 4.33e-01 | -0.0811 |
| 8078 | USP5 | HTA11_347_2000001011 | Human | Colorectum | AD | 2.10e-05 | 2.55e-01 | -0.1954 |
| 8078 | USP5 | HTA11_411_2000001011 | Human | Colorectum | SER | 5.24e-03 | 5.44e-01 | -0.2602 |
| 8078 | USP5 | HTA11_696_2000001011 | Human | Colorectum | AD | 4.25e-14 | 3.22e-01 | -0.1464 |
| 8078 | USP5 | HTA11_866_2000001011 | Human | Colorectum | AD | 2.71e-08 | 2.37e-01 | -0.1001 |
| 8078 | USP5 | HTA11_1391_2000001011 | Human | Colorectum | AD | 5.43e-10 | 4.42e-01 | -0.059 |
| 8078 | USP5 | HTA11_6801_2000001011 | Human | Colorectum | SER | 1.18e-07 | 4.91e-01 | 0.0171 |
| 8078 | USP5 | HTA11_7696_3000711011 | Human | Colorectum | AD | 4.40e-15 | 4.24e-01 | 0.0674 |
| 8078 | USP5 | HTA11_6818_2000001021 | Human | Colorectum | AD | 1.05e-02 | 2.43e-01 | 0.0588 |
| 8078 | USP5 | HTA11_99999970781_79442 | Human | Colorectum | MSS | 2.03e-26 | 4.74e-01 | 0.294 |
| 8078 | USP5 | HTA11_99999965062_69753 | Human | Colorectum | MSI-H | 6.62e-03 | 9.44e-01 | 0.3487 |
| 8078 | USP5 | HTA11_99999965104_69814 | Human | Colorectum | MSS | 1.57e-02 | 3.03e-01 | 0.281 |
| 8078 | USP5 | HTA11_99999971662_82457 | Human | Colorectum | MSS | 8.28e-24 | 4.91e-01 | 0.3859 |
| 8078 | USP5 | HTA11_99999974143_84620 | Human | Colorectum | MSS | 1.50e-08 | 2.94e-01 | 0.3005 |
| 8078 | USP5 | LZE4T | Human | Esophagus | ESCC | 9.29e-03 | 1.59e-01 | 0.0811 |
| 8078 | USP5 | LZE7T | Human | Esophagus | ESCC | 4.74e-04 | 3.83e-01 | 0.0667 |
| 8078 | USP5 | LZE8T | Human | Esophagus | ESCC | 1.12e-08 | 2.94e-01 | 0.067 |
| 8078 | USP5 | LZE24T | Human | Esophagus | ESCC | 3.28e-05 | 2.09e-01 | 0.0596 |
| Page: 1 2 3 4 5 6 7 |
| Tissue | Expression Dynamics | Abbreviation |
| Colorectum (GSE201348) |  | FAP: Familial adenomatous polyposis |
| CRC: Colorectal cancer | ||
| Colorectum (HTA11) | 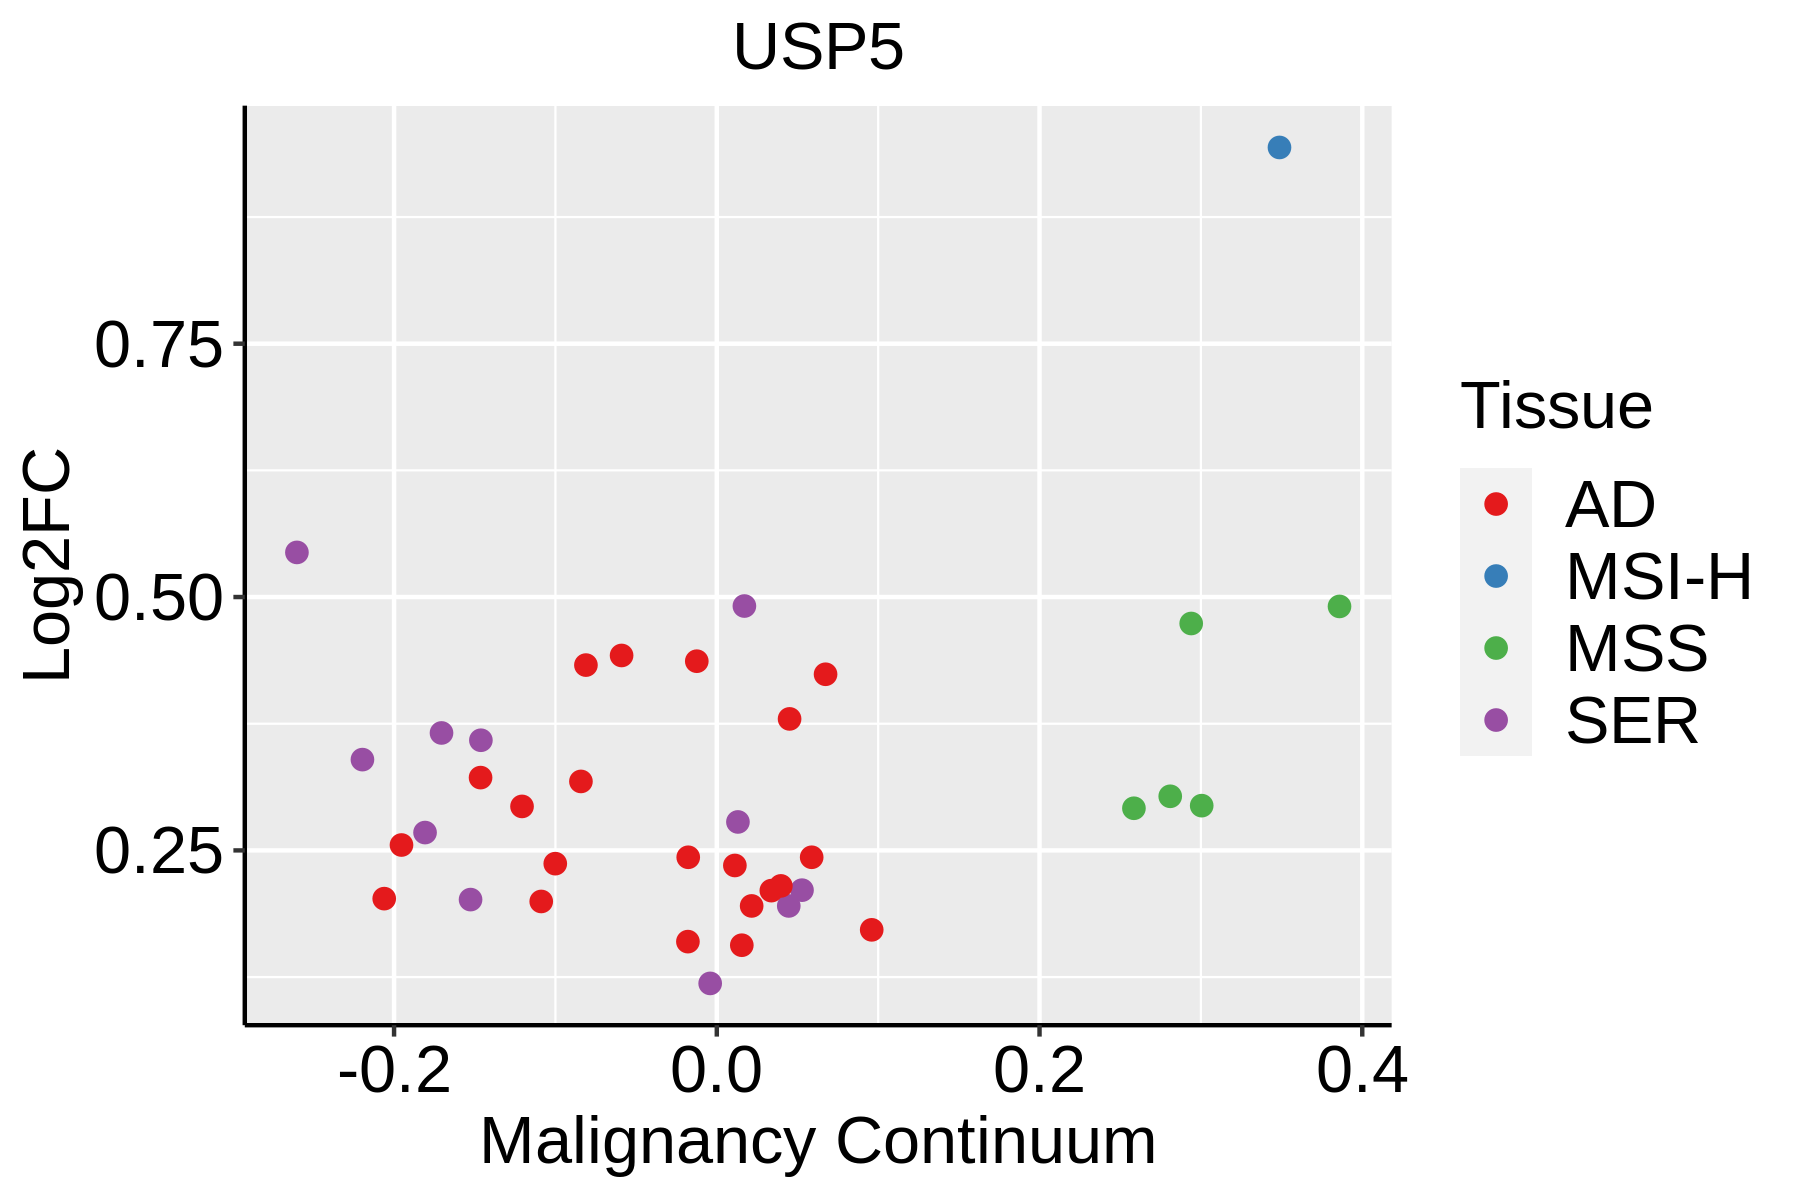 | AD: Adenomas |
| SER: Sessile serrated lesions | ||
| MSI-H: Microsatellite-high colorectal cancer | ||
| MSS: Microsatellite stable colorectal cancer | ||
| Esophagus | 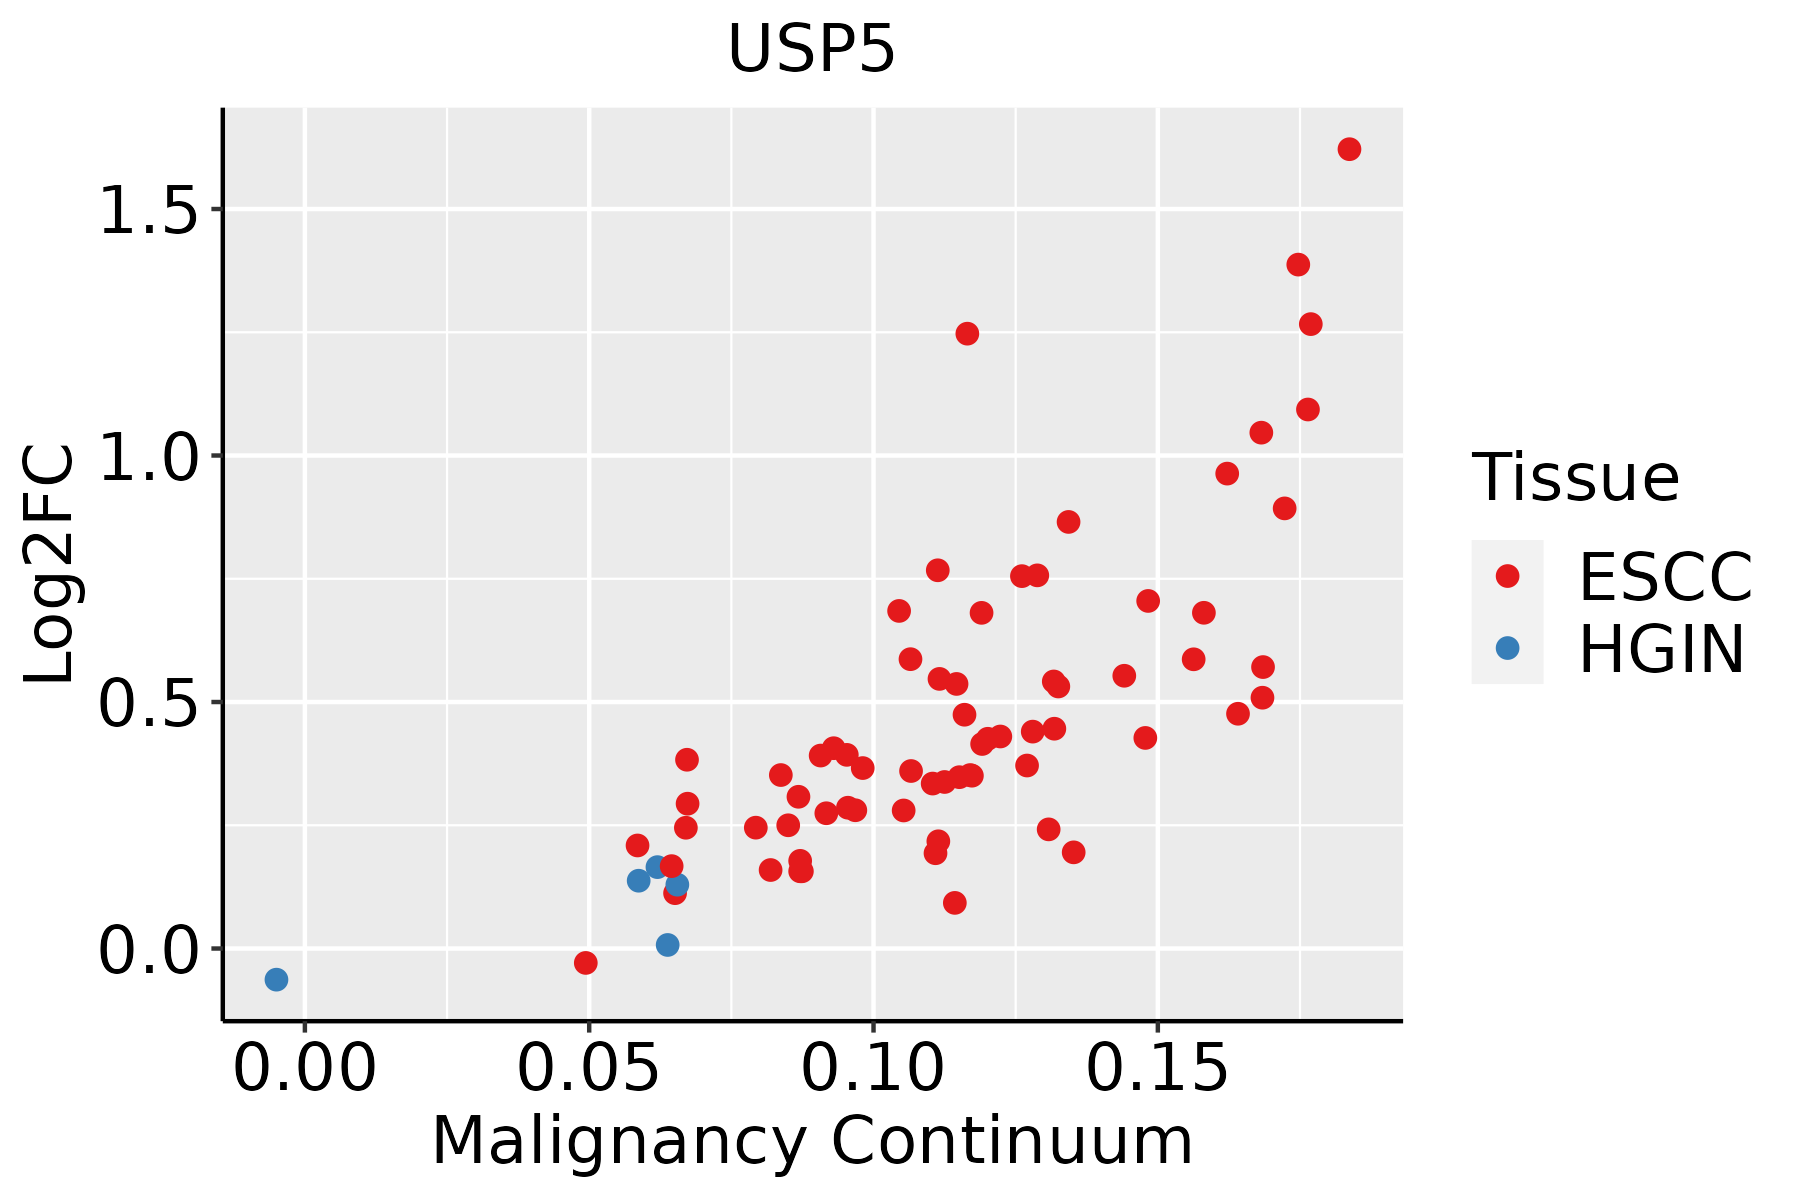 | ESCC: Esophageal squamous cell carcinoma |
| HGIN: High-grade intraepithelial neoplasias | ||
| LGIN: Low-grade intraepithelial neoplasias | ||
| Liver | 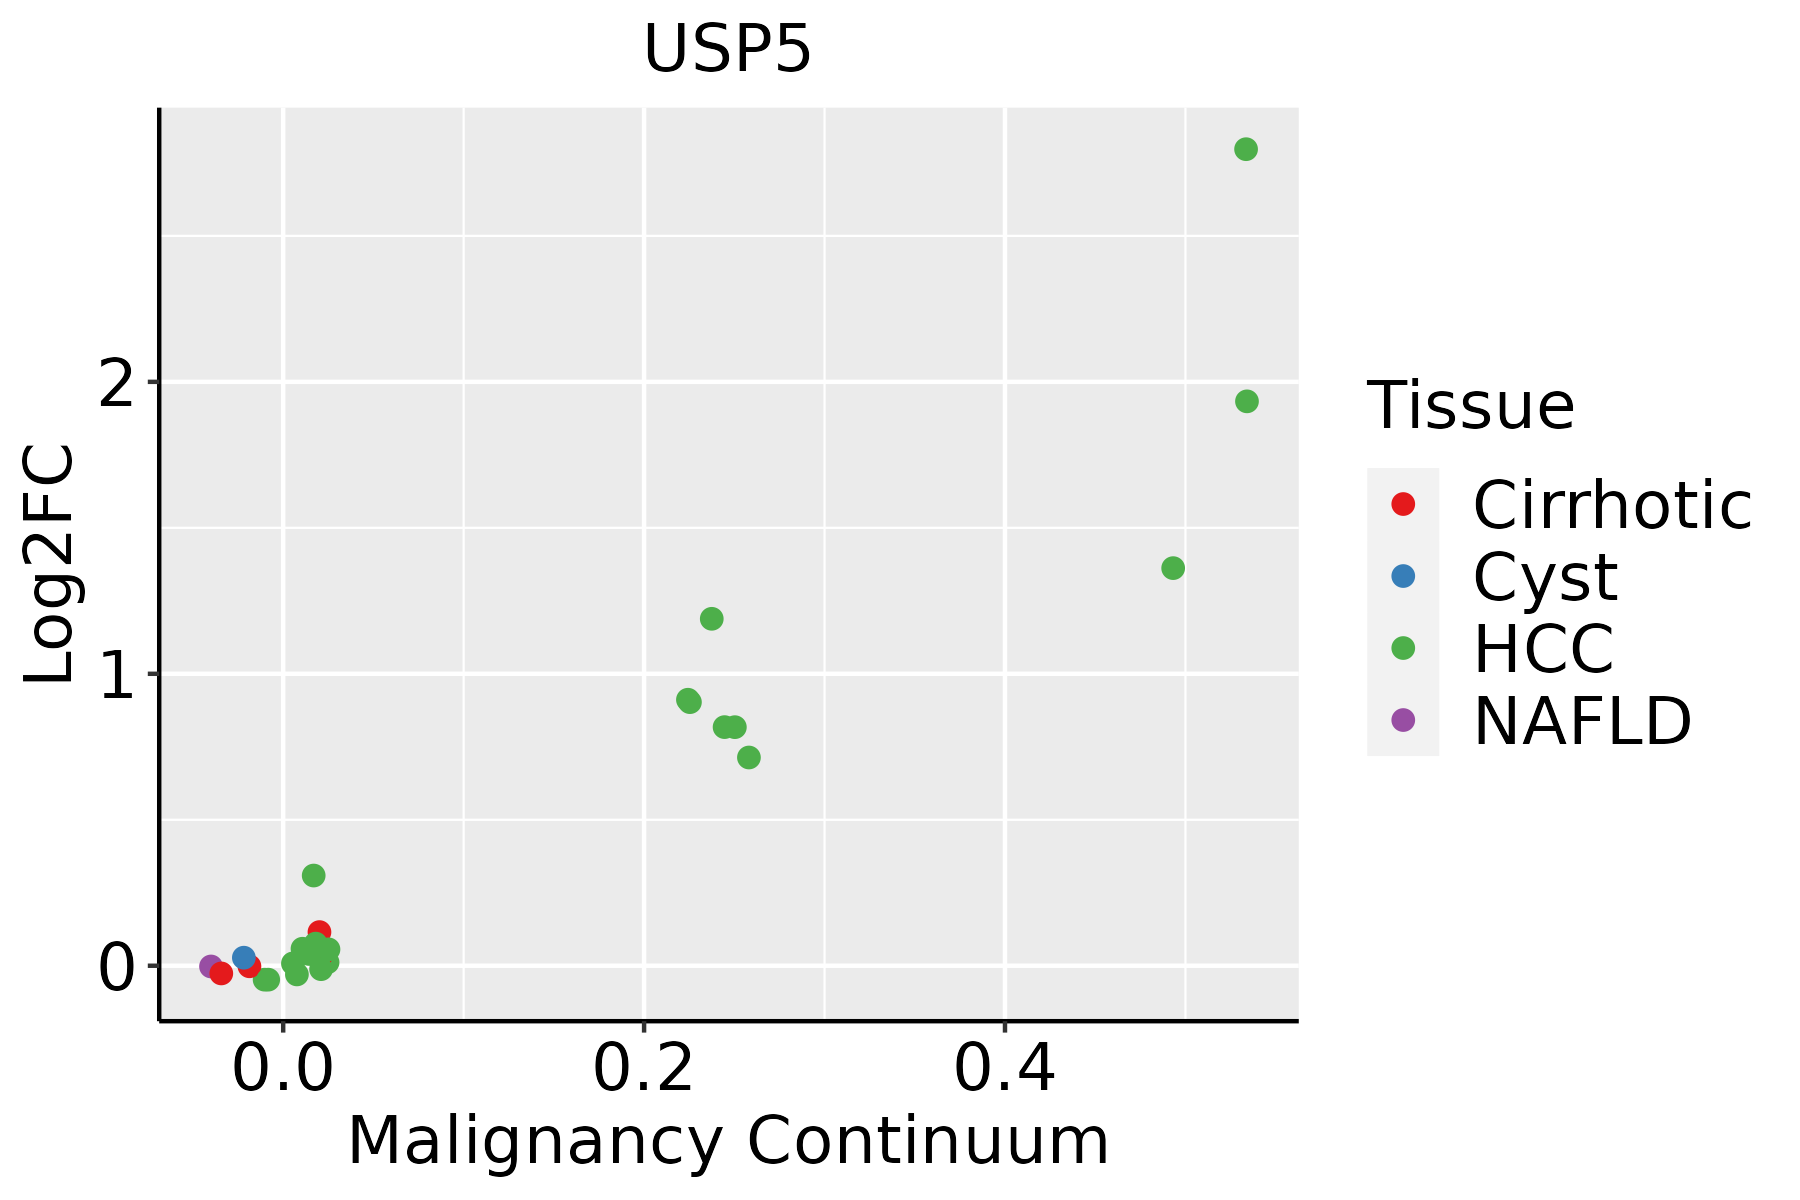 | HCC: Hepatocellular carcinoma |
| NAFLD: Non-alcoholic fatty liver disease | ||
| Oral Cavity | 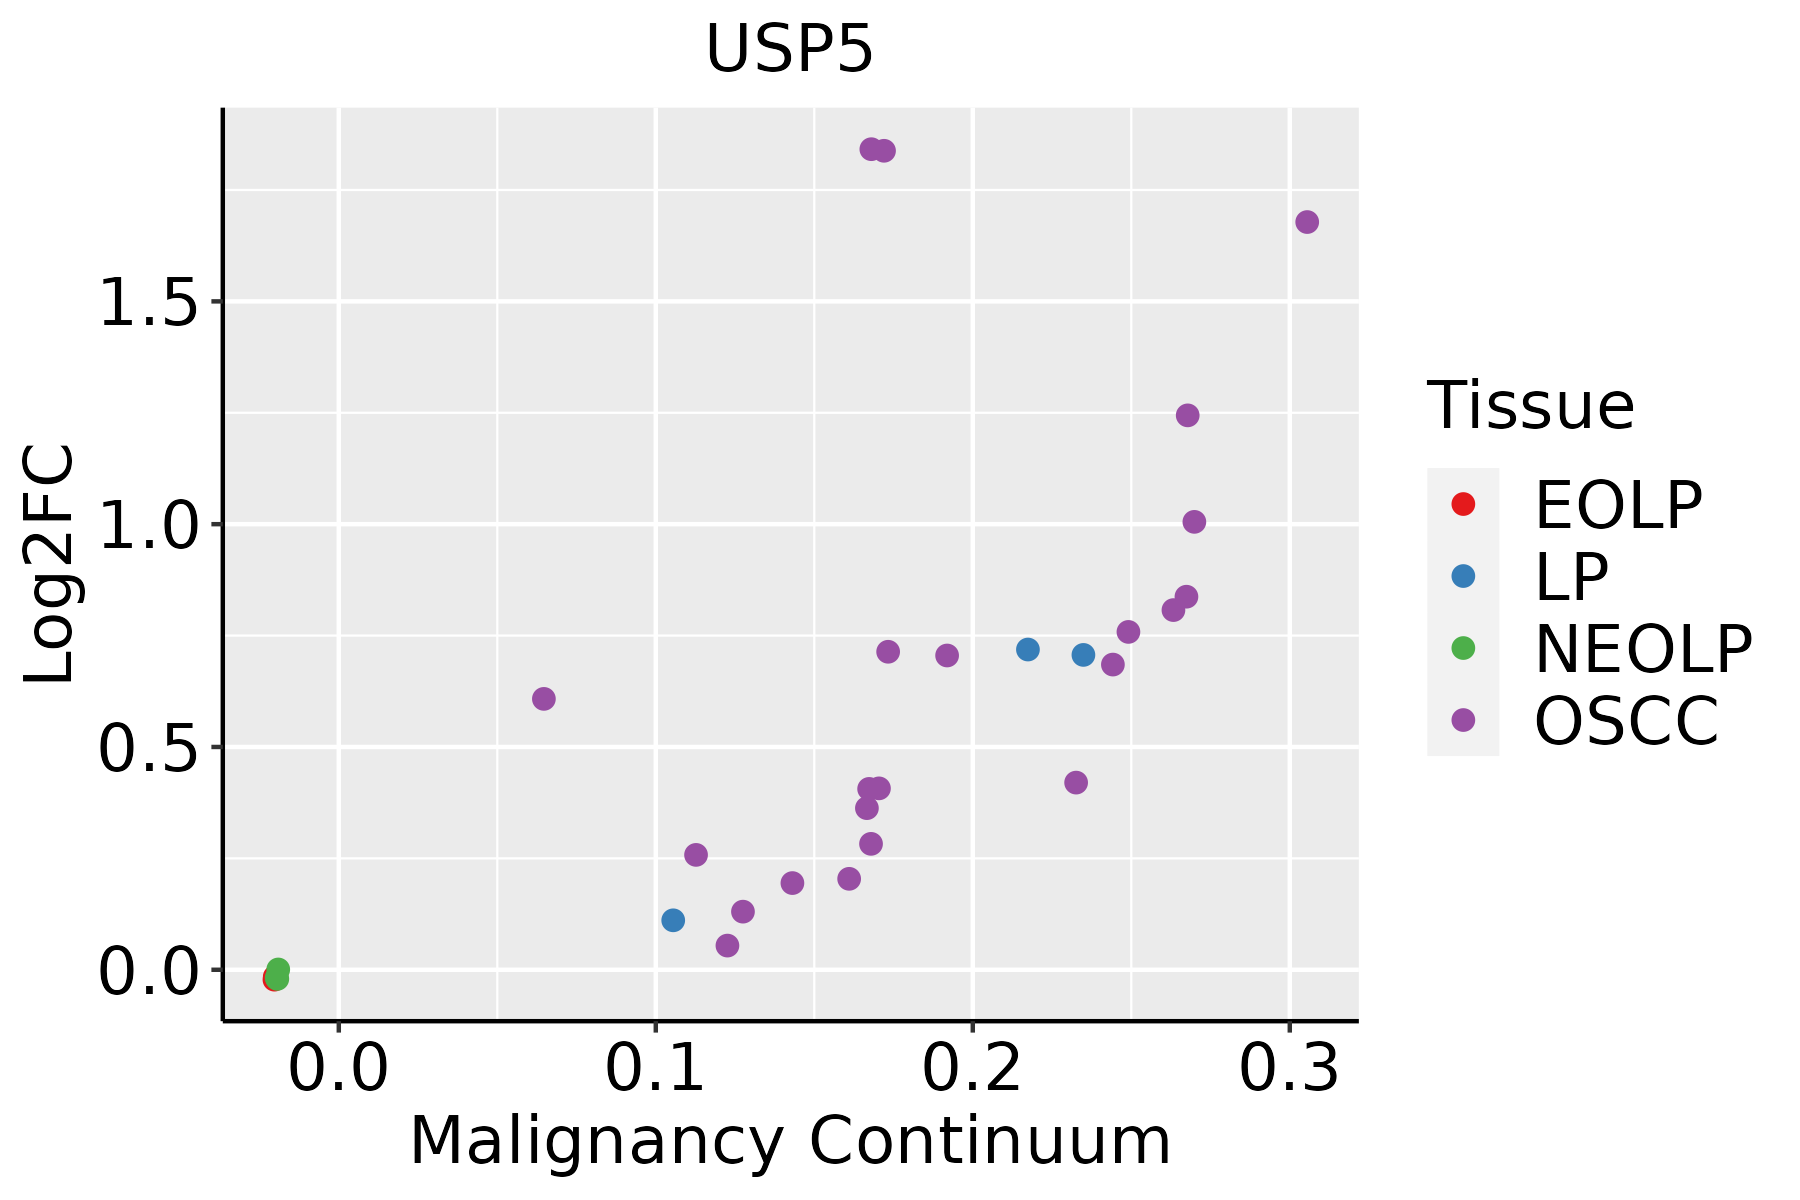 | EOLP: Erosive Oral lichen planus |
| LP: leukoplakia | ||
| NEOLP: Non-erosive oral lichen planus | ||
| OSCC: Oral squamous cell carcinoma | ||
| Skin | 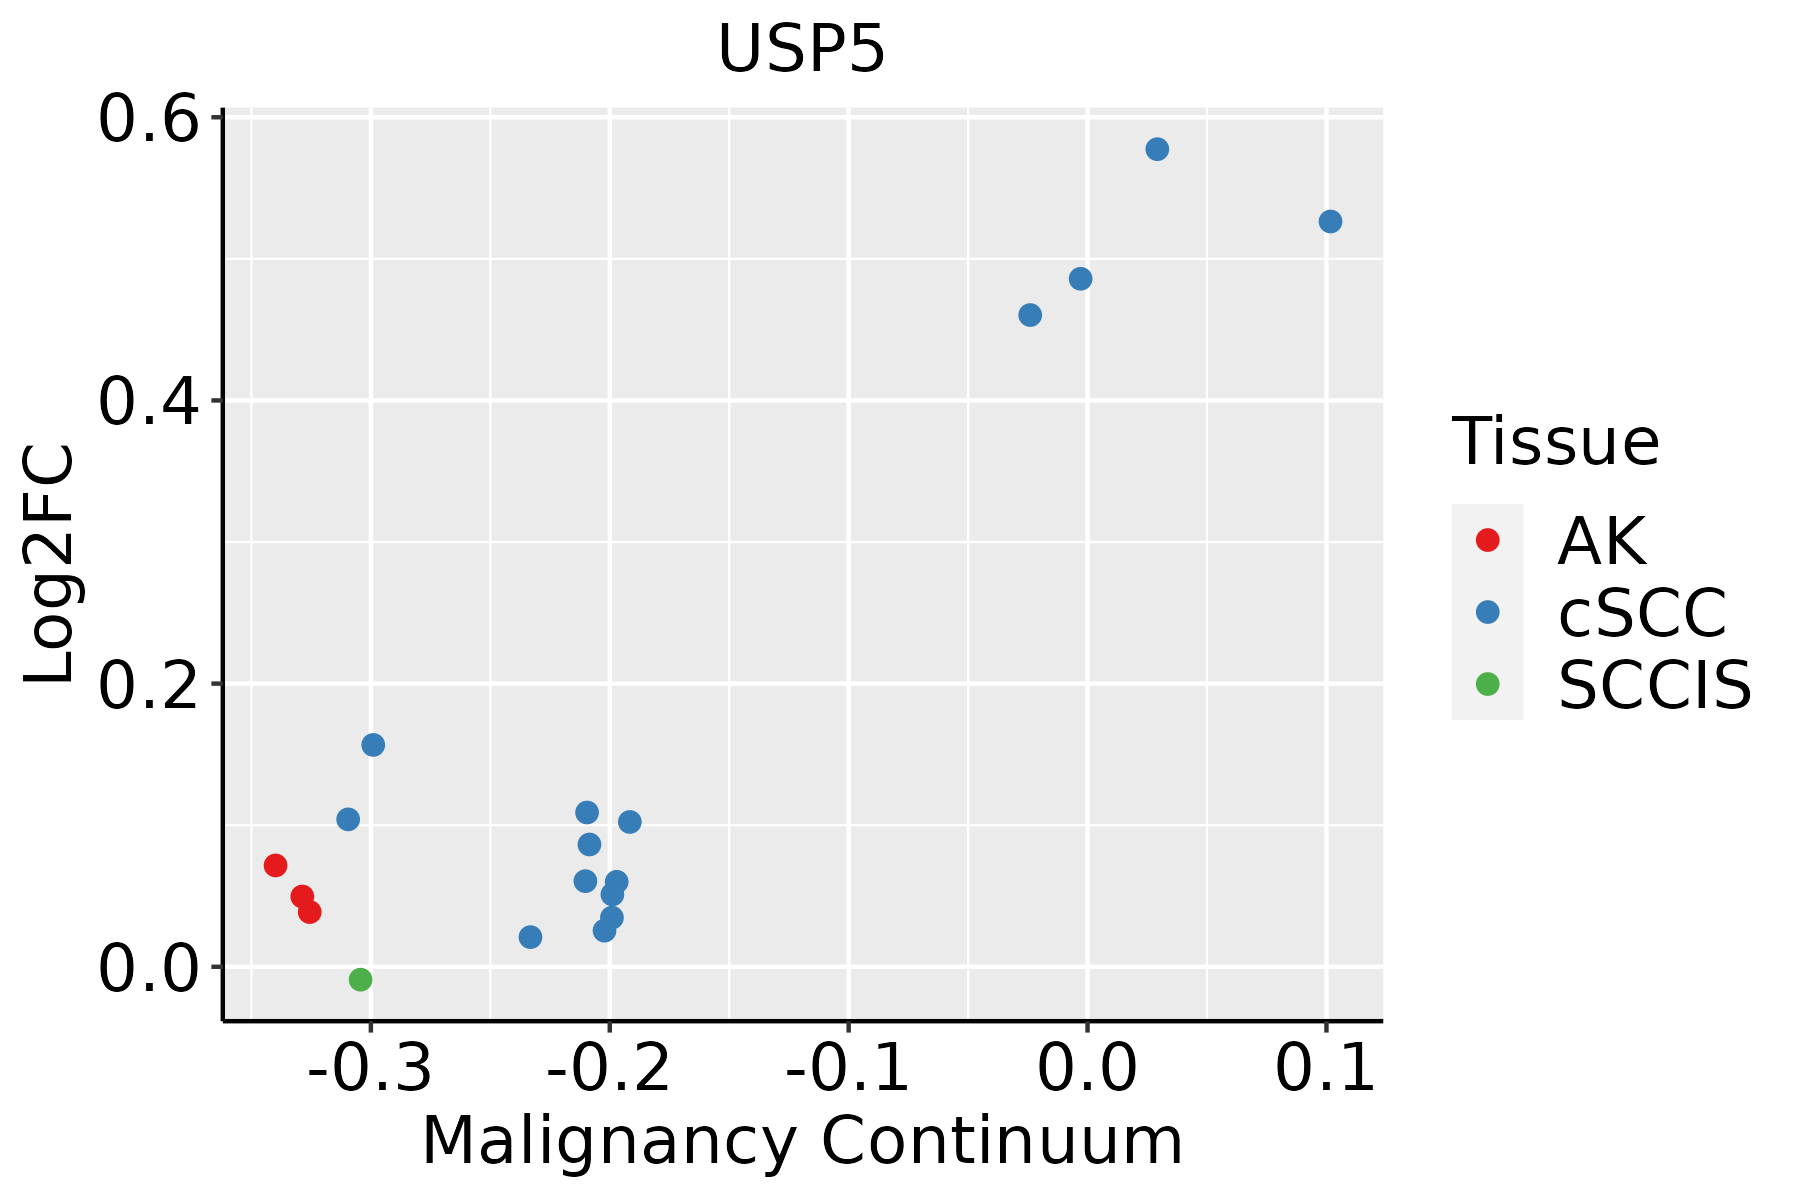 | AK: Actinic keratosis |
| cSCC: Cutaneous squamous cell carcinoma | ||
| SCCIS:squamous cell carcinoma in situ | ||
| Thyroid |  | ATC: Anaplastic thyroid cancer |
| HT: Hashimoto's thyroiditis | ||
| PTC: Papillary thyroid cancer |
| ∗log2FC in expression of this searched gene in stem-like cells from each diseased tissue sample relative to stem-like cells in normal samples in each tissue plotted against the malignancy continuum. Samples are colored based on if they are from different disease stage. |
Top |
Malignant transformation related pathway analysis |
| Find out the enriched GO biological processes and KEGG pathways involved in transition from healthy to precancer to cancer |
| Tissue | Disease Stage | Enriched GO biological Processes |
| Colorectum | AD |  |
| Colorectum | SER |  |
| Colorectum | MSS |  |
| Colorectum | MSI-H |  |
| Colorectum | FAP |  |
| ∗Top 15 enriched GO BP terms are showed in the bar plot of each disease state in each tissue. Each row represents a significant GO biological process which is colored according to the -log10(p.adjust). |
| Page: 1 2 3 4 5 6 7 8 9 |
| GO ID | Tissue | Disease Stage | Description | Gene Ratio | Bg Ratio | pvalue | p.adjust | Count |
| GO:00709979 | Breast | Precancer | neuron death | 50/1080 | 361/18723 | 7.75e-09 | 5.70e-07 | 50 |
| GO:00514029 | Breast | Precancer | neuron apoptotic process | 38/1080 | 246/18723 | 2.68e-08 | 1.75e-06 | 38 |
| GO:00096126 | Breast | Precancer | response to mechanical stimulus | 23/1080 | 216/18723 | 3.41e-03 | 2.85e-02 | 23 |
| GO:007099714 | Breast | IDC | neuron death | 57/1434 | 361/18723 | 1.31e-07 | 7.38e-06 | 57 |
| GO:005140213 | Breast | IDC | neuron apoptotic process | 42/1434 | 246/18723 | 7.21e-07 | 3.35e-05 | 42 |
| GO:000961211 | Breast | IDC | response to mechanical stimulus | 34/1434 | 216/18723 | 4.59e-05 | 1.03e-03 | 34 |
| GO:00423912 | Breast | IDC | regulation of membrane potential | 49/1434 | 434/18723 | 4.04e-03 | 3.25e-02 | 49 |
| GO:00015082 | Breast | IDC | action potential | 19/1434 | 134/18723 | 6.62e-03 | 4.62e-02 | 19 |
| GO:007099724 | Breast | DCIS | neuron death | 57/1390 | 361/18723 | 4.56e-08 | 2.84e-06 | 57 |
| GO:005140222 | Breast | DCIS | neuron apoptotic process | 43/1390 | 246/18723 | 1.16e-07 | 6.13e-06 | 43 |
| GO:000961221 | Breast | DCIS | response to mechanical stimulus | 32/1390 | 216/18723 | 1.36e-04 | 2.33e-03 | 32 |
| GO:00423911 | Breast | DCIS | regulation of membrane potential | 47/1390 | 434/18723 | 5.87e-03 | 4.20e-02 | 47 |
| GO:00064708 | Cervix | CC | protein dephosphorylation | 60/2311 | 281/18723 | 1.33e-05 | 2.68e-04 | 60 |
| GO:00096127 | Cervix | CC | response to mechanical stimulus | 48/2311 | 216/18723 | 3.23e-05 | 5.29e-04 | 48 |
| GO:00073695 | Cervix | CC | gastrulation | 42/2311 | 185/18723 | 5.83e-05 | 8.46e-04 | 42 |
| GO:007099710 | Cervix | CC | neuron death | 70/2311 | 361/18723 | 7.50e-05 | 1.03e-03 | 70 |
| GO:005140210 | Cervix | CC | neuron apoptotic process | 49/2311 | 246/18723 | 4.48e-04 | 4.48e-03 | 49 |
| GO:00074923 | Cervix | CC | endoderm development | 20/2311 | 77/18723 | 8.40e-04 | 7.30e-03 | 20 |
| GO:00434099 | Cervix | CC | negative regulation of MAPK cascade | 37/2311 | 180/18723 | 1.17e-03 | 9.50e-03 | 37 |
| GO:00163117 | Cervix | CC | dephosphorylation | 73/2311 | 417/18723 | 1.23e-03 | 9.87e-03 | 73 |
| Page: 1 2 3 4 5 6 7 8 9 10 11 12 13 14 15 16 17 18 |
| Pathway ID | Tissue | Disease Stage | Description | Gene Ratio | Bg Ratio | pvalue | p.adjust | qvalue | Count |
| Page: 1 |
Top |
Cell-cell communication analysis |
| Identification of potential cell-cell interactions between two cell types and their ligand-receptor pairs for different disease states |
| Ligand | Receptor | LRpair | Pathway | Tissue | Disease Stage |
| Page: 1 |
Top |
Single-cell gene regulatory network inference analysis |
| Find out the significant the regulons (TFs) and the target genes of each regulon across cell types for different disease states |
| TF | Cell Type | Tissue | Disease Stage | Target Gene | RSS | Regulon Activity |
| ∗The dot plots of a searched regulon are shown for all cell subpopulations in each disease state of each tissue based on the regulon specific score inferred using pySCENIC and by calculating the average expression. |
| Page: 1 |
Top |
Somatic mutation of malignant transformation related genes |
| Annotation of somatic variants for genes involved in malignant transformation |
| Hugo Symbol | Variant Class | Variant Classification | dbSNP RS | HGVSc | HGVSp | HGVSp Short | SWISSPROT | BIOTYPE | SIFT | PolyPhen | Tumor Sample Barcode | Tissue | Histology | Sex | Age | Stage | Therapy Types | Drugs | Outcome |
| USP5 | SNV | Missense_Mutation | c.103N>A | p.Asp35Asn | p.D35N | P45974 | protein_coding | deleterious(0.01) | benign(0.124) | TCGA-A8-A094-01 | Breast | breast invasive carcinoma | Female | >=65 | I/II | Unknown | Unknown | SD | |
| USP5 | SNV | Missense_Mutation | c.891N>C | p.Glu297Asp | p.E297D | P45974 | protein_coding | tolerated(0.09) | benign(0.031) | TCGA-A8-A094-01 | Breast | breast invasive carcinoma | Female | >=65 | I/II | Unknown | Unknown | SD | |
| USP5 | SNV | Missense_Mutation | rs782807103 | c.221G>A | p.Arg74Gln | p.R74Q | P45974 | protein_coding | tolerated(0.08) | benign(0.001) | TCGA-AN-A0G0-01 | Breast | breast invasive carcinoma | Female | <65 | I/II | Unknown | Unknown | SD |
| USP5 | SNV | Missense_Mutation | c.1725N>T | p.Lys575Asn | p.K575N | P45974 | protein_coding | deleterious(0) | probably_damaging(0.988) | TCGA-BH-A0B4-01 | Breast | breast invasive carcinoma | Male | >=65 | III/IV | Hormone Therapy | tamoxiphen | SD | |
| USP5 | SNV | Missense_Mutation | novel | c.334N>C | p.Glu112Gln | p.E112Q | P45974 | protein_coding | tolerated(0.37) | possibly_damaging(0.672) | TCGA-BH-A8FZ-01 | Breast | breast invasive carcinoma | Female | <65 | I/II | Unknown | Unknown | SD |
| USP5 | insertion | Frame_Shift_Ins | novel | c.339_340insGAAACCAGCCTGGGCAATATGGCAAGACCTCATC | p.Phe114GlufsTer13 | p.F114Efs*13 | P45974 | protein_coding | TCGA-A8-A06X-01 | Breast | breast invasive carcinoma | Female | >=65 | I/II | Unknown | Unknown | SD | ||
| USP5 | insertion | Nonsense_Mutation | novel | c.480_481insCCATTCTGACCTCCTATTGGACTCAGTTTCTTTTTTTCACCTACT | p.Ala160_Ser161insProPheTerProProIleGlyLeuSerPhePhePheSerProThr | p.A160_S161insPF*PPIGLSFFFSPT | P45974 | protein_coding | TCGA-A8-A08Z-01 | Breast | breast invasive carcinoma | Female | >=65 | III/IV | Unknown | Unknown | SD | ||
| USP5 | deletion | Frame_Shift_Del | novel | c.851_852delNN | p.Leu284GlnfsTer11 | p.L284Qfs*11 | P45974 | protein_coding | TCGA-E9-A1RH-01 | Breast | breast invasive carcinoma | Female | <65 | I/II | Chemotherapy | 5-fluorouracil | SD | ||
| USP5 | deletion | Frame_Shift_Del | c.1931delN | p.Pro645LeufsTer45 | p.P645Lfs*45 | P45974 | protein_coding | TCGA-E9-A226-01 | Breast | breast invasive carcinoma | Female | <65 | III/IV | Hormone Therapy | tamoxiphen | PD | |||
| USP5 | SNV | Missense_Mutation | novel | c.907N>T | p.Arg303Trp | p.R303W | P45974 | protein_coding | deleterious(0) | probably_damaging(0.999) | TCGA-2W-A8YY-01 | Cervix | cervical & endocervical cancer | Female | <65 | I/II | Chemotherapy | cisplatin | CR |
| Page: 1 2 3 4 5 6 7 8 9 10 11 |
Top |
Related drugs of malignant transformation related genes |
| Identification of chemicals and drugs interact with genes involved in malignant transfromation |
| (DGIdb 4.0) |
| Entrez ID | Symbol | Category | Interaction Types | Drug Claim Name | Drug Name | PMIDs |
| 8078 | USP5 | ENZYME, PROTEASE | VIALININ A | VIALININ A | 23791076 | |
| 8078 | USP5 | ENZYME, PROTEASE | inhibitor | 252166869 |
| Page: 1 |

Copyright 2023-Present -The University of Texas Health Science Center at Houston |