
|
|||||
|
 | |
| |
| |
| |
| |
| |
|
Gene: USP48 |
Gene summary for USP48 |
| Gene information | Species | Human | Gene symbol | USP48 | Gene ID | 84196 |
| Gene name | ubiquitin specific peptidase 48 | |
| Gene Alias | RAP1GA1 | |
| Cytomap | 1p36.12 | |
| Gene Type | protein-coding | GO ID | GO:0006464 | UniProtAcc | Q86UV5 |
Top |
Malignant transformation analysis |
| Identification of the aberrant gene expression in precancerous and cancerous lesions by comparing the gene expression of stem-like cells in diseased tissues with normal stem cells |
| Entrez ID | Symbol | Replicates | Species | Organ | Tissue | Adj P-value | Log2FC | Malignancy |
| 84196 | USP48 | EEC-subject3 | Human | Endometrium | EEC | 2.23e-02 | -5.49e-02 | -0.2525 |
| 84196 | USP48 | GSM5276934 | Human | Endometrium | EEC | 1.92e-03 | -2.09e-01 | -0.0913 |
| 84196 | USP48 | GSM5276937 | Human | Endometrium | EEC | 4.22e-02 | -1.65e-01 | -0.0897 |
| 84196 | USP48 | GSM6177620_NYU_UCEC1_lib1_lib1 | Human | Endometrium | EEC | 9.17e-14 | 5.98e-02 | -0.1869 |
| 84196 | USP48 | GSM6177620_NYU_UCEC1_lib2_lib2 | Human | Endometrium | EEC | 2.23e-12 | -3.79e-02 | -0.1875 |
| 84196 | USP48 | GSM6177620_NYU_UCEC1_lib3_lib3 | Human | Endometrium | EEC | 5.44e-15 | -9.17e-02 | -0.1883 |
| 84196 | USP48 | GSM6177621_NYU_UCEC2_lib1_lib1 | Human | Endometrium | EEC | 9.31e-09 | -1.56e-02 | -0.1934 |
| 84196 | USP48 | GSM6177622_NYU_UCEC3_lib1_lib1 | Human | Endometrium | EEC | 2.62e-13 | -1.38e-01 | -0.1917 |
| 84196 | USP48 | GSM6177622_NYU_UCEC3_lib2_lib2 | Human | Endometrium | EEC | 9.65e-18 | -9.28e-02 | -0.1916 |
| 84196 | USP48 | LZE4T | Human | Esophagus | ESCC | 2.49e-11 | 4.31e-01 | 0.0811 |
| 84196 | USP48 | LZE7T | Human | Esophagus | ESCC | 5.93e-07 | 3.59e-01 | 0.0667 |
| 84196 | USP48 | LZE22T | Human | Esophagus | ESCC | 1.16e-04 | 2.42e-01 | 0.068 |
| 84196 | USP48 | LZE24T | Human | Esophagus | ESCC | 1.02e-12 | 4.72e-01 | 0.0596 |
| 84196 | USP48 | P1T-E | Human | Esophagus | ESCC | 3.86e-06 | 3.01e-01 | 0.0875 |
| 84196 | USP48 | P2T-E | Human | Esophagus | ESCC | 1.72e-32 | 6.67e-01 | 0.1177 |
| 84196 | USP48 | P4T-E | Human | Esophagus | ESCC | 3.25e-17 | 5.30e-01 | 0.1323 |
| 84196 | USP48 | P5T-E | Human | Esophagus | ESCC | 1.56e-12 | 1.53e-01 | 0.1327 |
| 84196 | USP48 | P8T-E | Human | Esophagus | ESCC | 3.59e-29 | 4.61e-01 | 0.0889 |
| 84196 | USP48 | P9T-E | Human | Esophagus | ESCC | 1.22e-08 | 2.83e-01 | 0.1131 |
| 84196 | USP48 | P10T-E | Human | Esophagus | ESCC | 1.39e-43 | 9.97e-01 | 0.116 |
| Page: 1 2 3 4 5 6 7 |
| Tissue | Expression Dynamics | Abbreviation |
| Endometrium |  | AEH: Atypical endometrial hyperplasia |
| EEC: Endometrioid Cancer | ||
| Esophagus | 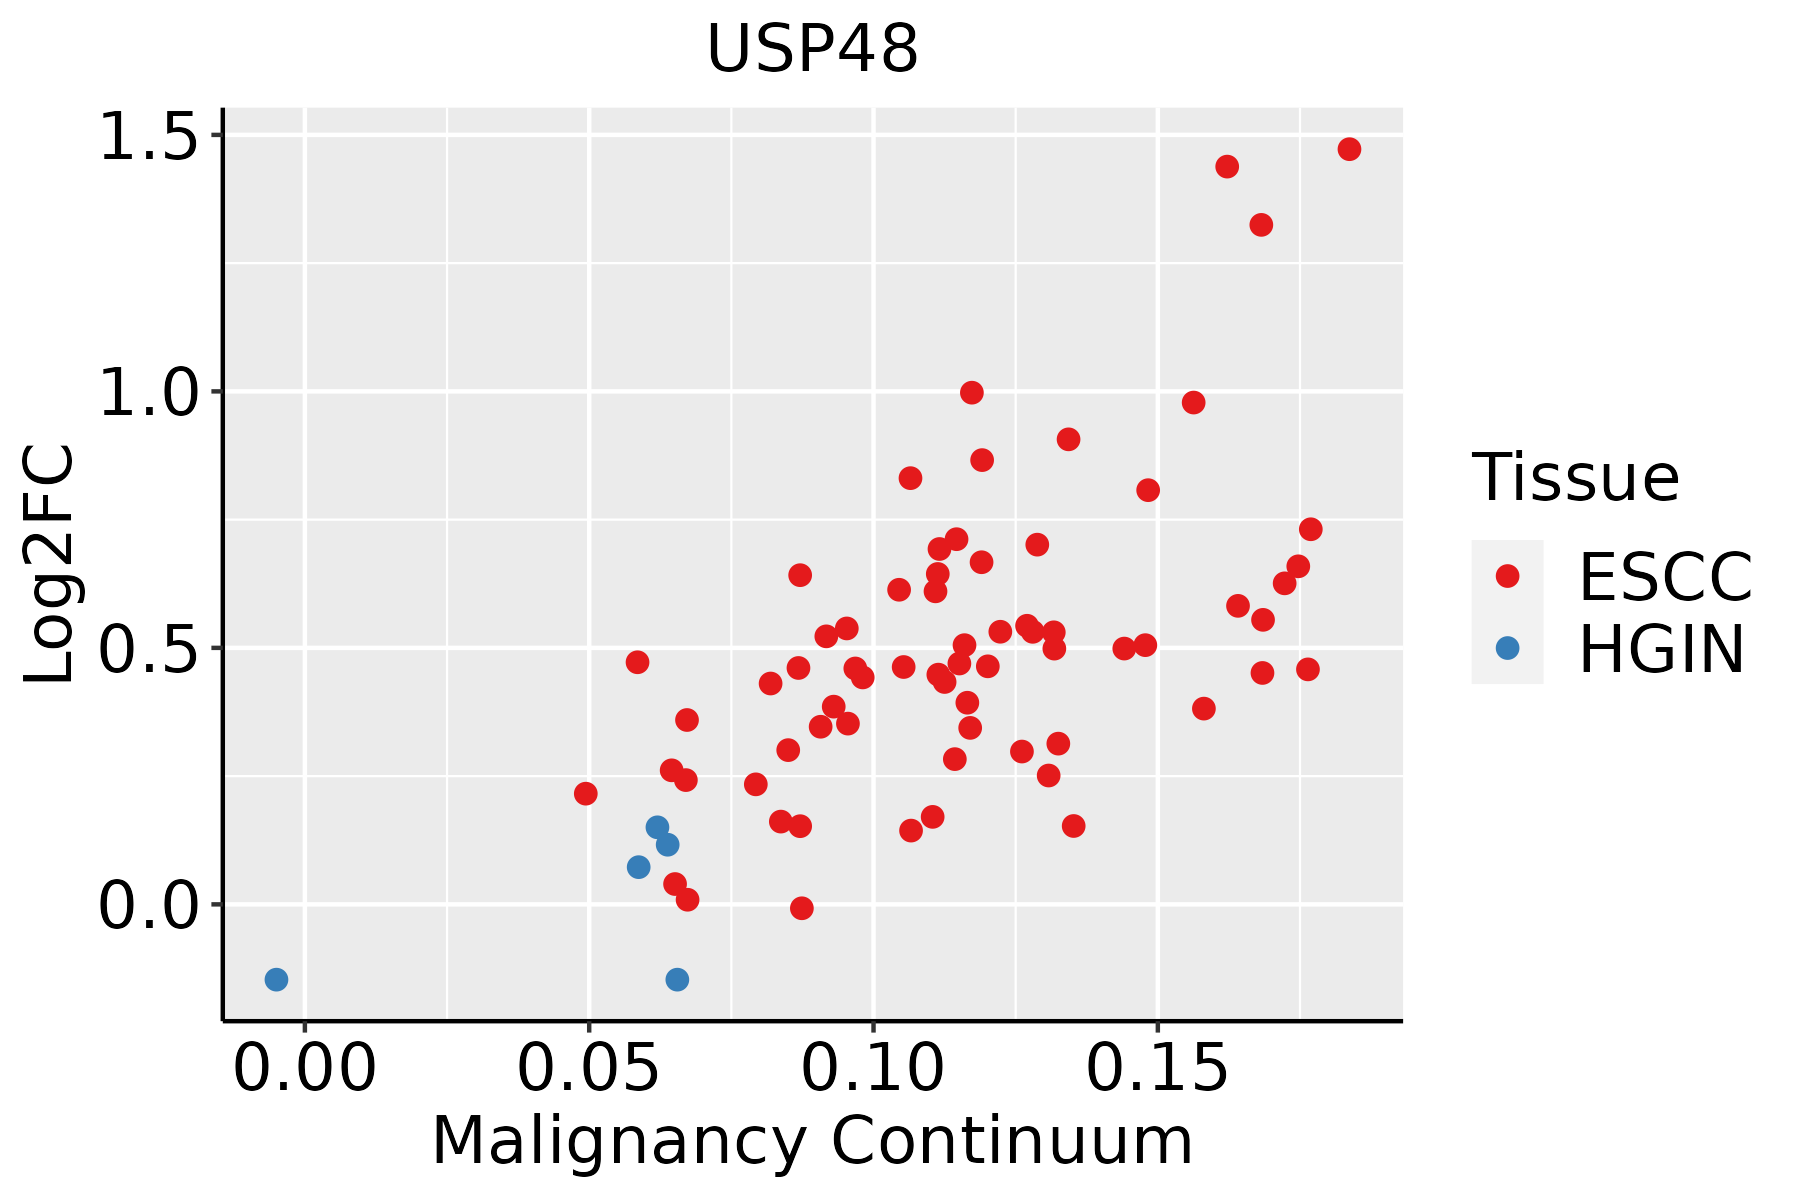 | ESCC: Esophageal squamous cell carcinoma |
| HGIN: High-grade intraepithelial neoplasias | ||
| LGIN: Low-grade intraepithelial neoplasias | ||
| Liver | 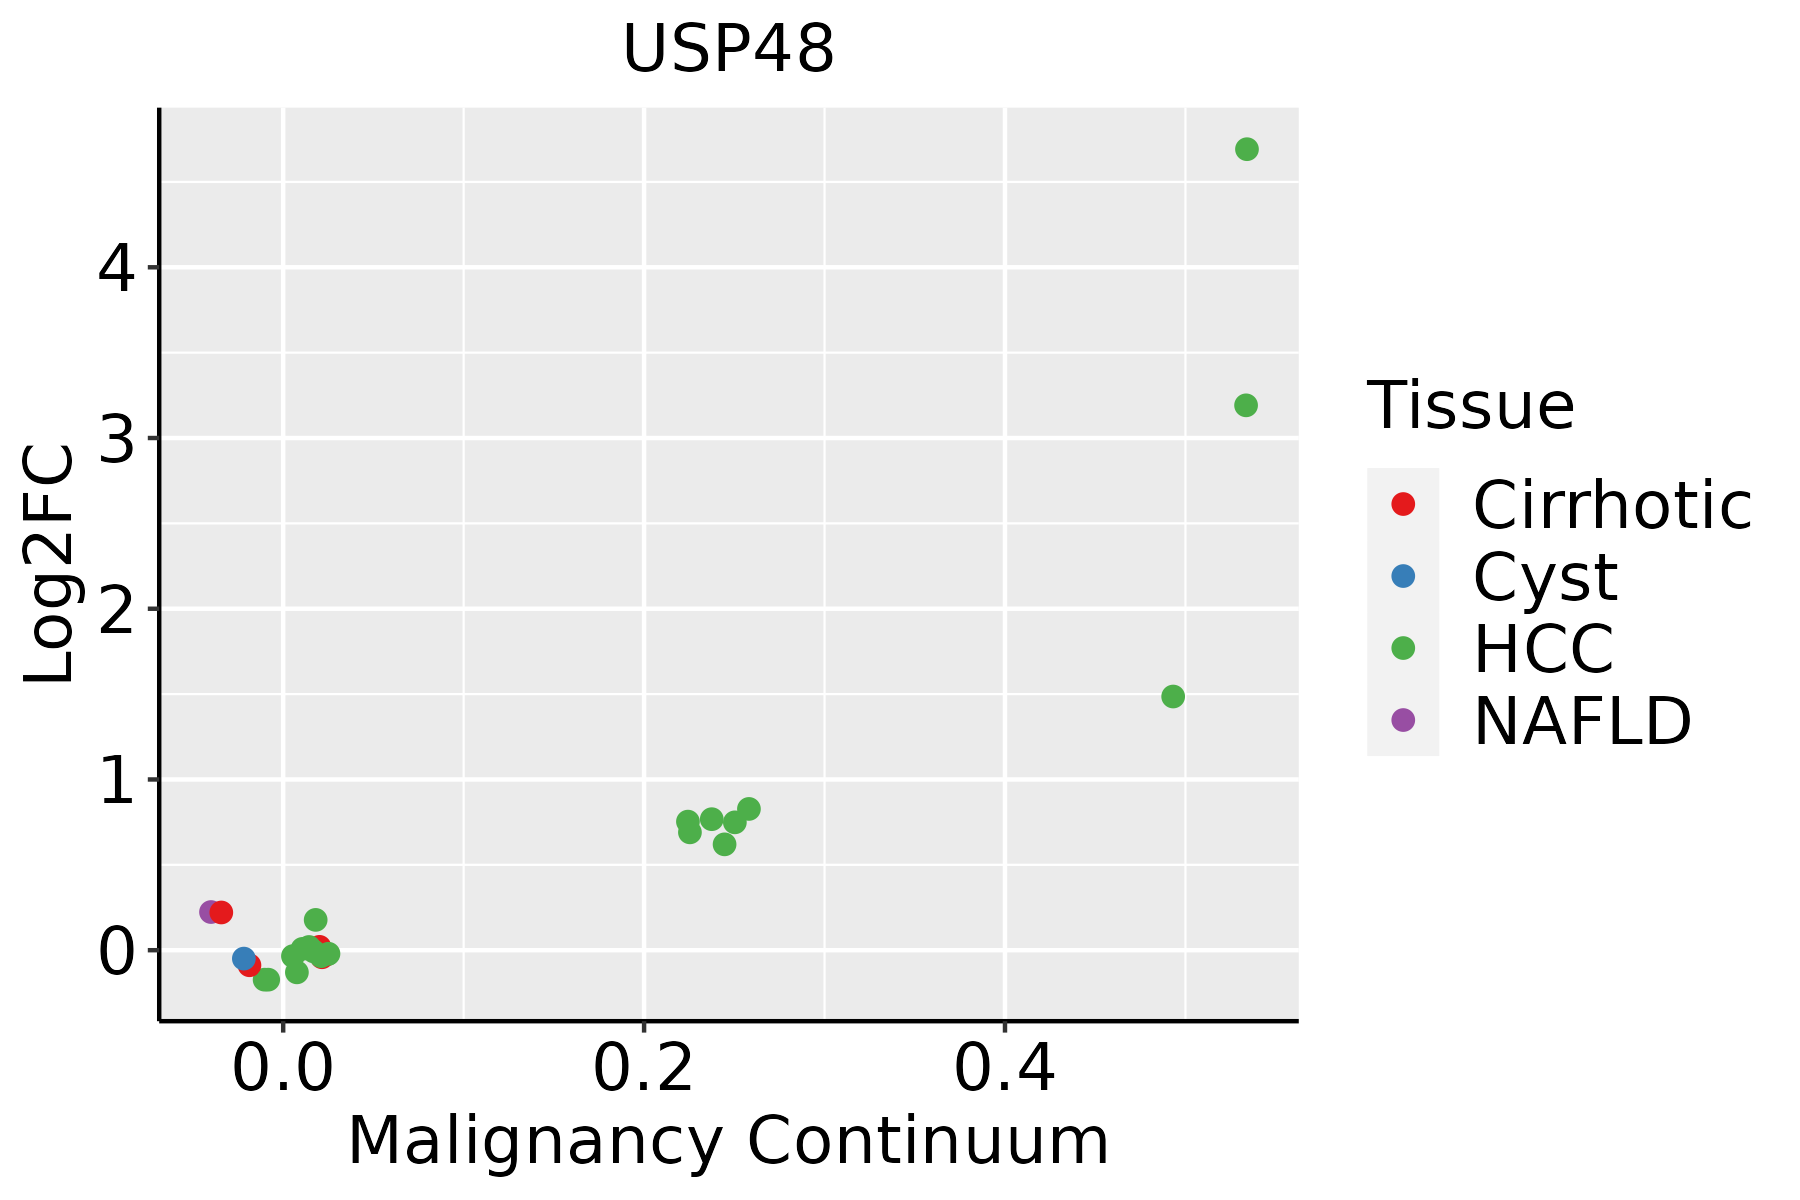 | HCC: Hepatocellular carcinoma |
| NAFLD: Non-alcoholic fatty liver disease | ||
| Oral Cavity | 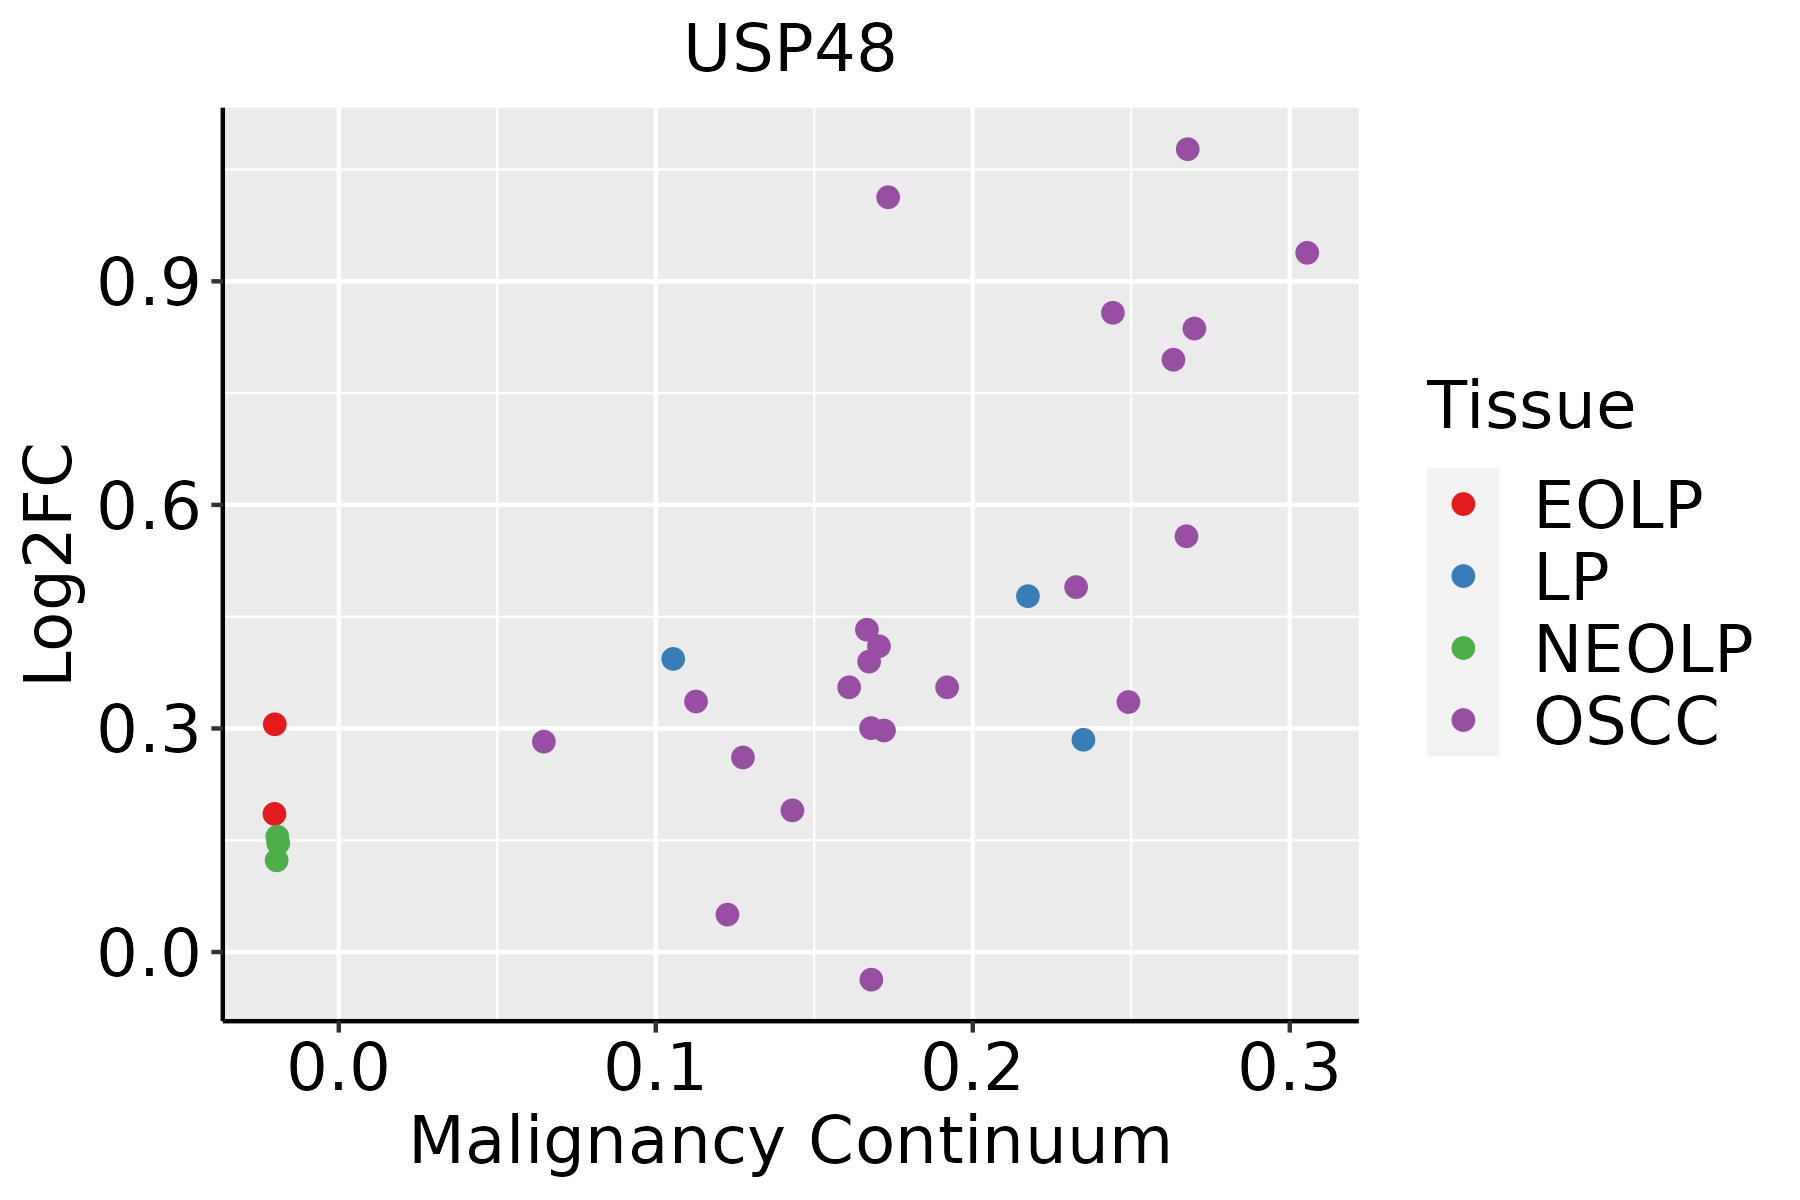 | EOLP: Erosive Oral lichen planus |
| LP: leukoplakia | ||
| NEOLP: Non-erosive oral lichen planus | ||
| OSCC: Oral squamous cell carcinoma | ||
| Prostate |  | BPH: Benign Prostatic Hyperplasia |
| Skin | 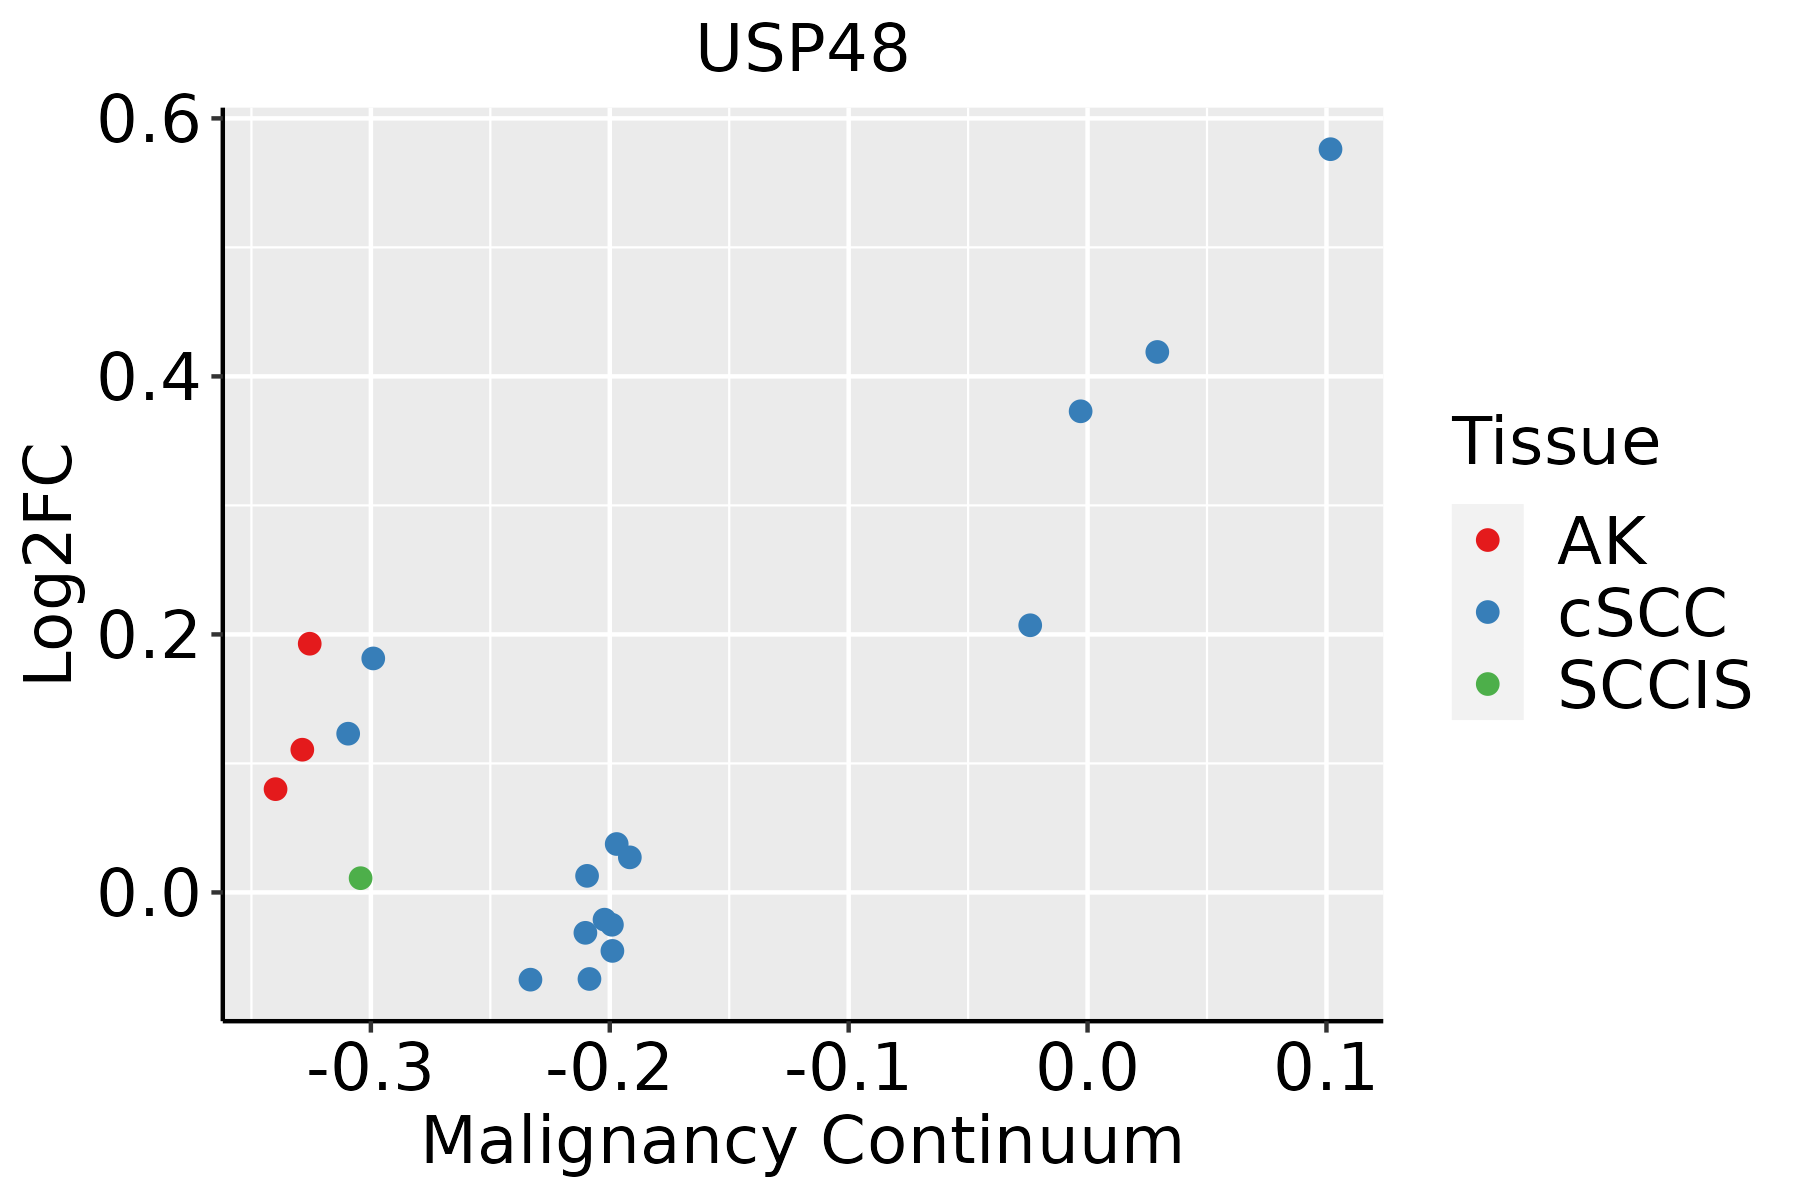 | AK: Actinic keratosis |
| cSCC: Cutaneous squamous cell carcinoma | ||
| SCCIS:squamous cell carcinoma in situ | ||
| Thyroid |  | ATC: Anaplastic thyroid cancer |
| HT: Hashimoto's thyroiditis | ||
| PTC: Papillary thyroid cancer |
| ∗log2FC in expression of this searched gene in stem-like cells from each diseased tissue sample relative to stem-like cells in normal samples in each tissue plotted against the malignancy continuum. Samples are colored based on if they are from different disease stage. |
Top |
Malignant transformation related pathway analysis |
| Find out the enriched GO biological processes and KEGG pathways involved in transition from healthy to precancer to cancer |
| Tissue | Disease Stage | Enriched GO biological Processes |
| Colorectum | AD |  |
| Colorectum | SER |  |
| Colorectum | MSS |  |
| Colorectum | MSI-H |  |
| Colorectum | FAP |  |
| ∗Top 15 enriched GO BP terms are showed in the bar plot of each disease state in each tissue. Each row represents a significant GO biological process which is colored according to the -log10(p.adjust). |
| Page: 1 2 3 4 5 6 7 8 9 |
| GO ID | Tissue | Disease Stage | Description | Gene Ratio | Bg Ratio | pvalue | p.adjust | Count |
| GO:007064612 | Esophagus | ESCC | protein modification by small protein removal | 95/8552 | 157/18723 | 1.25e-04 | 8.56e-04 | 95 |
| GO:00165793 | Esophagus | ESCC | protein deubiquitination | 79/8552 | 139/18723 | 5.23e-03 | 1.97e-02 | 79 |
| GO:00706461 | Liver | HCC | protein modification by small protein removal | 91/7958 | 157/18723 | 6.50e-05 | 5.92e-04 | 91 |
| GO:00165791 | Liver | HCC | protein deubiquitination | 78/7958 | 139/18723 | 8.13e-04 | 4.87e-03 | 78 |
| GO:00706462 | Oral cavity | OSCC | protein modification by small protein removal | 77/7305 | 157/18723 | 6.55e-03 | 2.43e-02 | 77 |
| GO:007064611 | Oral cavity | EOLP | protein modification by small protein removal | 33/2218 | 157/18723 | 7.04e-04 | 5.78e-03 | 33 |
| GO:00165792 | Oral cavity | EOLP | protein deubiquitination | 28/2218 | 139/18723 | 3.29e-03 | 1.90e-02 | 28 |
| GO:00706464 | Skin | cSCC | protein modification by small protein removal | 55/4864 | 157/18723 | 7.29e-03 | 3.46e-02 | 55 |
| GO:00706465 | Thyroid | PTC | protein modification by small protein removal | 71/5968 | 157/18723 | 3.03e-04 | 2.12e-03 | 71 |
| GO:00165794 | Thyroid | PTC | protein deubiquitination | 59/5968 | 139/18723 | 5.50e-03 | 2.50e-02 | 59 |
| GO:007064613 | Thyroid | ATC | protein modification by small protein removal | 71/6293 | 157/18723 | 1.59e-03 | 7.99e-03 | 71 |
| Page: 1 |
| Pathway ID | Tissue | Disease Stage | Description | Gene Ratio | Bg Ratio | pvalue | p.adjust | qvalue | Count |
| Page: 1 |
Top |
Cell-cell communication analysis |
| Identification of potential cell-cell interactions between two cell types and their ligand-receptor pairs for different disease states |
| Ligand | Receptor | LRpair | Pathway | Tissue | Disease Stage |
| Page: 1 |
Top |
Single-cell gene regulatory network inference analysis |
| Find out the significant the regulons (TFs) and the target genes of each regulon across cell types for different disease states |
| TF | Cell Type | Tissue | Disease Stage | Target Gene | RSS | Regulon Activity |
| ∗The dot plots of a searched regulon are shown for all cell subpopulations in each disease state of each tissue based on the regulon specific score inferred using pySCENIC and by calculating the average expression. |
| Page: 1 |
Top |
Somatic mutation of malignant transformation related genes |
| Annotation of somatic variants for genes involved in malignant transformation |
| Hugo Symbol | Variant Class | Variant Classification | dbSNP RS | HGVSc | HGVSp | HGVSp Short | SWISSPROT | BIOTYPE | SIFT | PolyPhen | Tumor Sample Barcode | Tissue | Histology | Sex | Age | Stage | Therapy Types | Drugs | Outcome |
| USP48 | SNV | Missense_Mutation | novel | c.2039C>G | p.Pro680Arg | p.P680R | Q86UV5 | protein_coding | deleterious(0.02) | probably_damaging(0.996) | TCGA-A8-A09M-01 | Breast | breast invasive carcinoma | Female | >=65 | III/IV | Chemotherapy | paclitaxel | CR |
| USP48 | SNV | Missense_Mutation | novel | c.2755A>G | p.Ile919Val | p.I919V | Q86UV5 | protein_coding | tolerated(0.39) | benign(0) | TCGA-AN-A046-01 | Breast | breast invasive carcinoma | Female | >=65 | I/II | Unknown | Unknown | SD |
| USP48 | SNV | Missense_Mutation | rs778692028 | c.2732N>G | p.Asn911Ser | p.N911S | Q86UV5 | protein_coding | tolerated(0.18) | benign(0.024) | TCGA-AR-A2LM-01 | Breast | breast invasive carcinoma | Female | <65 | I/II | Chemotherapy | docetaxel | SD |
| USP48 | SNV | Missense_Mutation | c.248G>C | p.Arg83Thr | p.R83T | Q86UV5 | protein_coding | deleterious(0) | probably_damaging(0.972) | TCGA-GI-A2C8-01 | Breast | breast invasive carcinoma | Female | <65 | III/IV | Unspecific | Adriamycin | SD | |
| USP48 | deletion | Frame_Shift_Del | novel | c.2738delG | p.Gly913GlufsTer13 | p.G913Efs*13 | Q86UV5 | protein_coding | TCGA-D8-A27V-01 | Breast | breast invasive carcinoma | Female | <65 | I/II | Hormone Therapy | tamoxiphen | SD | ||
| USP48 | deletion | Frame_Shift_Del | novel | c.411delA | p.Asp138IlefsTer83 | p.D138Ifs*83 | Q86UV5 | protein_coding | TCGA-D8-A27V-01 | Breast | breast invasive carcinoma | Female | <65 | I/II | Hormone Therapy | tamoxiphen | SD | ||
| USP48 | SNV | Missense_Mutation | rs748095023 | c.2260N>T | p.Arg754Trp | p.R754W | Q86UV5 | protein_coding | deleterious(0) | possibly_damaging(0.857) | TCGA-C5-A1BL-01 | Cervix | cervical & endocervical cancer | Female | <65 | I/II | Unknown | Unknown | SD |
| USP48 | SNV | Missense_Mutation | novel | c.1153N>T | p.Gly385Trp | p.G385W | Q86UV5 | protein_coding | deleterious(0) | probably_damaging(0.985) | TCGA-C5-A7CL-01 | Cervix | cervical & endocervical cancer | Female | <65 | III/IV | Chemotherapy | cisplatin | PD |
| USP48 | SNV | Missense_Mutation | rs765982927 | c.1408N>A | p.Glu470Lys | p.E470K | Q86UV5 | protein_coding | tolerated(0.2) | benign(0.009) | TCGA-EA-A5FO-01 | Cervix | cervical & endocervical cancer | Female | <65 | I/II | Unknown | Unknown | SD |
| USP48 | SNV | Missense_Mutation | c.2747N>A | p.Arg916Gln | p.R916Q | Q86UV5 | protein_coding | deleterious(0.02) | possibly_damaging(0.637) | TCGA-FU-A3HY-01 | Cervix | cervical & endocervical cancer | Female | <65 | I/II | Chemotherapy | cisplatin | CR |
| Page: 1 2 3 4 5 6 7 8 9 10 11 |
Top |
Related drugs of malignant transformation related genes |
| Identification of chemicals and drugs interact with genes involved in malignant transfromation |
| (DGIdb 4.0) |
| Entrez ID | Symbol | Category | Interaction Types | Drug Claim Name | Drug Name | PMIDs |
| Page: 1 |

Copyright 2023-Present -The University of Texas Health Science Center at Houston |