
|
|||||
|
 | |
| |
| |
| |
| |
| |
|
Gene: USP46 |
Gene summary for USP46 |
| Gene information | Species | Human | Gene symbol | USP46 | Gene ID | 64854 |
| Gene name | ubiquitin specific peptidase 46 | |
| Gene Alias | USP46 | |
| Cytomap | 4q12 | |
| Gene Type | protein-coding | GO ID | GO:0001662 | UniProtAcc | P62068 |
Top |
Malignant transformation analysis |
| Identification of the aberrant gene expression in precancerous and cancerous lesions by comparing the gene expression of stem-like cells in diseased tissues with normal stem cells |
| Entrez ID | Symbol | Replicates | Species | Organ | Tissue | Adj P-value | Log2FC | Malignancy |
| 64854 | USP46 | LZE4T | Human | Esophagus | ESCC | 1.36e-08 | 3.27e-01 | 0.0811 |
| 64854 | USP46 | LZE7T | Human | Esophagus | ESCC | 1.00e-04 | 3.62e-01 | 0.0667 |
| 64854 | USP46 | LZE8T | Human | Esophagus | ESCC | 1.40e-06 | 1.91e-01 | 0.067 |
| 64854 | USP46 | LZE24T | Human | Esophagus | ESCC | 1.12e-07 | 1.93e-01 | 0.0596 |
| 64854 | USP46 | P2T-E | Human | Esophagus | ESCC | 5.36e-32 | 5.21e-01 | 0.1177 |
| 64854 | USP46 | P4T-E | Human | Esophagus | ESCC | 1.86e-11 | 2.26e-01 | 0.1323 |
| 64854 | USP46 | P5T-E | Human | Esophagus | ESCC | 2.81e-05 | 1.59e-01 | 0.1327 |
| 64854 | USP46 | P8T-E | Human | Esophagus | ESCC | 2.02e-16 | 3.01e-01 | 0.0889 |
| 64854 | USP46 | P9T-E | Human | Esophagus | ESCC | 2.50e-10 | 1.74e-01 | 0.1131 |
| 64854 | USP46 | P10T-E | Human | Esophagus | ESCC | 8.62e-22 | 3.34e-01 | 0.116 |
| 64854 | USP46 | P11T-E | Human | Esophagus | ESCC | 1.10e-10 | 3.23e-01 | 0.1426 |
| 64854 | USP46 | P12T-E | Human | Esophagus | ESCC | 9.45e-16 | 3.54e-01 | 0.1122 |
| 64854 | USP46 | P15T-E | Human | Esophagus | ESCC | 1.53e-19 | 2.88e-01 | 0.1149 |
| 64854 | USP46 | P16T-E | Human | Esophagus | ESCC | 3.83e-17 | 3.51e-01 | 0.1153 |
| 64854 | USP46 | P17T-E | Human | Esophagus | ESCC | 1.67e-06 | 2.00e-01 | 0.1278 |
| 64854 | USP46 | P20T-E | Human | Esophagus | ESCC | 4.51e-09 | 1.79e-01 | 0.1124 |
| 64854 | USP46 | P21T-E | Human | Esophagus | ESCC | 3.62e-09 | 1.42e-01 | 0.1617 |
| 64854 | USP46 | P22T-E | Human | Esophagus | ESCC | 2.40e-21 | 3.57e-01 | 0.1236 |
| 64854 | USP46 | P23T-E | Human | Esophagus | ESCC | 1.36e-15 | 2.57e-01 | 0.108 |
| 64854 | USP46 | P24T-E | Human | Esophagus | ESCC | 9.17e-07 | 1.22e-01 | 0.1287 |
| Page: 1 2 3 4 |
| Tissue | Expression Dynamics | Abbreviation |
| Esophagus | 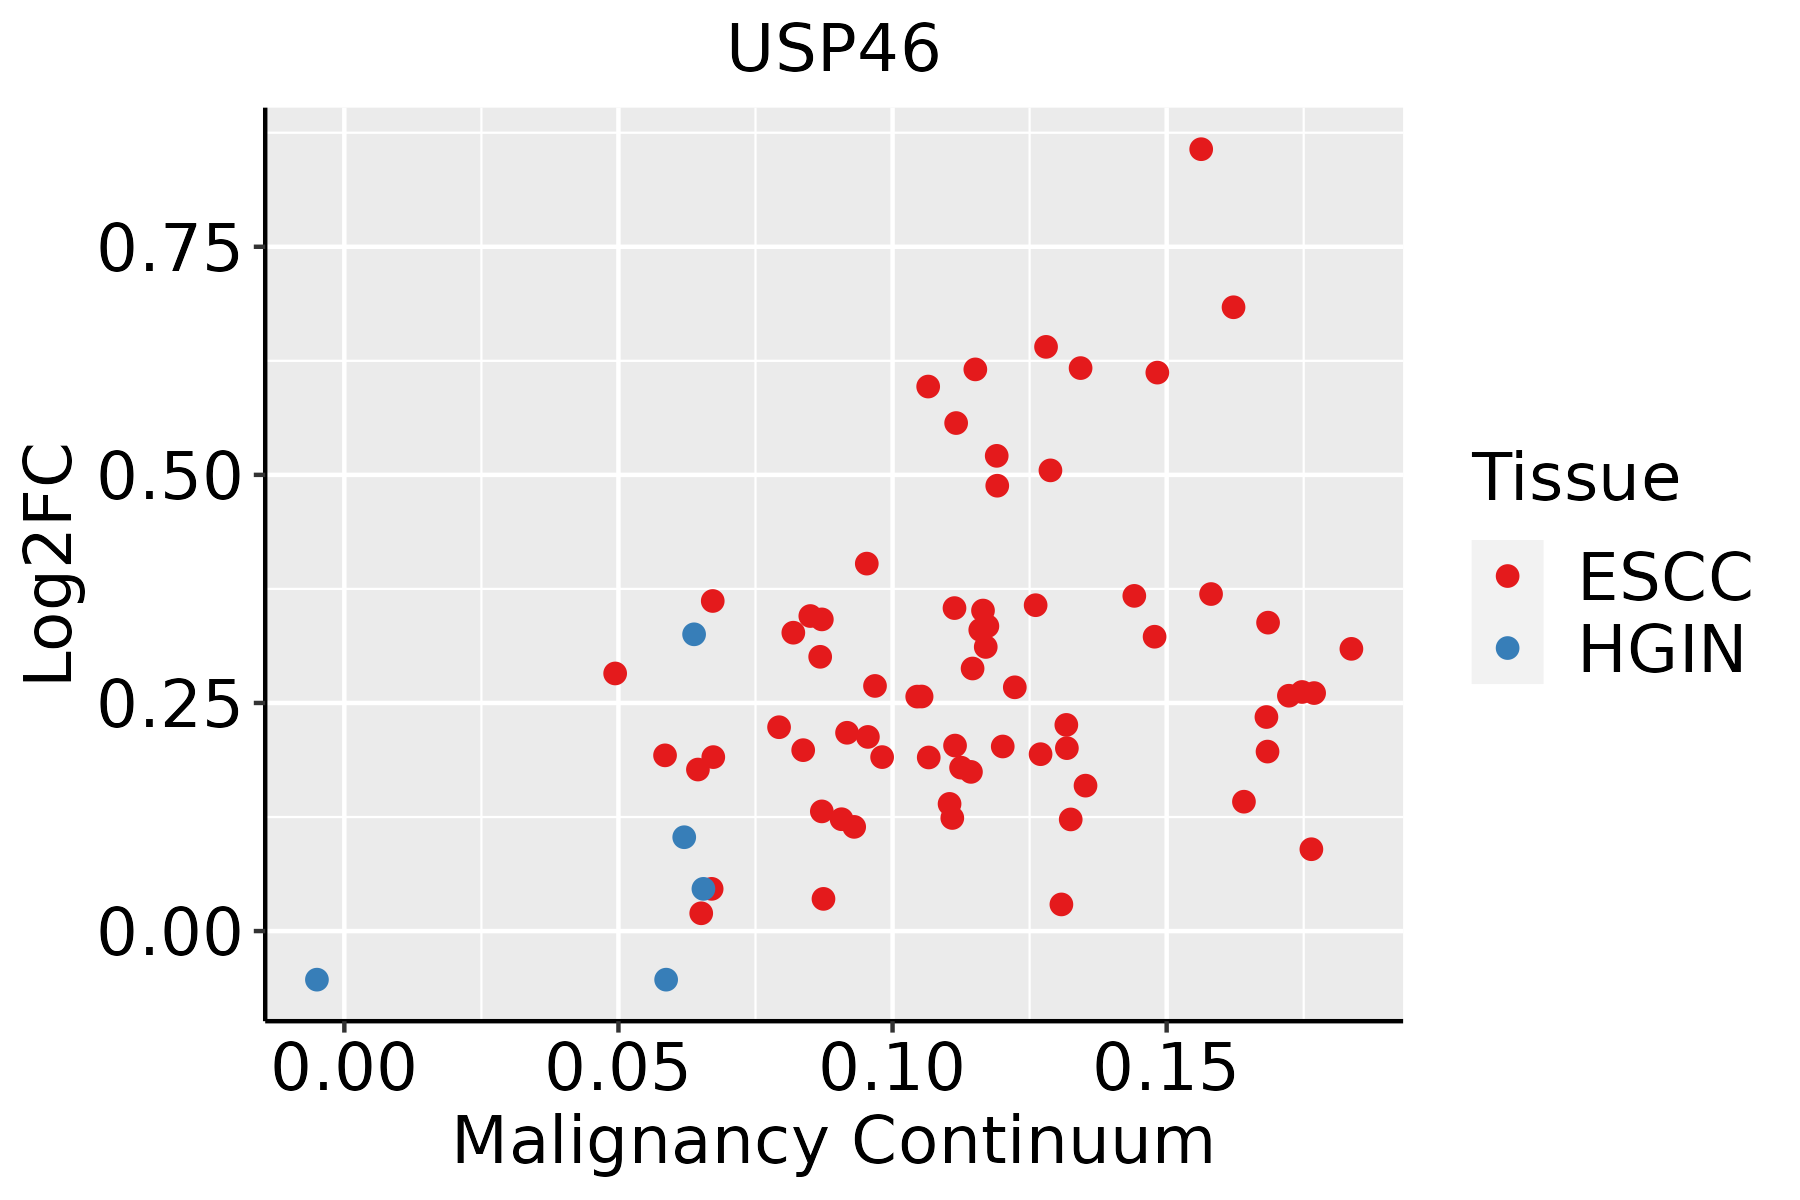 | ESCC: Esophageal squamous cell carcinoma |
| HGIN: High-grade intraepithelial neoplasias | ||
| LGIN: Low-grade intraepithelial neoplasias | ||
| Thyroid |  | ATC: Anaplastic thyroid cancer |
| HT: Hashimoto's thyroiditis | ||
| PTC: Papillary thyroid cancer |
| ∗log2FC in expression of this searched gene in stem-like cells from each diseased tissue sample relative to stem-like cells in normal samples in each tissue plotted against the malignancy continuum. Samples are colored based on if they are from different disease stage. |
Top |
Malignant transformation related pathway analysis |
| Find out the enriched GO biological processes and KEGG pathways involved in transition from healthy to precancer to cancer |
| Tissue | Disease Stage | Enriched GO biological Processes |
| Colorectum | AD |  |
| Colorectum | SER |  |
| Colorectum | MSS |  |
| Colorectum | MSI-H |  |
| Colorectum | FAP |  |
| ∗Top 15 enriched GO BP terms are showed in the bar plot of each disease state in each tissue. Each row represents a significant GO biological process which is colored according to the -log10(p.adjust). |
| Page: 1 2 3 4 5 6 7 8 9 |
| GO ID | Tissue | Disease Stage | Description | Gene Ratio | Bg Ratio | pvalue | p.adjust | Count |
| GO:003010018 | Esophagus | ESCC | regulation of endocytosis | 135/8552 | 211/18723 | 5.75e-08 | 1.02e-06 | 135 |
| GO:003150314 | Esophagus | ESCC | protein-containing complex localization | 139/8552 | 220/18723 | 1.14e-07 | 1.85e-06 | 139 |
| GO:004311218 | Esophagus | ESCC | receptor metabolic process | 104/8552 | 166/18723 | 7.44e-06 | 7.37e-05 | 104 |
| GO:000689818 | Esophagus | ESCC | receptor-mediated endocytosis | 142/8552 | 244/18723 | 5.22e-05 | 4.05e-04 | 142 |
| GO:007064612 | Esophagus | ESCC | protein modification by small protein removal | 95/8552 | 157/18723 | 1.25e-04 | 8.56e-04 | 95 |
| GO:004825916 | Esophagus | ESCC | regulation of receptor-mediated endocytosis | 66/8552 | 110/18723 | 1.72e-03 | 7.96e-03 | 66 |
| GO:0097305111 | Esophagus | ESCC | response to alcohol | 138/8552 | 253/18723 | 2.70e-03 | 1.14e-02 | 138 |
| GO:00165793 | Esophagus | ESCC | protein deubiquitination | 79/8552 | 139/18723 | 5.23e-03 | 1.97e-02 | 79 |
| GO:003010020 | Thyroid | PTC | regulation of endocytosis | 108/5968 | 211/18723 | 3.92e-09 | 1.04e-07 | 108 |
| GO:00315037 | Thyroid | PTC | protein-containing complex localization | 107/5968 | 220/18723 | 1.47e-07 | 2.82e-06 | 107 |
| GO:0006898110 | Thyroid | PTC | receptor-mediated endocytosis | 112/5968 | 244/18723 | 2.87e-06 | 3.74e-05 | 112 |
| GO:004825918 | Thyroid | PTC | regulation of receptor-mediated endocytosis | 55/5968 | 110/18723 | 5.64e-05 | 4.99e-04 | 55 |
| GO:004311219 | Thyroid | PTC | receptor metabolic process | 77/5968 | 166/18723 | 6.21e-05 | 5.47e-04 | 77 |
| GO:0097305113 | Thyroid | PTC | response to alcohol | 107/5968 | 253/18723 | 2.92e-04 | 2.07e-03 | 107 |
| GO:00706465 | Thyroid | PTC | protein modification by small protein removal | 71/5968 | 157/18723 | 3.03e-04 | 2.12e-03 | 71 |
| GO:00165794 | Thyroid | PTC | protein deubiquitination | 59/5968 | 139/18723 | 5.50e-03 | 2.50e-02 | 59 |
| GO:0030100111 | Thyroid | ATC | regulation of endocytosis | 113/6293 | 211/18723 | 1.71e-09 | 4.22e-08 | 113 |
| GO:000689826 | Thyroid | ATC | receptor-mediated endocytosis | 118/6293 | 244/18723 | 1.17e-06 | 1.50e-05 | 118 |
| GO:003150316 | Thyroid | ATC | protein-containing complex localization | 108/6293 | 220/18723 | 1.33e-06 | 1.69e-05 | 108 |
| GO:004311224 | Thyroid | ATC | receptor metabolic process | 82/6293 | 166/18723 | 1.78e-05 | 1.63e-04 | 82 |
| Page: 1 2 |
| Pathway ID | Tissue | Disease Stage | Description | Gene Ratio | Bg Ratio | pvalue | p.adjust | qvalue | Count |
| Page: 1 |
Top |
Cell-cell communication analysis |
| Identification of potential cell-cell interactions between two cell types and their ligand-receptor pairs for different disease states |
| Ligand | Receptor | LRpair | Pathway | Tissue | Disease Stage |
| Page: 1 |
Top |
Single-cell gene regulatory network inference analysis |
| Find out the significant the regulons (TFs) and the target genes of each regulon across cell types for different disease states |
| TF | Cell Type | Tissue | Disease Stage | Target Gene | RSS | Regulon Activity |
| ∗The dot plots of a searched regulon are shown for all cell subpopulations in each disease state of each tissue based on the regulon specific score inferred using pySCENIC and by calculating the average expression. |
| Page: 1 |
Top |
Somatic mutation of malignant transformation related genes |
| Annotation of somatic variants for genes involved in malignant transformation |
| Hugo Symbol | Variant Class | Variant Classification | dbSNP RS | HGVSc | HGVSp | HGVSp Short | SWISSPROT | BIOTYPE | SIFT | PolyPhen | Tumor Sample Barcode | Tissue | Histology | Sex | Age | Stage | Therapy Types | Drugs | Outcome |
| USP46 | SNV | Missense_Mutation | c.508G>A | p.Glu170Lys | p.E170K | P62068 | protein_coding | tolerated(0.29) | possibly_damaging(0.861) | TCGA-BH-A1EV-01 | Breast | breast invasive carcinoma | Female | <65 | III/IV | Unknown | Unknown | PD | |
| USP46 | deletion | Frame_Shift_Del | novel | c.936delN | p.His313IlefsTer6 | p.H313Ifs*6 | P62068 | protein_coding | TCGA-D8-A27V-01 | Breast | breast invasive carcinoma | Female | <65 | I/II | Hormone Therapy | tamoxiphen | SD | ||
| USP46 | SNV | Missense_Mutation | c.475G>C | p.Glu159Gln | p.E159Q | P62068 | protein_coding | tolerated(0.53) | benign(0.009) | TCGA-LP-A4AV-01 | Cervix | cervical & endocervical cancer | Female | <65 | I/II | Unknown | Unknown | SD | |
| USP46 | SNV | Missense_Mutation | c.4A>C | p.Thr2Pro | p.T2P | P62068 | protein_coding | tolerated_low_confidence(0.27) | benign(0) | TCGA-AA-3510-01 | Colorectum | colon adenocarcinoma | Male | >=65 | I/II | Unknown | Unknown | SD | |
| USP46 | SNV | Missense_Mutation | c.244G>A | p.Asp82Asn | p.D82N | P62068 | protein_coding | deleterious(0.01) | probably_damaging(1) | TCGA-AA-3811-01 | Colorectum | colon adenocarcinoma | Female | >=65 | III/IV | Unknown | Unknown | PD | |
| USP46 | SNV | Missense_Mutation | novel | c.435N>C | p.Gln145His | p.Q145H | P62068 | protein_coding | tolerated(0.08) | possibly_damaging(0.637) | TCGA-AA-A00N-01 | Colorectum | colon adenocarcinoma | Male | >=65 | I/II | Unknown | Unknown | PD |
| USP46 | SNV | Missense_Mutation | novel | c.353N>C | p.Gln118Pro | p.Q118P | P62068 | protein_coding | deleterious(0.02) | probably_damaging(0.994) | TCGA-AM-5820-01 | Colorectum | colon adenocarcinoma | Female | <65 | I/II | Unknown | Unknown | SD |
| USP46 | SNV | Missense_Mutation | c.202N>A | p.Ala68Thr | p.A68T | P62068 | protein_coding | tolerated(0.18) | benign(0.005) | TCGA-AZ-6601-01 | Colorectum | colon adenocarcinoma | Male | >=65 | I/II | Unknown | Unknown | PD | |
| USP46 | SNV | Missense_Mutation | novel | c.957N>C | p.Lys319Asn | p.K319N | P62068 | protein_coding | deleterious(0) | probably_damaging(0.998) | TCGA-CA-6717-01 | Colorectum | colon adenocarcinoma | Male | <65 | I/II | Chemotherapy | oxaliplatin | CR |
| USP46 | SNV | Missense_Mutation | novel | c.300N>T | p.Lys100Asn | p.K100N | P62068 | protein_coding | deleterious(0.03) | probably_damaging(0.986) | TCGA-CA-6717-01 | Colorectum | colon adenocarcinoma | Male | <65 | I/II | Chemotherapy | oxaliplatin | CR |
| Page: 1 2 3 4 5 |
Top |
Related drugs of malignant transformation related genes |
| Identification of chemicals and drugs interact with genes involved in malignant transfromation |
| (DGIdb 4.0) |
| Entrez ID | Symbol | Category | Interaction Types | Drug Claim Name | Drug Name | PMIDs |
| Page: 1 |

Copyright 2023-Present -The University of Texas Health Science Center at Houston |